Deficits and Debt in Contemporary U.S. Fiscal Policy: Updating Our Priors
Testimony of Jared Bernstein, Senior Fellow, Before the House Budget Committee[1]
In recent years, U.S. fiscal policy has been historically unusual. Instead of the fiscal consolidation we might expect in the midst of a historically long expansion with the economy closing in on full capacity, our fiscal accounts have grown more unbalanced. I’ve sometimes referred to this phenomenon as “upside-down Keynesianism:” applying fiscal stimulus in a pro-cyclical manner, i.e., to an improving economy, versus the much more traditional counter-cyclical approach.
And yet, there is no evidence that our unusually elevated deficits have led to the kinds of economic problems many economists and policymakers have long associated with such fiscal imbalances, such as inflationary “overheating,” or upward pressure on interest rates. To the contrary, and this is longer-term result — it applies beyond the last few years — the costs of fiscal imbalances in terms of macroeconomic distortions have been largely elusive.
Though policymakers still often voice concerns about rising deficits and debt, their actions suggest less concern, as both spending and tax cuts have been almost exclusively deficit financed in recent years. The analysis below examines the origins of the current fiscal situation, but it also asks: is this situation problematic? Do deficits matter anymore?
"Knee-jerk deficit reduction, without regard for the distinction between useful and wasteful debt, is highly counter-productive."I argue that they do, and that steps should be taken to consolidate our fiscal accounts as we close in on full employment, steps that should include progressive tax increases.[2] But I also stress new research and evidence that should lead us to update our prior views regarding the importance of deficit reduction. Knee-jerk deficit reduction, without regard for the distinction between useful and wasteful debt, is highly counter-productive. It ignores key lessons in recent public finance and its burdens invariably fall on the most economically vulnerable persons.
But I also argue that deficits still matter, and that sensible risk management requires greater concern about our growing fiscal imbalances. One problem I stress is the constraint posed by the perception of diminished fiscal space. That is, if — more likely “when” — the U.S. economy enters the next recession with an historically elevated debt-to-GDP ratio, there is a worrying likelihood that Congress will do too little in terms of deficit-financed counter-cyclical fiscal policy. In this regard, my testimony strongly emphasizes the difference between limited perceived fiscal space, and actual fiscal space, the latter of which should be ample to offset whatever demand contraction the next downturn delivers.
In other words, new fiscal evidence does not relieve policymakers of any budget constraints, nor does it suggest that any desired spending should blithely go on the national credit card. But it does provide a more nuanced, far less cramped understanding of the economic costs of budget deficits and the potential benefits to society’s welfare of investing in people and places who have long needed the help.
The Current Fiscal Situation and Outlook
According to the Congressional Budget Office (CBO), the deficit in fiscal year 2019 was about $980 billion, or 4.6 percent of GDP.[3] Historically, as the table below shows, when the unemployment rate, currently 3.6 percent, has been below 4.5 percent, the average deficit as a share of GDP has been about zero and the average debt ratio has been less than half of its current level.
| TABLE 1 | ||
|---|---|---|
| Debt and Deficits as Shares of GDP for Different Unemployment Rates: Fiscal Years 1965-2017 | ||
| FY Unemployment Rates | Average Deficits/GDP | Average Debt/GDP |
| 3.5% - 4.5% | 0.0% | 32.7% |
| 4.5% - 6% | 1.9% | 41.1% |
| 6% and higher | 4.5% | 42.6% |
| Current (3.6%) | 4.6% | 79.2% |
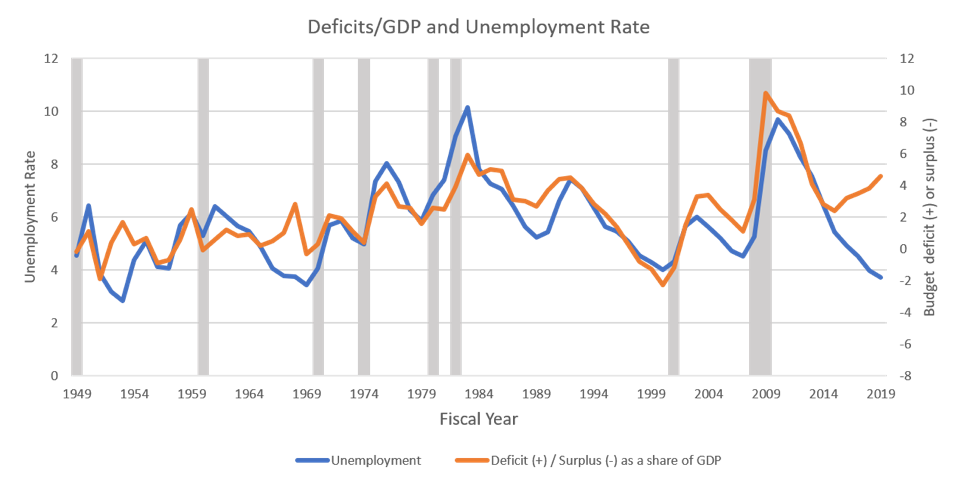
This makes sense, because when an advanced economy like ours, with a mature system of taxation in place, is in a long expansion, we expect to see deficits shrink relative to GDP. More employment generates more labor income, more consumer spending and investment generates more capital income (profits), and these in turn spin off more revenue for the Treasury. Figure 1 shows this historical relationship by plotting the co-movements in the unemployment rate and the deficit-to-GDP ratio. The end of the figure, however, reveals that this trend has recently reversed. Our large, current deficit relative to our low unemployment rate is telling us that something important, and, in my view, worrisome, has changed. One of the points of this testimony is that the main thing that has changed is the revenue function described above and shown in the figure has been partially dismantled by the 2017 tax cuts.
Spending matters too, of course, but the data show that the current (fiscal year 2019) spending share of GDP is about what we expected before the tax cuts, while the revenue share is far below our pre-tax-cut expectation (See Table 2).
Our unusually large federal budget deficits in an economy with such low unemployment (see Table 1 and Figure 1) might be expected to put upward pressure on interest rates.[4] Such expectations were born of a model predicting that as the economy heats up, private investors compete with the government for loanable funds, putting upward pressure on the cost of borrowing. But this prediction isn’t just wrong today. It has been wrong for many years now. As the scatterplots below show, there was a time when deficits and interest rates were clearly negatively correlated, but that hasn’t been the case for years.[5]
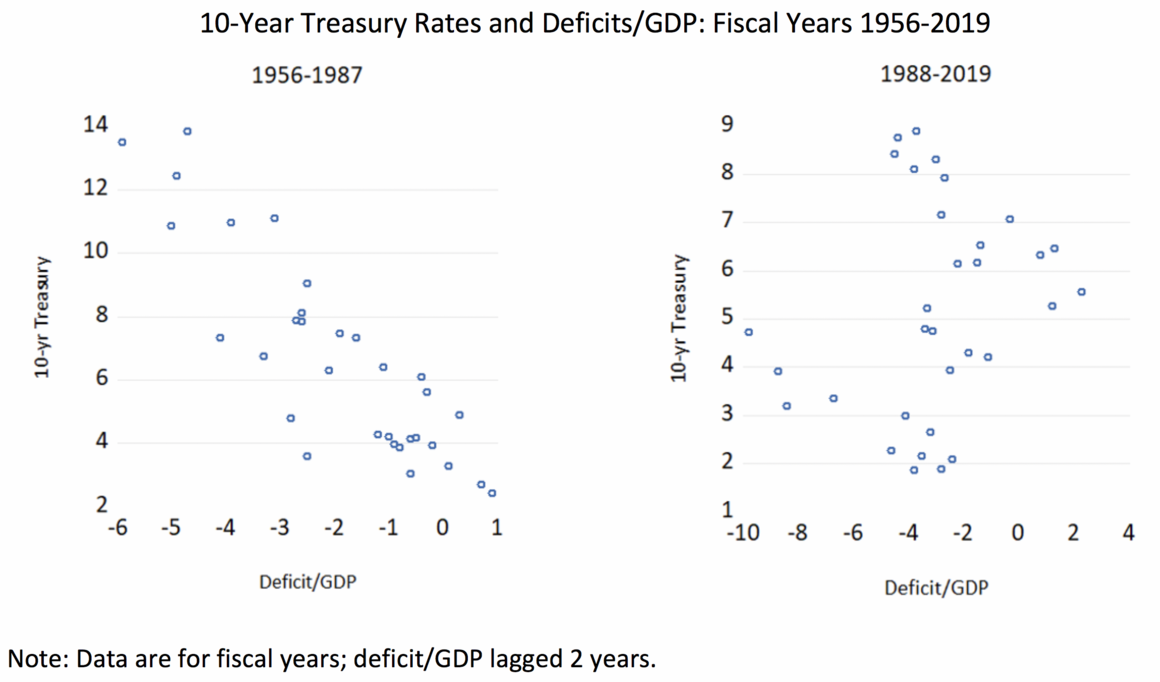
Thus, I devote the next section to updating our prior views and beliefs about the impact of public deficits. As I will argue, the random scatterplot on the right should not be taken to mean that deficits simply don’t matter anymore. They do. But if it was ever warranted, knee-jerk antipathy to budget deficits, and the austere policies such views often promote, is clearly both wrong-headed and outdated.
The fiscal impulse from our currently elevated deficit (Table 1) added to growth in 2017 and 2018, but as that impulse has faded, real GDP growth has downshifted from about 3 percent per year to its prior trend of about 2 percent.[6] A notable point in this context — a point relevant to our current fiscal situation — is that the alleged “supply-side” effects that were a selling point by proponents of the 2017 tax cut (TCJA) have not yet materialized.[7] Consider, as a particularly salient example, the recent trend in business investment, one of the first links in the claimed chain of outcomes from the sharp cuts in corporate taxes at the heart of the TCJA. In fact, such investment has slowed considerably since the tax cuts and turned negative in terms of its contribution to GDP growth in both of the past two quarters.[8] Moreover, prior research has shown the lack of correlation between high-end tax cuts and the supply-side chain of higher investment leading to faster productivity growth.[9]
For these reasons, claims that the tax cut would pay for itself are belied with every new Treasury Report on our fiscal accounts.[10] Predictably, a key factor in the growth of recent deficits has been the loss of revenues due to the tax cut.
In the just-completed fiscal year 2019, revenues as a share of GDP were 16.3 percent, below both the long-term average of 17.4 percent, and more germanely, below the 40-year average at comparable points in prior business cycles of 18.4 percent.[11] That is, based on the revenues generated by prior tax regimes, the current economy should arguably be spinning off more than 2 percentage points of GDP higher revenue, or over $400 billion. Given that the top corporate rate was cut sharply in the TCJA, from 35 to 21 percent, it is notable that fiscal year 2019 receipts from corporate taxes — 1.1 percent of GDP — were, according to CBO, “among the lowest recorded since 2009 and below the 50-year average of 1.9 percent of GDP.”[12] Fiscal year 2019 spending of 21 percent of GDP was also higher than its long-term average of 20.4 percent, in part reflecting demographic pressures from retiring baby boomers.
To provide a clearer context within which to judge the impact of the tax cut on the current fiscal outlook, it is useful to compare today’s actual numbers to those projected prior to the tax cuts. The figure below does so by using CBO’s June 2017 budget forecast, its last before it factored in the impact of the tax cuts. Back then, CBO predicted that fiscal year 2019 revenues would equal 17.8 percent of GDP and spending, 21.2 percent. The actual results show spending came in slightly lower than predicted and revenues significantly lower, by 1.5 percent points of GDP.
| TABLE 2 | ||||
|---|---|---|---|---|
| Revenues and Spending as Shares of GDP: Pre-Tax Cut Forecast and 2019 Actual | ||||
| Pre-Tax Cut Forecast for 2019 | Actual, 2019 | Difference | ||
| Revenues | 17.8% | 16.3% | -1.5 | |
| Spending | 21.2% | 21.0% | -0.2 | |
This comparison says nothing about the appropriateness of the levels of spending or revenues: we can and should have robust arguments about both. Its point is that it is analytically inconsistent with widely accepted baseline projections to argue that the increase in the current deficit was due to unexpected spending increases. It is instead clearly a function of lost revenue due to the tax cuts.
Longer-term expectations are for further increases in deficits and debt. In a recent report, my CBPP colleagues forecast that the debt ratio, currently 79 percent, would rise to 93 percent by 2029 and 111 percent by 2044 under current law.[13] Note that these estimates assume the expiration of those parts of the TCJA scheduled to do so post-2025. But if “policymakers made current tax policies permanent without offsetting the cost, [CBPP’s] projected debt ratio in 2044 would rise from 111 to 139 percent.”[14]
The forces driving these long-term forecasts are increased spending on retirement and health security — driven not by spending on new policies but by our aging demographics and rising health costs — insufficient revenues, especially if the tax cuts are extended, and increased interest payments.
Notably, one force not driving the rising debt-ratio forecast is non-defense discretionary spending, which is expected to fall to historical lows as a share of GDP. These programs, whose funding is still below their 2010 real level, include “priorities such as education, scientific research, infrastructure, national parks and forests, environmental protection, some low-income assistance, and public health, as well as many basic government operations including law enforcement, courts, and tax collection. The category also includes many programs related to national security, including foreign aid, homeland security, and services for veterans.”[15] Non-defense discretionary spending also funnels resources through states or local school districts to support K-12 education, along with Head Start. Below, when I talk about the need to invest in public goods, these are some of the sorts of investments about which I’m thinking, especially given the disinvestment path they’ve been on.
Updating Our Priors
Thus far, this testimony has highlighted two seemingly contradictory facts. One, fiscal deficits are unusually high for this stage of the economic recovery, and two, these deficits are not pushing up interest rates. There is, in both the current economy and in market expectations for the future, no evidence of either “crowding out” — higher interest rates due to public borrowing competing with private borrowing for loanable funds — or overheating (quickly rising inflation and/or wage growth).
These two facts raise two questions: Why are historically large, persistent deficits not creating upward pressure on interest rates, and if the increased flow of deficits and the resulting higher stock of debt is not having negative economic consequences, does that mean deficits don’t matter and policymakers should continue putting their preferences of the national “credit card?”
The answer to the first question is that it is and always was mistaken to think of “loanable funds” as a fixed lump of capital that borrowers from the public and private sector must fight over. For one, the U.S. prints its own currency, meaning that the supply of credit and the interest rate vary with rate-setting policies of the central bank (our sovereign currency also means that, inflationary concerns aside, the U.S. can always finance its debt). It is thus not incidental that the Federal Reserve held its benchmark interest rate below 1 percent for most of the past decade (the average effective federal funds rate has been 0.6 percent from November 2009 through November 2019). The Fed’s successful “anchoring of inflationary expectations” has also contributed to lower interest rates by reducing inflation premiums required by bond investors.
The fact that our economy is large and open, with deep, liquid, global credit markets, and that global savings net of investment has increased considerably in recent decades also plays a role.[16] Finally, our debt is considered among the world’s safest places to invest excess savings, even at historically low rates (though U.S. rates are higher than most of those in other advanced economies). Taken together, these evolving monetary and global capital dynamics help explain high deficits at low interest rates.
Aside from the lump-of-loanable-funds fallacy, simple macroeconomics suggests that deficits are not leading to faster inflation and higher rates because the U.S. economy has not been operating at full capacity, even with the considerable fiscal stimulus from the deficit-financed tax cuts and spending in the last few years. For either public or private spending to generate overheating conditions, aggregate demand must exceed supply, such that any extra demand (say, from more deficit spending), would generate not more jobs and higher real incomes, but just more inflation. Priors in this area of economics also require updating, most notably the unobserved so-called natural rate of unemployment, or the lowest unemployment rate consistent with stable prices. In recent years, the jobless rate has been persistently below conventional estimates of the natural rate, yet inflation has failed to accelerate, and wage growth has also been somewhat sluggish. Under these conditions, fiscal stimulus is more likely to contribute to growth and jobs.
One further data relationship that requires updating comes from research papers by Kogan et al.[17] and more recently, by my co-panelist Olivier Blanchard.[18] These papers emphasize the fact that when the economy’s growth rate is greater than the interest rate on its debt, a given stock of debt will decline as a percent of GDP without tax increases or spending cuts. Of course, the phrase “a given stock of debt” means that you are not adding to it by raising less in revenues than the cost of federal programs. For this reason, and as I discuss in a moment, debt stabilization also depends on the size of the deficit net of interest payments on the debt (the “primary” deficit), which has been climbing in recent years. But if the primary deficit stays low enough, when the growth rate is higher than the interest rate on government debt, the government can keep rolling over its debt and not only will the debt ratio not rise; it will fall. Conversely, when the interest rate exceeds the growth rate, the debt-to-GDP ratio will rise even if the government is collecting enough revenue to pay for its programs (i.e., even if the primary deficit is balanced).
The question is thus: what does the historical record tell us about the relative magnitudes of the growth rate and the interest rate? Both Kogan et al. and Blanchard find that over most of our history, on average, the growth rate has exceeded the interest rate. For example, in Blanchard’s analysis, since 1950, the average nominal interest rate “has been substantially lower than the average nominal growth rate, 3.8 percent versus 6.3 percent.”
Why, then, has our debt ratio gone up? Because we haven’t just maintained the level of our deficit spending; we’ve sharply increased it. The debt arithmetic in these papers doesn’t say the debt ratio will never increase if growth rates stay above interest rates. It says that the debt will stabilize conditional on how much is being added to the primary deficit.[19]
How do the relevant values stack up today? In recent years, the nominal GDP growth rate has been on the low side, historically, but interest rates have been even lower. To smooth out the volatility in both rates, it’s useful to take moving averages. Through 2019, the 10-year average growth rate is 3.9 percent while the relevant interest rate is 2.3 percent. At this level, debt stabilization will occur with a primary deficit of 1.1 percent of GDP, over $200 billion. That fact that our current primary deficit is more than twice that level explains why, even with these favorable debt/growth dynamics, the debt-to-GDP ratio is rising.[20]
Which takes us to the second and perhaps most portentous question posed by this hearing: do increasing deficits and debt matter?
Yes, Deficits Matter. Here’s Why.
The key lessons of this testimony so far are that it is a serious mistake to assume that deficits will pressure interest rates, especially when there’s economic slack, strong capital flows, excess savings over investment, and well-anchored inflation. Moreover, when the growth rate surpasses the interest rate, the fiscal cost of debt stabilization is diminished. These facts should push strongly against knee-jerk, austere fiscal policy. When borrowing is cheap, they should lead policymakers to willingly consider deficit-financed investments in growth-oriented public goods, a point I return to below.
But, for the following reasons, these facts should not obviate any concerns about our persistent fiscal imbalances.
Interest Rates Could, of Course, Eventually Rise
As the scatterplot above shows, there was a period when deficits and interest rates were negatively correlated. Correlation is not causation, so this concern does not necessary reflect a return of “crowd-out.” It is just saying that prudent risk management does not assign a zero probability to future higher rates. Such risk assessment must incorporate the fact that the growing magnitude of our stock of publicly held debt means that for any rate increase, more national income must be devoted to debt service.
More Leakage of Interest Payments
One consequence of financing more of our public debt with foreign capital is that an increasing share of our GDP “leaks out” of the United States in debt payments abroad. Back in 1970, public debt held by foreigners amounted to less than 2 percent of GDP; most recently, the share was 30 percent. As a result of this increase, a larger share of the income generated in the United States flows to residents of other countries rather than to residents of the United States.
The Absence of Perceived Fiscal Space
When the macroeconomy weakens due to a negative demand shock, the two main policy responses derive from monetary and fiscal policy. The former involves actions by the Federal Reserve to reduce the cost of credit, while the latter takes the form of deficit-financed, counter-cyclical fiscal policy, both automatic (e.g., Unemployment Insurance, nutritional support) and discretionary. For some of the same reasons discussed above as to why interest rates have been low, the Fed is likely to have reduced monetary space — room to lower their benchmark interest rate — in the next downturn. In this case, monetary space is limited by the fact that zero forms an effective lower bound on interest rates.[21] Fiscal space, conversely, does not face an analogous limit.
However, research by Christina Romer and David Romer finds that countries that go into recessions with high debt-to-GDP ratios, e.g., over 80 percent, tend to do less counter-cyclical fiscal stimulus than is needed to offset the demand contraction relative to a country headed into a downturn with less public debt.[22] Empirically, Romer and Romer find the growth consequences of this bias is economically significant: “The fall in GDP with fiscal space is just 1.4 percent. The fall in GDP following a crisis without fiscal space reaches a maximum of 8.1 percent.”
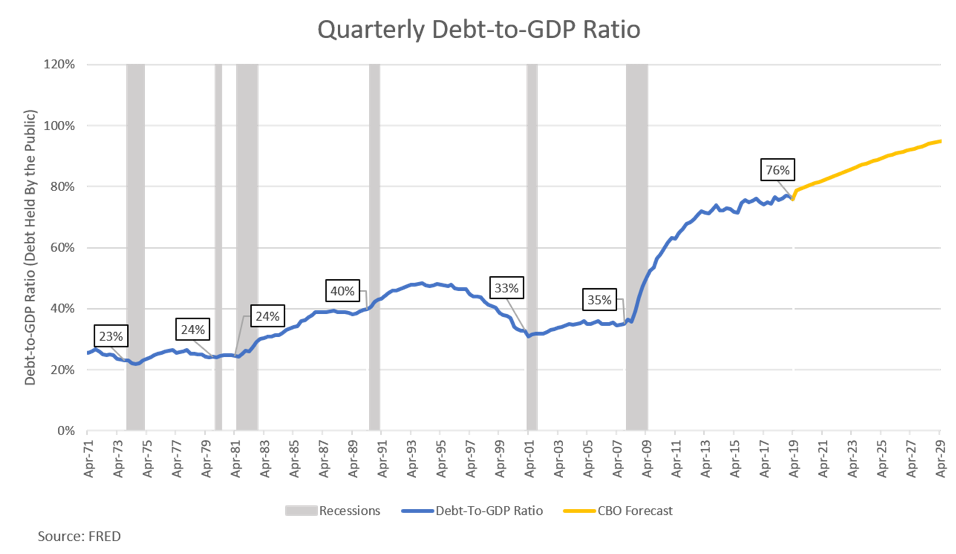
The figure below shows that historically, the United States has entered recessions with a debt-to-GDP ratio between 25-40 percent, less than half the debt ratio that will likely prevail when the next downturn hits. This, to my thinking, is one of the most worrisome aspects of our current, elevated debt levels, especially given the fact that monetary policy, which faces an actual (as opposed to a “perceived”) space constraint, may be unable to contribute the necessary jolt of stimulus necessary to help offset the next downturn.
I have, in this regard, a strong message for this committee: while the historical pattern does raise the specter of an inadequate fiscal response to the next downturn, at least in the United States’ case, the limiting factor is not actual fiscal space, it is perceived fiscal space. That is, even if — I’d guess “when” — the nation enters the next recession with historically high debt-to-GDP levels, we should apply all the necessary, deficit-financed counter-cyclical policy necessary to offset the recession. To do otherwise — to practice fiscal austerity when fiscal support is needed — is to needlessly consign millions of Americans to economic losses that could be avoided, and, paradoxically, to risk worsening the debt ratio.[23] Moreover, based on who is and isn’t insulated from the pain of recession, these Americans will disproportionately be economically vulnerable, low income, and persons of color.
Greater Difficulty Funding Priorities
A final reason deficits still matter is that, especially if interest rates rise, they could make it harder to achieve political support to fund current obligations, and even harder to support outlays on new priorities. CBPP estimates that over the next 25 years, stabilizing the debt at its current level of 79 percent of GDP would require raising revenues or cutting spending by an average 1.5 percent of GDP, equivalent to over $300 billion in 2019 alone.[24] To be clear, standard spending projections show that federal spending as a share of GDP is expected to rise not because of new programs but because of demographic and, as regards health care, price pressures on existing programs. These pressures create the likelihood that rising debt service will generate political competition between debt reduction and other budget functions that would be diminished if debt were stabilized.
How Should Policymakers With Updated Priors Think About Fiscal Policy?
For these reasons, policymakers charged with fiscal authority should neither ignore deficits nor be hamstrung by them in the face of useful and necessary expenditures. Here are guidelines I believe are justified by our updated priors.
As the Economy Closes in on Full Employment, the Deficit Should Be Moving Towards Primary Balance
That is, the debt ratio should be first stabilized and then reduced as the economy approaches full capacity. Clearly, I have argued that repairing the connective tissue between economic growth and higher revenue that was torn by the TCJA is necessary. Usefully, we are in the middle of a robust debate about ways to progressively repair the damage to the tax code, and I’d be happy to comment on what I believe are the most promising ideas in this space.
Reducing spending pressures is also necessary, and one important place in the budget to so is health care.[25] As my colleague Paul Van de Water wrote, while policymakers “should pursue opportunities to reduce cost growth in Medicare and Medicaid…they should do so in ways that don’t place burdens on people of modest means…and don’t reduce access to health care or compromise the quality of care.[26] Even with a vigorous effort to control costs, however, spending on the federal government’s major health programs is bound to rise significantly [due in part to demographic pressures] as a percentage of GDP, and consequently so will federal spending overall.”
Today, we benefit from a robust debate about the health reform agenda that might ultimately reduce cost pressures while protecting vulnerable populations. After all, while our uninsured rate is about 9 percent, or 29 million persons,[27]comparably wealthy countries to the United States generally provide universal coverage with equal or better outcomes (especially regarding longevity of less-well off persons) while spending about half as much, per capita, as we do.[28] In earlier congressional testimony, I suggested a number of policy reforms designed to accomplish this goal.[29]
There’s Good Debt and Bad Debt
One conclusion from this testimony is that the economic cost of public deficits has proven to be lower than conventional wisdom previously maintained. But even if they’re less binding than many economists heretofore believed, budget constraints still exist and, as I’ve outlined, there are reasons for Congress to better manage the risks posed by our current fiscal outlook. In other words, our evolving understanding of the role of fiscal debt provides both opportunities and risks. The former implies more leeway to use deficit spending to make necessary, productive investments; the latter means avoiding adding to our already historically elevated debt for non-productive, or wasteful spending and/or tax cuts.
I’ve written about this duality under the rubric of good debt (GD) and bad debt (BD):[30]
No matter how low interest rates are, it will always make more sense to borrow for GD than BD. The challenge, of course, is that we need a definition of GD that works for most of us. Mine is simple: GD invests in people and places that need the help; BD does not.
Thus, a countercyclical Keynesian stimulus, meaning deficit spending in a recession to offset a demand contraction leading to higher unemployment, is GD, because under those conditions, a lot of people need help. However, what I call “upside-down Keynesianism” — stimulating an economy that’s already closing in on full employment with tax cuts to the wealthy and corporations . . . well, that’s some seriously BD. Instead, had the $2 trillion in deficit-financed tax cuts instead gone to poverty reduction, jobs for those left behind, housing for those lacking shelter, affordable health and child care, productive infrastructure investments the private sector won’t make . . . well, now we’re talking about GD.
Considering the set of unmet needs we observe in communities across the country, along with the threat from climate change, there exists a deep, rich set of GD investment opportunities. Tens of millions remain un- or underinsured in terms of health coverage, the impact of climate change is already being felt in volatile and costly weather patterns, the cost of college is a constraint to many families of moderate means, much of our public infrastructure needs upgrading, long-term wage stagnation has constrained the living standards of many working households, and there are significant swaths of people and places that have been left out of the current economic expansion.[31]
A final macroeconomic point ties these public investment opportunities back to the low interest rates that have prevailed even as deficits have grown. As noted above, interest rates have fallen in recent decades in advanced economies across the globe, and literature on “secular stagnation” has noted that this is consistent with a high level of desired private saving relative to desired private investment. However, if private investors are underinvesting relative to available savings, there is even greater reason for the public sector to invest in the problem areas just noted. Not only would such “GD” help to boost productivity by investing in physical and human capital, but it would help replace some of the demand shortfall characterized by “secular stagnation.”
Conclusion
Evidence from recent decades suggests the need for policymakers to update widely held views about the impact of budget deficits on economies. There is, for example, little evidence to support the claim that budget deficits in expansions will necessarily lead to “overheating” or upward pressure on interest rates. In fact, our current deficit is unusually high given the near-full capacity of the current economy, yet interest rates and inflation remain low. There are reasons for this, including robust capital flows purchasing U.S. debt, some degree of untapped capacity, and monetary policy that has kept its benchmark rate below 1 percent, on average, for the past decade.
However, these developments should not be taken to imply that budget constraints no longer exist. Deficits and debt still matter.
Interest rates could, of course, rise, and given our highly elevated stock of public debt, this would increase the share of both the budget and national income devoted to debt service, more of which would flow out of the country relative to earlier periods when almost all of our debt was domestically held. Other reasons deficits matter including the lack of perceived (versus actual) fiscal space, threatening an inadequate fiscal response to the next downturn.
These concerns argue for a fiscal policy with more responsible risk management that would achieve fiscal consolidation when the economy closes in on full capacity, which in turn calls for repairing the damage done by the TCJA to our revenue function. This invokes the need for more progressive taxation.
Perhaps most importantly, it calls for recognizing the difference between useful, productive debt that invests in necessary public goods, including in both human and physical capital, and wasteful, inequality-inducing debt that redistributes income upward with no tangible benefits for the economy or most of the people in it.
End Notes
[1] Senior fellow, CBPP. The views herein are my own. Thanks to Kathleen Bryant, Richard Kogan, Joel Friedman, and Katie Windham for helpful comments and formatting. Any mistakes are my own.
[2] Chuck Marr, Samantha Jacoby, and Kathleen Bryant, “Substantial Income of Wealthy Households Escapes Annual Taxation or Enjoys Special Tax Breaks,” Center on Budget and Policy Priorities, November 13, 2019, https://www.cbpp.org/research/federal-tax/substantial-income-of-wealthy-households-escapes-annual-taxation-or-enjoys.
[3] Congressional Budget Office, “Monthly Budget Review: Summary for Fiscal Year 2019,” November 7, 2019, https://www.cbo.gov/publication/55824.
[4] Some argue the unemployment rate overstates the tightness of the labor market, as it leaves out those who have given up the job search. As I’ve previously shown, however, the unemployment rate still correlates quite highly with numerous other, more inclusive measures. See: Jared Bernstein, “No question, the unemployment rate paints an incomplete picture…and yet…”, On the Economy, July 15, 2019, http://jaredbernsteinblog.com/no-question-the-unemployment-rate-paints-an-incomplete-picture-and-yet/.
[5] The deficit/GDP ratio is lagged two periods (fiscal years) as this lag produced the highest negative correlation between the two variables. However, the figures look very similar using one lag or coincident timing.
[6] See: Brookings Institution, “Hutchins Center Fiscal Impact Measure,” October 30, 2019, https://www.brookings.edu/interactives/hutchins-center-fiscal-impact-measure/. These fiscal-impulse dynamics are clear in this tracker from the Brookings Institution’s Hutchins Center. Note the forecast for a slight negative fiscal contribution beginning next year.
[7] The claim is that tax cuts targeted at the wealthy will boost the growth of the economy’s key supply-side variables: productivity and labor supply. The cuts will thus lead to faster growth, which will help offset their revenue costs.
[8] Jason Furman, “‘Not much’: What macroeconomic data say about the impact of the Tax Cuts and Jobs Act,” American Enterprise Institute, September 18, 2019, https://www.aei.org/economics/not-much-what-macroeconomic-data-say-about-the-impact-of-the-tax-cuts-and-jobs-act/.
[9] Jared Bernstein and Ben Spielberg, “Three Reasons Trickle-Down Tax Cuts Don’t Work, The American Prospect, January 31, 2017, https://prospect.org/economy/three-reasons-trickle-down-tax-cuts-work/.
[10] Damian Paletta and Max Ehrenfreund, “Trump’s treasury secretary: The tax cut ‘will pay for itself,’” The Washington Post, April 20, 2017, https://www.washingtonpost.com/news/wonk/wp/2017/04/20/trumps-treasury-secretary-the-tax-cut-will-pay-for-itself/.
[11] Congressional Budget Office, 2019; Jared Bernstein, “My attempt to cut through the fog of our fiscal debate,” The Washington Post, May 29, 2018, https://www.washingtonpost.com/news/posteverything/wp/2018/05/29/my-attempt-to-cut-through-the-fog-of-our-fiscal-debate/.
[12] Congressional Budget Office, 2019.
[13] Congressional Budget Office, 2019; Richard Kogan, Paul N. Van de Water, and Kathleen Bryant, “Long-Term Budget Outlook Has Improved Substantially Since 2010 But Remains Challenging,” Center on Budget and Policy Priorities, October 10, 2019, https://www.cbpp.org/sites/default/files/atoms/files/10-10-19bud.pdf.
[14] CBPP’s forecast also includes revenues from the enactment of the so-called “Cadillac tax” on high-cost health plans, despite the fact that bipartisan forces have thus far prevented the tax from taking effect.
[15] Center on Budget and Policy Priorities, “Policy Basics: Non-Defense Discretionary Programs,” updated August 12, 2019, https://www.cbpp.org/research/federal-budget/policy-basics-non-defense-discretionary-programs; Richard Kogan, “Budget Deal Still Leaves Non-Defense Appropriations Below 2010 Level,” Center on Budget and Policy Priorities, August 6, 2019, https://www.cbpp.org/blog/budget-deal-still-leaves-non-defense-appropriations-below-2010-level.
[16] Łukasz Rachel and Lawrence H. Summers, “On Secular Stagnation in the Industrialized World,” Brookings Institution, Spring 2019, https://www.brookings.edu/wp-content/uploads/2019/03/RachelSummers_web.pdf.
[17] Richard Kogan et al., “Difference Between Economic Growth Rates and Treasury Interest Rates Significantly Affects Long-Term Budget Outlook,” Center on Budget and Policy Priorities, February 27, 2015, https://www.cbpp.org/sites/default/files/atoms/files/2-27-15bud.pdf.
[18] Olivier Blanchard, “Public Debt and Low Interest Rates,” Peterson Institute for International Economics, February 2019, https://www.piie.com/system/files/documents/wp19-4.pdf.
[19] Kogan et al. point out that the debt stabilization occurs net of financial assets held by the government, such as its student loan portfolio.
[20] I thank Richard Kogan for providing these calculations.
[21] While some central banks have used negative interest rates, the U.S. Federal Reserve has historically rejected this option. The federal funds rate may be around 2 percent when the next downturn hits, when in past downturns, the funds rate was lowered an average of around 5 percentage points. Pushing the other way, however, are recent comments by former Fed Chair Ben Bernanke that non-funds-rate stimulus tools of the Fed, including forward guidance and balance sheet policies, can add the equivalent of 3 percentage points on the funds rate. See: Ben Bernanke, “What’s (not) up with inflation?: So what are the implications for policy?” Brookings Institution, October 4, 2019, https://youtu.be/JmZkpqwtlKU.
[22] The Romer/Romer paper uses 96 percent as a rough cutoff for countries lacking perceived fiscal space, but their figure is for gross public debt, which corresponds to around the 80 percent debt-held-by-the-public value used in the text. See, Christina D. Romer and David H. Romer, “Why Some Times are Different: Macroeconomic Policy and the Aftermath of Financial Crises,” University of California Berkeley, October 2017, https://eml.berkeley.edu/~dromer/papers/Romer&RomerCrisesandPolicyRevised.pdf.
[23] Alan J. Auerbach and Yuriy Gorodnichenko, “Fiscal Stimulus and Fiscal Sustainability,” National Bureau of Economic Research, September 2018, https://www.nber.org/papers/w23789.pdf.
[24] This is the “fiscal gap.” See, Kogan, Van de Water, and Bryant, 2019.
[25] Defense spending is too often ignored in this part of the discussion but evaluating it in this context is beyond my expertise.
[26] Paul N. Van de Water, “Federal Spending and Revenues Will Need to Grow in Coming Years, Not Shrink,” Center on Budget and Policy Priorities, September 6, 2017, https://www.cbpp.org/research/federal-budget/federal-spending-and-revenues-will-need-to-grow-in-coming-years-not-shrink.
[27] Matt Broaddus, “Census: Health Coverage Progress Eroded in 2018,” Center on Budget and Policy Priorities, September 10, 2019, https://www.cbpp.org/blog/census-health-coverage-progress-eroded-in-2018.
[28] Bradley Sawyer and Cynthia Cox, “How does health spending in the US compare to other countries?” Peterson-KFF Health System Tracker, December 7, 2018, https://www.healthsystemtracker.org/chart-collection/health-spending-u-s-compare-countries/#item-average-wealthy-countries-spend-half-much-per-person-health-u-s-spends; Lola Fadulu, “Study Shows Income Gap Between Rich and Poor Keeps Growing, With Deadly Effects,” The New York Times, September 10, 2019, https://www.nytimes.com/2019/09/10/us/politics/gao-income-gap-rich-poor.html.
[29] Jared Bernstein, “Let’s be honest: We also have a revenue problem,” Testimony to the House Financial Services Committee, December 11, 2018, https://financialservices.house.gov/uploadedfiles/12.19.2018_jared_bernsteinl_testimony.pdf.
[30] Jared Bernstein, “A very good economic idea may be about to replace a very bad one,” The Washington Post, January 10, 2019, https://www.washingtonpost.com/outlook/2019/01/10/very-good-economic-idea-may-be-about-replace-very-bad-one/.
[31] “Infrastructure Report Card,” American Society of Civil Engineers, 2017, https://www.infrastructurereportcard.org/.