BEYOND THE NUMBERS
Recent harmful Supplemental Nutrition Assistance Program (SNAP) proposals by some House Republicans should be viewed in the context of the reductions households have already experienced because of the end of pandemic-related benefits, known as emergency allotments (EAs). These additional, temporary SNAP benefits ended after February 2023 benefits were issued in 32 states, Washington, D.C., Guam, and the U.S. Virgin Islands; the other 18 states had discontinued them earlier. In addition to steep benefit cuts for all SNAP households, the end of the EAs resulted in a more than 25 percent decrease in monthly federal SNAP costs for the overall program.
The EAs and other temporary policies, as well as SNAP’s ability to expand automatically to meet greater need, helped ensure that food insecurity rates did not meaningfully increase overall in 2020 or 2021, compared to 2019. These relief efforts also contributed to food insecurity reaching a two-decade low for families with children in 2021. Studies show the EAs reduced poverty and food insufficiency, with the impact being greatest for Black and Hispanic people — an important step in helping to reduce racial and ethnic differences in food hardship.
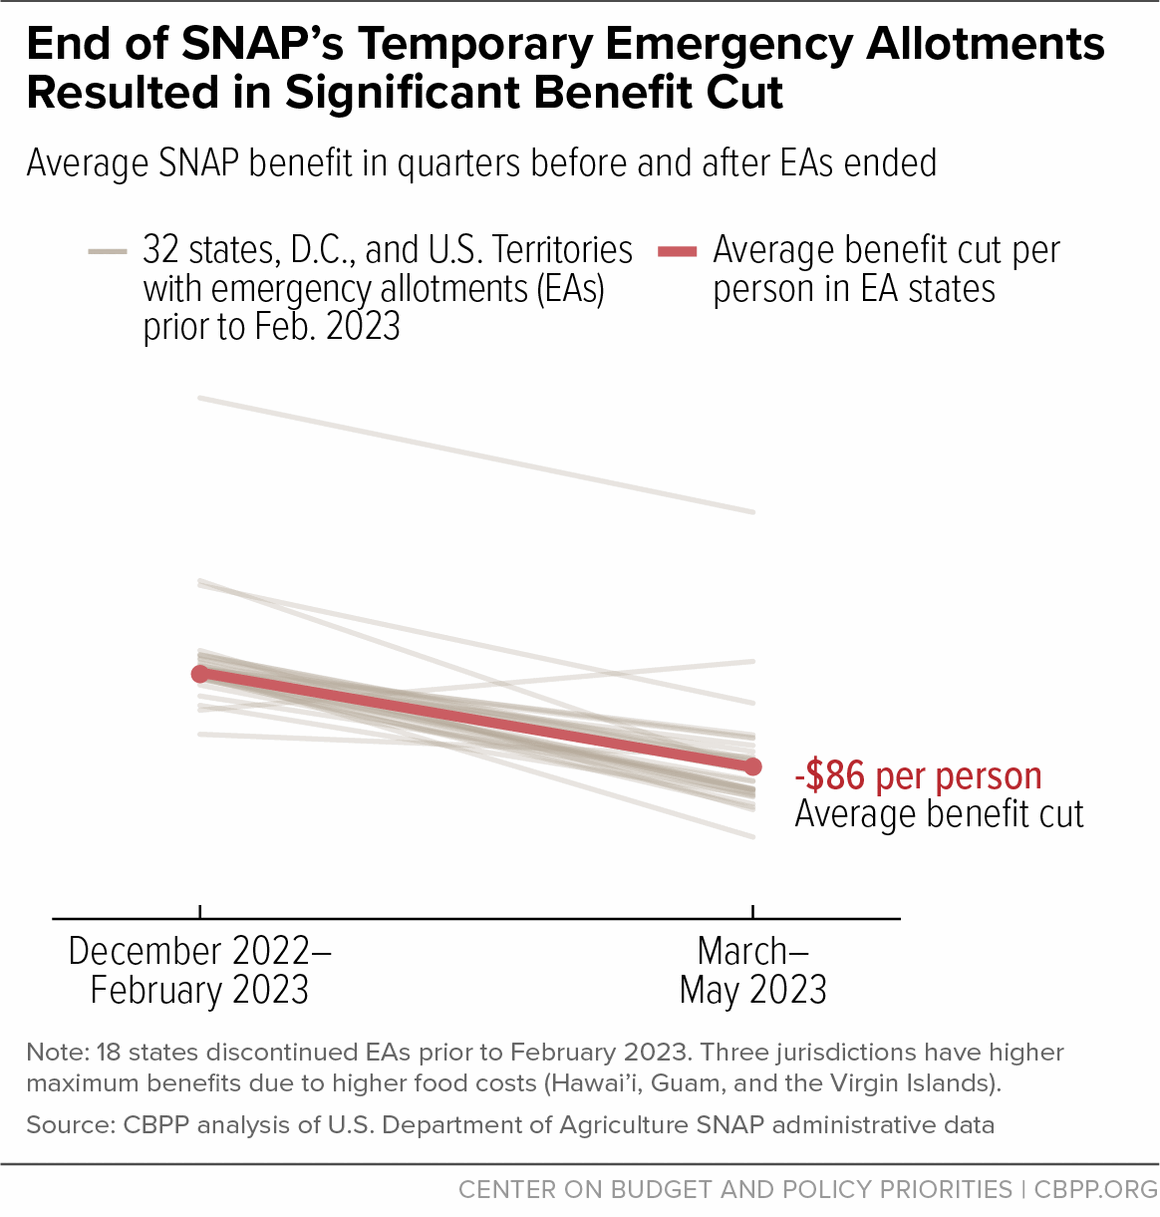
The U.S. Department of Agriculture’s (USDA) SNAP administrative data show SNAP benefits fell significantly in the quarter after EAs ended (March-May 2023) compared to the quarter before EAs ended (December 2022-February 2023) — by as much as 40 percent or more in the states that ended EAs after the February issuance. SNAP households received at least $95 less per month following the end of EAs, though many households experienced even greater reductions. In states that still had EAs through February, the data show a significant drop in benefits between the quarters before and after EAs ended — an average decrease of $86 per person or $163 per household (see first chart and table below).
The EAs were only intended to provide temporary relief during the pandemic, but the reality is that food hardship did not abate with the end of the public health emergency. In fact, early evidence suggests that food hardship increased after EAs ended.
Notably, this loss in food assistance is coming during a time of higher food prices. While the sharp increase in food inflation has moderated considerably, the cost of food remains substantially higher than pre-pandemic levels (about 25 percent). SNAP has an annual cost-of-living adjustment, which will go into effect in October 2023 and will be based on food inflation during the 12 months ending in June 2023. This will provide some relief but may be limited in protecting people from rising food hardship due to the combined impact of high food costs and the end of EAs.
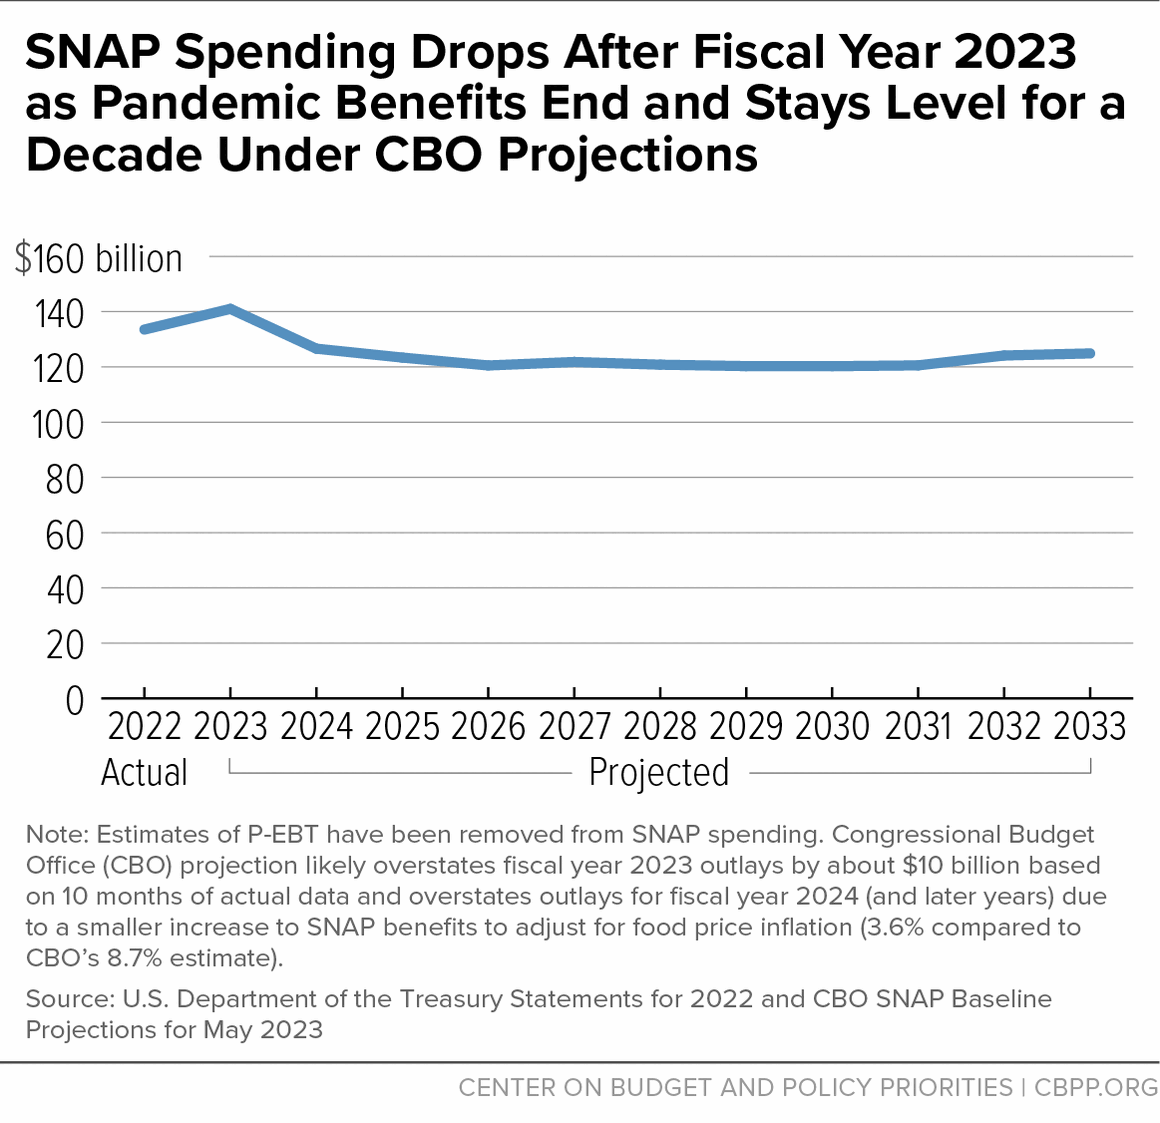
The end of the temporary SNAP benefits has brought down SNAP costs. SNAP spending is expected to fall in fiscal year 2024 according to the Congressional Budget Office’s (CBO) recent projections, due to the end of temporary pandemic spending. Nationally, SNAP average monthly benefits dropped by 28 percent, from $10.8 billion to $7.9 billion, between the quarters before and after EAs ended. CBO also projects SNAP spending will remain flat over the next decade, even in nominal terms (see second chart).
At the same time, the end of EAs won’t hit families as hard as it could have because USDA revised the Thrifty Food Plan (TFP), the basis of SNAP benefit levels, in 2021, following a directive from the bipartisan 2018 farm bill to reevaluate the TFP under the most recent dietary guidelines and data available on food prices and other factors. This revision increased SNAP benefits by about $1.40 per person per day — a modest increase to just $6.20 per person per day, but one that better aligned SNAP benefits with the cost of a healthy diet according to modern dietary recommendations. This increase is estimated to lift about 2.4 million people, including more than 1 million children, above the poverty line.
While the TFP revision was a positive change to the program, recent proposals threaten to restrict SNAP eligibility even as households cope with the loss of EAs. Proposals to cut SNAP come at the same time that new Census data show that the country experienced the largest one-year increase in history in overall poverty and child poverty in 2022, driven by the expiration of other pandemic relief.
At a time when SNAP spending is falling and families are coping with high food costs, further cuts to SNAP would drive up poverty and exacerbate food insecurity and hunger. Policymakers should use the upcoming farm bill to strengthen the program and ensure people can afford enough food to eat — not make cuts that take food assistance away from people who need help affording groceries.
| TABLE 1 | ||||
|---|---|---|---|---|
| Change in SNAP Benefits Following the Federal End of Emergency Allotments | ||||
| State | Average Monthly Benefit Per Person (Dec 2022-Feb 2023) | Average Monthly Benefit Per Person (Mar-May 2023) | Average Monthly Benefit Change Per Person | Average Monthly Benefit Percentage Change Per Person |
| Alabama | $275 | $202 | -$73 | -27% |
| Alaska* | $459 | $399 | -$61 | -13% |
| Arizona* | $178 | $176 | -$2 | -1% |
| Arkansas* | $185 | $171 | -$14 | -7% |
| California | $280 | $215 | -$65 | -23% |
| Colorado | $277 | $184 | -$93 | -33% |
| Connecticut | $286 | $187 | -$99 | -35% |
| Delaware | $268 | $154 | -$114 | -42% |
| District of Columbia | $289 | $191 | -$98 | -34% |
| Florida* | $187 | $183 | -$5 | -3% |
| Georgia* | $181 | $179 | -$2 | -1% |
| Hawai’i | $523 | $419 | -$104 | -20% |
| Idaho* | $172 | $172 | $0 | 0% |
| Illinois | $273 | $188 | -$84 | -31% |
| Indiana* | $189 | $157 | -$33 | -17% |
| Iowa* | $165 | $164 | -$2 | -1% |
| Kansas | $270 | $208 | -$62 | -23% |
| Kentucky* | $168 | $169 | $1 | 0% |
| Louisiana | $274 | $185 | -$89 | -33% |
| Maine | $283 | $168 | -$115 | -41% |
| Maryland | $281 | $162 | -$118 | -42% |
| Massachusetts | $286 | $185 | -$100 | -35% |
| Michigan | $270 | $167 | -$103 | -38% |
| Minnesota | $357 | $185 | -$172 | -48% |
| Mississippi* | $176 | $180 | $4 | 2% |
| Missouri* | $189 | $188 | -$1 | -1% |
| Montana* | $172 | $168 | -$3 | -2% |
| Nebraska* | $172 | $177 | $4 | 2% |
| Nevada | $244 | $162 | -$82 | -34% |
| New Hampshire | $278 | $166 | -$112 | -40% |
| New Jersey | $290 | $193 | -$97 | -33% |
| New Mexico | $278 | $195 | -$83 | -30% |
| New York | $277 | $214 | -$63 | -23% |
| North Carolina | $272 | $167 | -$105 | -39% |
| North Dakota* | $190 | $168 | -$23 | -12% |
| Ohio | $218 | $197 | -$20 | -9% |
| Oklahoma | $262 | $164 | -$98 | -37% |
| Oregon | $273 | $168 | -$104 | -38% |
| Pennsylvania | $252 | $175 | -$78 | -31% |
| Rhode Island | $290 | $195 | -$94 | -33% |
| South Carolina* | $245 | $180 | -$65 | -26% |
| South Dakota* | $187 | $192 | $6 | 3% |
| Tennessee* | $196 | $195 | -$1 | 0% |
| Texas | $268 | $176 | -$92 | -34% |
| Utah | $274 | $124 | -$150 | -55% |
| Vermont | $277 | $217 | -$60 | -22% |
| Virginia | $294 | $149 | -$145 | -49% |
| Washington | $276 | $168 | -$108 | -39% |
| West Virginia | $269 | $161 | -$108 | -40% |
| Wisconsin | $269 | $151 | -$117 | -44% |
| Wyoming* | $181 | $181 | -$1 | 0% |
| Guam | $240 | $284 | $44 | 18% |
| Virgin Islands | $353 | $246 | -$107 | -30% |
* State discontinued emergency allotments (EAs) prior to February 2023. SNAP participants in those states experienced benefit reductions at that time. South Carolina stopped issuing EAs after the January 2023 issuance.
Note: Several states have benefit changes that are different than anticipated due to factors in program participation, data reporting, or administrative challenges external to the EAs. Data are preliminary and subject to revision.
Source: USDA SNAP administrative data as of September 2023, available at https://www.fns.usda.gov/pd/supplemental-nutrition-assistance-program-snap


