BEYOND THE NUMBERS
Analyzing the Census Bureau’s 2024 Poverty, Income, and Health Insurance Data
On Tuesday, September 9, the Census Bureau will release data on poverty, income, and health insurance coverage for 2024. Additional health insurance data from the American Community Survey will follow September 11.
In the short term, the data may reveal some modest advances in income as well as a moderate loss of health coverage due to the scheduled expiration of temporary COVID-era health programs.
Put in longer-term context, the data will highlight the powerful impact policymakers’ decisions have on people’s lives.
We’ll be posting our analysis of the data here. Bookmark and visit this page for more.
See our paper on what to watch for in the data.
That's all the analysis on 2024 Census data that we'll be posting here. Watch our other spaces for our expert analysis on these and other issues.
Compared to CPS Data, Larger ACS Survey Data Show a Stronger Economy in 2024
Change in median household income after adjusting for inflation, 2023 to 2024 | ||
|---|---|---|
| CPS | ACS | |
| All households | +1.3% | +2.3%* |
| Black households | -3.3%* | +2.5%* |
| Hispanic households | +5.5%* | +1.8%* |
* Statistically significant at the 90 percent confidence level. Changes in red are not significant. Note: Adjusted for inflation using chained consumer price index (C-CPI-U). | ||
Data from the Census Bureau’s largest annual survey, the American Community Survey (ACS), suggest the 2024 economy might have been stronger than previously reported, with overall income growth significantly outpacing inflation.
ACS data released last Thursday show that median household income rose by 2.3 percent nationwide compared with the year before, a statistically significant increase, we calculate.
Two days earlier, Census had reported that income did not rise significantly in 2024 in data from the smaller Current Population Survey (CPS). CPS figures show incomes 1.3 percent higher in 2024 than 2023, which was not large enough to be considered statically significant in the CPS. Both comparisons use the Census Bureau’s preferred inflation adjustment for household income trends, the chained consumer price index.
For Black households, the ACS shows incomes up 2.5 percent in 2024, we calculate, while the CPS shows incomes down 3.3 percent.
It is not immediately obvious which survey’s income findings should be preferred. Two reasons to favor the ACS are survey size and response rate.
The ACS aims to survey 3.5 million households, the CPS 78,000 households. If the income growth measured in the CPS in 2024, 1.3 percent, had been observed in a survey the size of the ACS, it would have been considered statistically significant, i.e., reliable. Because the CPS is smaller, that amount of growth is considered non-significant, i.e., not statistically distinguishable from no change in income.
The ACS also has higher response rates than the CPS in 2023 and 2024, suggesting greater reliability: 83 percent of households chosen for the ACS responded in 2024, compared with about 62 percent of CPS households.
Response issues may explain why the CPS shows much higher Hispanic income growth in 2024 (5.5 percent) than the ACS (1.8 percent). A Census Bureau assessment of the CPS income data includes graphical evidence that suggests that its growth rate for Hispanic median income could have been overstated by as much as 3 percent in 2024 due to non-response patterns. The figures do not appear to show a large shift in non-response effects for Black median income in 2024, however.
On the other hand, reasons to prefer the CPS estimates include timing and more detailed questions. The latest annual CPS figures straightforwardly compare 2024 with 2023 while the ACS has a lag. (The ACS is collected year-round and asks about income in the past 12 months, so for different households the “2024” survey actually includes income from various periods throughout 2023-2024, and the “2023” survey has income from 2022-2023.) The CPS also asks more detailed income questions, which helps it to identify more family income. (CPS official poverty rates are a percentage point or more lower than ACS poverty rates as a result, as they have been consistently been in recent years.)
Previously released findings from the Bureau of Labor Statistics make income growth in 2024 plausible. Average weekly earnings rose 1.1 percent overall in 2024, using the Census Bureau’s chained inflation adjustment, and rose 1.6 percent for Black workers and 0.6 percent for Hispanic workers, while employment rates edged upward for Black and Hispanic prime-aged workers ages 25 to 54.
Regardless, both the ACS and CPS suggest the 2024 economy was in better condition than it got credit for at the time. Both surveys show inflation-adjusted median income at a record high in 2024, although it is unclear whether this would remain true after adjusting for growing measurement problems in the data. Moreover, it is important to recognize that longer-term income growth has been weak. Decades of unequally shared income growth, and the economic disruption brought by the pandemic, left many households struggling to advance, with inflation-adjusted median income growing at an average rate of less than 1 percent a year since 2007 in both surveys.
Differences between surveys that have different sample sizes, questions, and timeframes are to be expected. However, the surveys’ declining response rates are a real cause for concern, especially in the CPS, which has richer data on many fronts. Protecting the accuracy of both surveys would help policymakers and the public alike understand important trends.
This is one more reason Congress should adequately fund the Census Bureau and other federal statistical agencies so that they can focus on raising survey response rates, improving reliability, and earning greater confidence in the data.
Health Inclusive Poverty Measure Shows Anti-Poverty Impact of Medicaid
Health coverage has long been found to improve health, save lives, and help families avoid debt from medical bills. However, the Census Bureau does not usually count health coverage as a family resource, or among family’s basic needs, when measuring poverty in its two main poverty measures, the official poverty measure and the Supplemental Poverty Measure.
Last week, Census highlighted a newer alternative poverty measure showing that, when health care is included as a basic need to set poverty thresholds and health insurance is counted as a family resource, Medicaid kept millions of people above the poverty line in 2024.
"Medicare and Medicaid were the second and third most impactful anti-poverty programs after Social Security, removing 21.8 million and 15.0 million people from poverty respectively," Census wrote.
In this newer Census measure, called the Health Inclusive Poverty Measure (HIPM), health insurance is treated as a basic need like food and shelter, which results in a higher poverty threshold. The measure also counts Medicaid or other insurance as a family resource that meets that basic need. Unlike the Supplemental Poverty Measure, the HIPM will count a family as living in poverty if they lack insurance and the money to pay for it (or if a family faces high medical costs they can’t pay for out of pocket). The approach Census uses takes care to acknowledge that Medicaid is not just like cash (e.g., it can't be used to pay for rent or clothing).
The new finding, which Census plans to update annually, is one more indicator of the many ways Medicaid matters to families and communities.
New Census Data Show Persistent Gap Between Incomes and Rent, Impact of Rental Assistance
New American Community Survey (ACS) data released last week show rents and renter incomes rose at roughly the same pace in 2024. From 2023 to 2024, the median rent rose by 5.8 percent before adjusting for inflation while the median renter household’s income went up 5.3 percent, continuing a long-standing trend of rent growing faster than incomes. The result is a persistent gap between what housing costs and the amount many households can afford. This is a decades-long trend: since 2001, rent has increased by 26.7 percent after adjusting for overall inflation while renters’ incomes have risen only 7.7 percent. (See graph.)
For middle-income renters, the overall trend through 2024 is generally positive: the inflation-adjusted value of their incomes has grown modestly, even though they have had to put a growing share of their income toward housing in recent years. But sharply rising housing costs are far harder to manage for low-paid workers, seniors, people with disabilities with low incomes, and others with incomes near the bottom of the income scale. On average, these households spend much higher shares of their incomes on housing. Nearly one-quarter of renter households paid over half of their income for rent in 2023 (the last year for which those data are available), reaching a record high of 12.1 million households. A large majority of those households have incomes below half of median income. This increase in the number of renters facing severe cost burdens is the most important factor driving growth in the number of people experiencing homelessness, which reached 770,000 in 2024 — also a record high.

The most effective way to address these problems and help people with very low incomes afford housing is through housing vouchers and other rental assistance. Current Population Survey (CPS) data released last week showed that rental assistance lifted 2.1 million people above the poverty line in 2024. This included 634,000 children, 596,000 adults aged 65 and older (rental assistance has the largest poverty-reduction impact among seniors of any program except Social Security), and 904,000 other adults.
These effects could be much greater — and the poverty rate could be substantially lower — if lawmakers expanded rental assistance toward the goal of reaching all people in need. (Currently, fewer than 1 in 4 households in need receive rental assistance due to inadequate funding.)
However, recent efforts by some lawmakers would do just the opposite and threaten to make rental assistance even more scarce. For example, a proposed House funding bill for 2026 would result in 400,000 fewer people receiving assistance through housing vouchers, exposing many additional people to the risk of eviction and homelessness.
Multiple Census Measures Say Poverty Fell in 2024
Higher Poverty Rates Than 2021 Show Importance of Policy Choices
Census figures released this week show that the national poverty rate fell in 2024 according to multiple measures.
- The official poverty rate fell in 2024 both in the Current Population Survey and the American Community Survey. The official measure captures the effect of changes in earnings and other cash income sources, such as Social Security and unemployment benefits. It omits the impact of the tax system, including tax credits, and does not count non-cash benefits like food assistance and rental vouchers. It chiefly provides a picture of the effect of the private economy on families with low incomes.
- Poverty held steady in 2024 under the standard Supplemental Poverty Measure (SPM). The SPM is more comprehensive than the official poverty measure — it includes the value of non-cash benefits and tax credits — and the Census Bureau adjusts SPM poverty thresholds annually for changes in the amount typical households with children spend on basic needs. Poverty held steady under the standard SPM largely because of a faster-than-inflation rise in those thresholds, partly tied to changes in spending data that occurred before 2024, including stronger spending related to temporary COVID-related relief.
- Poverty declined in 2024 under an alternative SPM, a Census analysis shows. This alternative SPM, referred to as an “anchored” SPM, uses thresholds that are adjusted year-to-year simply for inflation, similar to the official poverty measure. Because the poverty line didn’t increase by more than inflation in 2024 under this measure, coupled with the lack of any economic or policy change that would have led to a bigger change in incomes, this measure, like the official poverty measure, showed a decline in poverty between 2023 and 2024.

To analyze long-term trends in poverty and the effectiveness of government policies in reducing poverty, it’s important to use a poverty measure that captures the effects of tax-based and non-cash assistance.
Under both the standard and anchored SPM, poverty rates were much higher in 2024 than in 2021 when the American Rescue Plan’s Child Tax Credit expansion and other pandemic relief drove down poverty substantially. The rise in the poverty rate in 2022 once that relief expired, the largest on record in over 50 years both overall and for children, underscores the critical role that policy choices play in the level of poverty and hardship in the country. (Those policy effects and changes in poverty are not captured by the official poverty measure since it does not count much of that pandemic relief as income.)
Uninsured Rate Rose in 18 States and D.C. in 2024
As we’ve discussed in previous posts, the uninsured rate rose in 2024 primarily due to unwinding of the temporary, pandemic-related Medicaid continuous coverage provision. The increase in the uninsured rate at the national level is also evident at the state level, though smaller sample sizes means that changes in many states were not statistically significant. This year’s American Community Survey data reveal that from 2023 to 2024, the uninsured rate rose in 18 states plus the District of Columbia, fell in only 2 states, and was statistically unchanged in 30 states.
States' 2024 Health Coverage Rates Reflect National Trend; Medicaid Losses Likely Mitigated by ACA Marketplace Gains
Uninsured rate, 2023-2024
Hover over states for additional detail.
Source: U.S. Census Bureau, American Community Survey
Note: ACA = Affordable Care Act
Colored states denote statistically significant changes at the 90% confidence level.
In North Carolina, one of two states that expanded Medicaid in 2023, the uninsured rate fell by 0.7 percentage points, significantly different from the national 0.3 percentage point increase. South Dakota, the other state that expanded Medicaid in 2023, experienced a 0.2 percentage point drop in its uninsured rate, though the change was not statistically significant.
North Carolina and South Dakota were the only states where average monthly Medicaid enrollment rose from 2023 to 2024, as the states’ gains from expansion far outweighed unwinding’s negative impacts on Medicaid enrollment. While national Medicaid enrollment fell by 12 percent, Medicaid enrollment in North Carolina and South Dakota rose by 14 and 7 percent, respectively.

After-Tax Income Gaps Are Large Already; Megabill Will Redistribute Upwards, CBO Projects

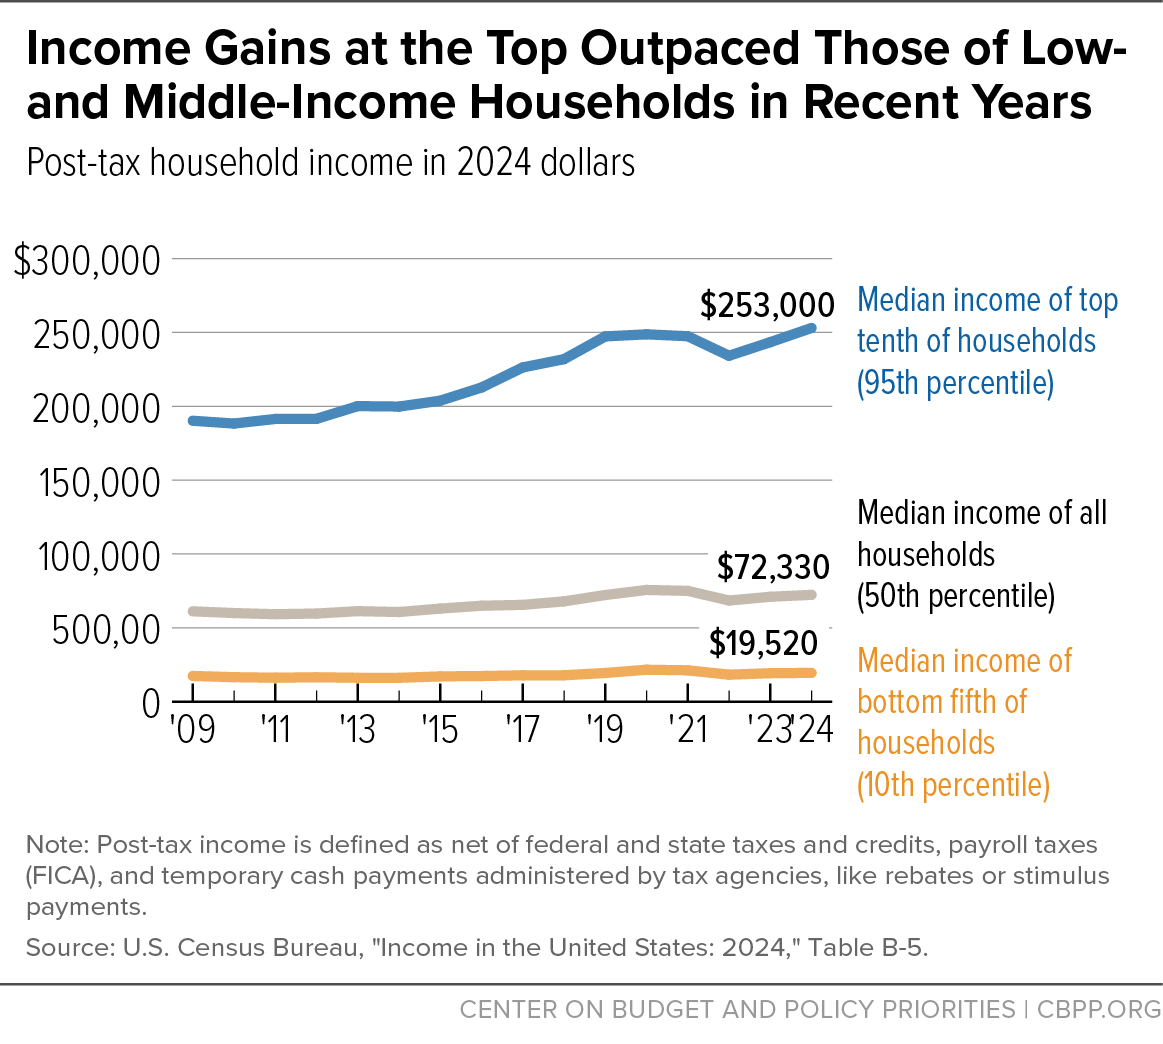
The new Census figures show top incomes are high and rising. After-tax income of households ranked in the 95th percentile rose by $9,600 (3.9 percent) in 2024 to $253,000. Meanwhile, the after-tax income of those in 10th percentile of households was statistically unchanged at $19,520 (the estimate was 1.1 percent above the 2023 estimate, which was not significantly different, i.e., not reliably distinguishable).
The 95th percentile refers to the level of income that is higher than 95 percent of households. The 95th percentile is the same as the median income of the richest one-tenth of households. The 10th percentile is the median income of the poorest one-fifth of households.
Accounting for taxes narrows income gaps somewhat. Census data show that, before federal and state income and payroll taxes, the richest one-tenth of households had 16.9 times the median income of the poorest one-fifth of households in 2024, while their after-tax income was 13.0 times higher.
Income inequality remained high or reached new highs by a variety of measures. The Census Bureau’s preferred inequality measure, the Gini index, was unchanged for pre-tax income in 2024, but stood at its third highest annual level in data going back to 1967. Another frequently used inequality measure is the ratio of incomes between the 90th and 10th percentiles. Using after-taxes income, Census reported that households with incomes in the 90th percentile made 9.85 times as much as households with incomes in the 10th percentile, the highest level in the 16 years of after-tax data available back to 2009.
Rather than pushing back against years of unequal income growth, July’s Republican megabill will further widen gaps in after-tax income and financial well-being. The impact on inequality is clearest when accounting for how the law’s cuts in food assistance and health coverage are used to pay, in part, for tax cuts that favor the wealthy.
After counting changes in taxes as well as cash and non-cash benefits such as Medicaid and SNAP, the nonpartisan Congressional Budget Office (CBO) projects that the richest one-tenth of households will see their resources rise by an average of $13,600 per year over the next decade as a direct result of the law’s provisions. That’s a 2.7 percent increase in their projected income compared with what their incomes would have been without the megabill’s extension of the 2017 tax cuts and the additional tax cuts the megabill adds on top.
Meanwhile, the law reduces the resources of the bottom one-tenth of households by about $1,200 per year, a 3.1 percent decline, CBO projects. Put another way, the megabill shifts resources from households struggling to make ends meet to wealthy households whose after-tax incomes are far higher and have been rising more quickly.
Census data are not well suited for measuring the very highest incomes, above the 95th percentile, partly because the Census survey caps top earnings at $1,099,999 per job. But other data show that, since 1979, the incomes of households in the top 1 percent have risen faster than those in the top 5 or 10 percent, and the incomes of those who are even richer, in the top one-hundredth of 1 percent, rose faster still, researchers have found.
Coverage Inequities Increased by Race and Ethnicity and by Income
The American Community Survey (ACS) data show that health coverage inequities increased in 2024 among Black and Latino people and people with low and moderate incomes. This trend was likely driven by a sharp decrease in Medicaid enrollment from 2023 to 2024, due to the unwinding of the temporary, pandemic-related continuous coverage provision.
Medicaid is a disproportionate source of coverage for people of color, and Medicaid coverage expansions have historically helped to reduce coverage disparities by race and ethnicity and income. Though the widening of coverage inequities in 2024 was likely partly offset by enhanced premium tax credits, which have led to disproportionately large health coverage gains among Black and Latino people and people with low and moderate incomes.

Between 2023 and 2024, the uninsured rate rose by 0.4 percentage points for Black people and for Latino people. That compares to an increase of 0.2 percentage points for white people and a statistically insignificant change for Asian people, two groups that have historically had lower uninsured rates. The uninsured rate also did not change significantly for American Indian and Alaska Native people and for Native Hawaiian and Pacific Islander people; the reasons for these trends are unclear but could be related to smaller sample sizes.
For those with incomes below 138 percent of the poverty threshold (calculated using the official poverty measure), the uninsured rate increased by 0.7 percentage points, from 13.3 percent to 14.0 percent. (We use the official poverty threshold here because it corresponds most closely to the income eligibility limit for Medicaid in expansion states, which is set at 138 percent of a simplified version of the official poverty measure threshold.) The uninsured rate also increased by 0.4 percentage points for those with incomes between 138 and 399 percent of the poverty threshold, from 10.1 percent to 10.5 percent.
In comparison, those with incomes above 400 percent of the poverty threshold saw a smaller increase of 0.2 percentage points, from 3.6 percent to 3.8 percent.
American Community Survey: Uninsured Rate Increased to 8.2 Percent in 2024
Today’s release of American Community Survey (ACS) data shows the uninsured rate increasing from its record low of 7.9 percent in 2023 to 8.2 percent in 2024.
The increase in the uninsured rate is consistent with preliminary data released from the National Health Interview Survey (NHIS) and Department of Health and Human Services projections, but differ from the unchanged uninsured rate in the Current Population Survey (CPS) data released on Tuesday. The difference is likely in part because the CPS counts people as uninsured only if they lack coverage the entire year while the ACS and NHIS measure coverage at the time of the survey. The ACS is by far the largest survey on health insurance and therefore provides the most precise estimates.
It's important to note that the enrollment trends underlying the overall uninsured rate are consistent across surveys. A drop in Medicaid coverage, driven by the unwinding of the pandemic-related provision that kept Medicaid covered, was partly offset by Affordable Care Act marketplace gains due to enhanced premium tax credits that made coverage affordable.
Though substantial, these changes are dwarfed by the looming coverage losses from the harmful Republican megabill enacted in July, combined with marketplace rule changes and the expiration of premium tax credit enhancements at the end of the year without congressional action. The Congressional Budget Office estimates these changes will cause about 15 million people to lose coverage by 2034. To prevent these coverage losses, lawmakers can start by extending the premium tax credit enhancements, which would prevent an estimated 4.2 million people from becoming uninsured.

Stay Tuned for Thursday’s Release of ACS Data
Stay tuned for the American Community Survey (ACS) data release on Thursday for more information about health coverage trends. The ACS has a much larger sample than the Current Population Survey (CPS) and the National Health Interview Survey (NHIS). Compared to the CPS, the ACS has also maintained a more consistent methodology over time for its health insurance measures.
We expect that the same policy-driven coverage trends in the CPS — falling Medicaid enrollment and rising Affordable Care Act marketplace coverage — will also be evident in the ACS.
As in the NHIS, we expect the uninsured rate in the ACS will be higher in 2024 than in 2023. This differs from the CPS, which showed no change in the uninsured rate, in part likely reflecting the fact that the CPS considers people to be uninsured only if they lack coverage for the entire year, while the ACS and NHIS measure whether people are uninsured at the time of the survey.
Given its large sample size, the ACS may provide a more precise answer on the magnitude of the change. The higher degree of precision in ACS estimates will also provide a better opportunity to look at differences between states and among demographic groups.
Racial and Ethnic Differences in Child Poverty Rates Have Widened After 2021's Child Tax Credit Expansion and Other Pandemic Relief Narrowed Them
Child poverty rates remained much higher across all racial and ethnic groups in 2024 than they were in 2021, when pandemic relief measures sharply lowered both poverty rates and the differences across groups. Progress made in 2021 to narrow the glaring differences in child poverty by race and ethnicity has been largely reversed.

Child poverty reached a record low in 2021 largely due to the American Rescue Plan’s Child Tax Credit expansion and other pandemic relief measures that contributed to a 46 percent reduction in child poverty from 2020 to 2021. The Child Tax Credit expansion helped bring racial and ethnic inequities in child poverty — which are driven by factors such as discrimination and governmental underinvestment — to their lowest level ever in 2021.
In 2022, though, the expiration of most pandemic assistance largely reversed recent progress both in reducing child poverty within racial and ethnic groups and narrowing percentage-point differences in poverty across those groups. The rise in the poverty rate in 2022, the largest on record in over 50 years both overall and for children, underscores the critical role that policy choices play in the level of poverty and hardship in the country.
A Missed Opportunity: Making a $2,200 Child Tax Credit Fully Refundable Would Have Lifted 1.4 Million More Children Above the Poverty Line in 2024
Our analysis of Census data released today shows that the Child Tax Credit lifted about 2.4 million children above the poverty line in 2024. (That’s counting both the refundable and non-refundable portions; the refundable portion alone lifted 1.5 million children out of poverty, as Census reported.) Had the Republican megabill’s increase in the maximum Child Tax Credit — from $2,000 to $2,200 — been put in place in 2024, that would have had a relatively small impact on child poverty, only lifting an additional 66,000 children out of poverty and leaving the poverty rate essentially unchanged (at 13.3 percent), we estimate.
That’s because the megabill does nothing for the 17 million children in families with incomes that were too low to qualify for the full Child Tax Credit previously — 1 in 4 children under age 17. By not making the $2,200 Child Tax Credit fully refundable (that is, making the full credit amount available to children in families with low and moderate incomes), Congress and President Trump missed an opportunity to substantially reduce child poverty.
Using Census data released today, we estimate that, had a fully refundable Child Tax Credit at the higher $2,200 amount been available in 2024, 1.4 million more children would have been lifted above the poverty line compared to only increasing the maximum credit to $2,200. The child poverty rate in 2024 would have been 11.3 percent with a fully refundable $2,200 credit rather than 13.3 percent with a maximum credit increase alone.

Under the megabill, a single parent with two children earning $16,000 a year as a home health aide will see no increase in their credit. The family will end up with a total Child Tax Credit less than half the size of a family with two children and income of $200,000 a year, who will see their total credit rise to $4,400 for tax year 2025.
The megabill includes a Child Tax Credit provision that pushes up on poverty: it takes eligibility for the credit away from children who are U.S. citizens or have a lawful immigration status if they do not have at least one parent with a Social Security number. This will affect roughly 2 million children by one estimate. Due to data limitations, the poverty estimates above do not reflect the impacts of this provision, though it is clear that it would increase poverty.
While providing little or no help for lower-income families and even taking the credit away from some children, the megabill gives huge tax breaks to wealthy individuals, businesses, and large corporations. The average family earning less than $50,000 will get about $250 in tax cuts in 2027, less than $1 a day, while the average tax filer earning $1 million or more a year will receive over $100,000 in tax breaks in the same year.
ACA Marketplace Policies Softened Coverage Losses From Unwinding of the Medicaid Continuous Coverage Provision
As our last post mentioned, the low uninsured rate in 2024 was driven by premium tax credit enhancements, which administrative data show led to record enrollment in the Affordable Care Act (ACA) marketplace and partially offset coverage losses that were caused by a steep drop in Medicaid enrollment.
The decline in Medicaid enrollment was caused by the unwinding of the temporary, pandemic-related provision that safeguarded Medicaid coverage for tens of millions of people. Expiration of this provision in March 2023 required states to redetermine eligibility for their entire Medicaid caseloads, a process that continued well into 2024 for most states. Average monthly Medicaid enrollment dropped from roughly 84 million in 2023 to 74 million in 2024.
Administrative data show that roughly half of the Medicaid coverage loss was offset by gains in ACA marketplace coverage, where people who are not eligible for Medicaid can enroll in coverage and depending on their income, can get financial help to lower their premium and out-of-pocket costs.
Average monthly marketplace enrollment increased from 16.2 million in 2023 to 21 million in 2024. ACA marketplace coverage has more than doubled in recent years, from 11.2 million in February 2021 to 23.4 million in February 2025, primarily because of enhancements to premium tax credits enacted in March 2021 that have helped people afford the high cost of health insurance, as well as streamlined enrollment processes.

Programs That Lifted Millions Out of Poverty in 2024 Have Been Cut or Proposed for Cuts

Programs targeted for deep cuts in the enacted Republican megabill and the Trump Administration’s budget plans are effective at reducing poverty, today’s Census data show.
- The Child Tax Credit lifted 4.1 million people above the poverty line in 2024. The megabill has taken away Child Tax Credit eligibility for children who are U.S. citizens or have lawful immigration status, but who don’t have at least one parent with a Social Security number. This change, which takes effect starting with the 2025 tax year, could affect roughly 2 million children by one estimate.
- SNAP, the nation’s most important food assistance program, lifted 3.6 million people above the poverty line in 2024. However, SNAP will be cut by $187 billion through 2034 (about 20 percent) under the megabill, the largest cut in the program’s history. This will terminate or substantially cut food assistance for about 4 million people. The cuts could be far larger if more states deeply cut or terminate SNAP in response to the reduction in federal funding and shift of program costs to states.
- Supplemental Security Income (SSI) lifted 2.5 million people above the poverty line in 2024. The Trump Administration is preparing to propose a rule to reduce or end SSI benefits for nearly 400,000 low-income older people and disabled adults and children.
- Housing vouchers and other rental assistance lifted 2.1 million people above the poverty line in 2024. A House committee recently passed a bill that could result in about 411,000 fewer people receiving assistance through housing vouchers to help them live in safe, stable housing.
- Medicaid, the Children’s Health Insurance Program (CHIP), and Affordable Care Act (ACA) marketplace coverage all reduce families’ out-of-pocket health care costs which, in turn, tend to reduce poverty as measured by the Supplemental Poverty Measure. The Republican megabill will take away coverage from millions of people and raise the cost of coverage for millions more, straining household budgets.
Current Population Survey: Uninsured Rate in 2024 Remained at 8.0 Percent, Reflecting Offsetting, Policy-Driven Coverage Trends
The uninsured rate held steady at 8.0 percent in 2024, statistically unchanged from its record lows of 8.0 percent in 2023 and 7.9 percent in 2022, according to Current Population Survey (CPS) data released today by the Census Bureau.

The steady uninsured rate in the CPS in 2024 differs from the Department of Health and Human Services projection of a 0.4 percentage point increase in the uninsured rate. It also differs from preliminary data from the National Health Interview Survey (NHIS), which found a 0.6 percentage point increase in the uninsured rate in 2024.
But beneath the overall uninsured rate, the trends in coverage types in the CPS are consistent with other estimates: Medicaid coverage dropped substantially, while direct purchase coverage, including Affordable Care Act (ACA) marketplace coverage, rose significantly.
The steep drop in Medicaid coverage was driven by the unwinding of the temporary, pandemic-related provision that allowed Medicaid enrollees to maintain continuous coverage. Administrative data show that expiration of this provision caused a precipitous drop in Medicaid enrollment, while ACA marketplace coverage gains offset some of that drop. Those gains were only possible because enhanced premium tax credits made marketplace coverage far more affordable for low- and moderate-income people losing Medicaid. We’ll discuss more details about these changes in our next post.
It’s possible that the uninsured rate did not increase in the CPS because, unlike in other surveys, the CPS only considers people to be uninsured if they had no coverage during the entire year. That means that the impacts of Medicaid unwinding would only show up for those who lost coverage in 2023, as people who lost coverage in 2024 would not be considered uninsured in the CPS. As a result, although Medicaid coverage in the CPS dropped significantly, it didn’t fall as steeply as it did in administrative data and the NHIS.
In a troubling finding, the uninsured rate for Black people rose significantly, potentially reflecting the fact that Medicaid is a disproportionately important source of coverage for Black people.
The looming expiration of the enhanced premium tax credits, which will occur at the end of this year without congressional action, will cause 4.2 million people to become uninsured, according to estimates from the Congressional Budget Office (CBO). Combined with $1.1 trillion in cuts to Medicaid and ACA marketplace coverage in the harmful Republican megabill passed in July and changes in a recent marketplace rule, CBO projects that about 15 million people will lose their health care and become uninsured by 2034 — a massive and unprecedented loss of coverage that would reverse most of the gains since the ACA’s enactment.




Federal policymakers should reverse these actions, which research indicates will lead to over 100,000 preventable deaths over the next decade. A first step is to extend the enhanced premium tax credits so that ACA marketplace coverage remains affordable in 2026 and beyond. Extending these credits would prevent sudden spikes in out-of-pocket premiums of about 80 percent on average for over 20 million marketplace enrollees, with 4.2 million enrollees losing their coverage and becoming uninsured.
Republican Megabill Will Erode Much of the Progress on Health Coverage and Push Poverty and Inequality Higher
2024 Census numbers show economy was reasonably strong, though wide inequities persist
Today’s Census report shows that the economy was reasonably strong in 2024, but wide inequities across income, racial, and ethnic groups persisted. Median income kept pace with inflation and stood at a record high under one measure; health coverage was unchanged overall; and the official poverty rate declined. (One Supplemental Poverty Measure fell and another was unchanged.)
Viewed over the longer term, the data highlight the powerful impact policymakers’ decisions have on people’s lives. Policy advances over the last 25 years have helped millions of people secure health coverage and lifted millions of people above the poverty line. However, if left unchanged, July’s Republican megabill will erode much of the progress on health coverage and push poverty and inequality higher.
The Congressional Budget Office projects that July’s Republican megabill will increase the number of people without health coverage by 15 million in the coming decade due to the law’s health care cuts and failure to extend enhanced premium tax credits that make Affordable Care Act marketplace coverage affordable for millions of people. If policymakers act to extend the enhanced premium tax credits, the estimate would be reduced to roughly 11 million, still an enormous loss of health coverage.
At the same time, the megabill’s cuts to SNAP will increase poverty. SNAP’s food assistance kept 3.6 million people above the poverty line in 2024, today’s figures show, and lessened the severity of poverty for millions more. But despite these achievements, the megabill cuts the program by 20 percent, the largest cut in the history of the program, which will bring more and deeper poverty. The Administration’s proposed cuts to rental assistance and food assistance through WIC are two more examples of policies that would exacerbate, rather than ease, challenges for families in affording the high cost of food and housing.
Today’s data also paint a troubling portrait of the economy not working well for Black households in 2024. While official poverty declined overall, the Black official poverty rate remained flat (with the Supplemental Poverty Measure rising), Black household income declined, and the share of Black individuals without health insurance rose, adding to long-standing inequities that are often a result of discrimination and systemic racism that create barriers to education, job, and housing opportunities. Trends among Black workers, who are often last hired and first fired, can also be an early warning of a more broadly weakening economy, though further data will be needed to know if that is the case today.
Inequality by race and ethnicity remains a persistent problem, with poverty and the uninsured rate much higher and incomes much lower for Black, Latino, and Indigenous households as compared to white households.
The difference between the incomes of households with incomes in the bottom and middle of the distribution and those with incomes at the top also remains very high, with one measure of after-tax income inequality at a record high in 2024, Census reported.
In 2024, poverty and the number of people without health coverage remained too high, but because of policy changes over decades, the data show real progress over the longer term. The President and congressional majority turned their backs on this progress this year. Their megabill takes away health coverage and food assistance that people need to go to the doctor, access life-saving medical care, and afford food — all partially to pay for tax cuts for the already wealthy, who have seen large income growth in recent decades. This legislation marks the first time that policymakers have enacted legislation that makes poverty, health coverage, and inequality worse while increasing deficits.
Authors