

Off the Charts
POLICY INSIGHT
BEYOND THE NUMBERS
BEYOND THE NUMBERS
A State-by-State Look at Income Inequality
Our state-by-state fact sheets that accompany our report on income inequality show that the concentration of incomes among the wealthiest residents is striking in every state. And that doesn’t even take capital gains income — which is heavily concentrated among the richest households — into account.
The average income of the top 5 percent of households is now at least ten times that of the bottom 20 percent in every state, 2015 American Community Survey data show. The ten states with the largest disparities are New York, California, Connecticut, Louisiana, Massachusetts, Illinois, New Jersey, Florida, Georgia, and Texas.
Image
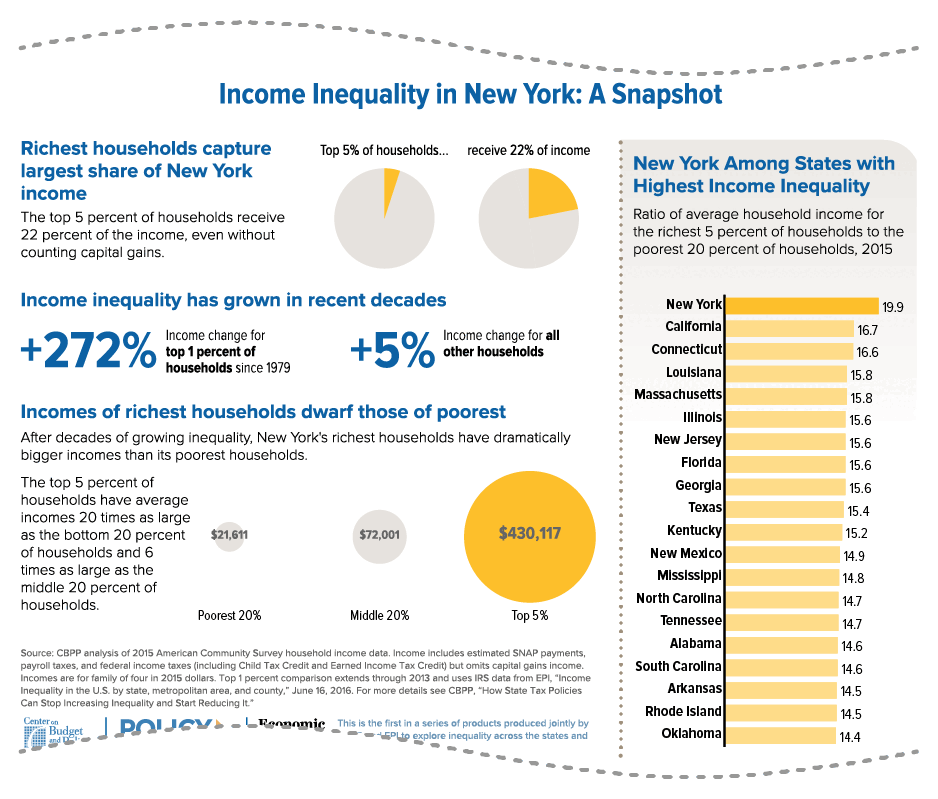
For each state, our fact sheets illustrate:
- The share of income captured by the top 5 percent of households;
- How income inequality has grown in recent decades; and
- How incomes of those at the top compare to the bottom and middle 20 percent of households.
Click a state in the map below to get its fact sheet.