

Eligible Low-Income Children Missing Out on Crucial WIC Benefits During Pandemic
Recent Participation Varies Widely by State; Lags Medicaid, SNAP
The share of eligible families that participate in the Special Supplemental Nutrition Program for Women, Infants, and Children (WIC) has declined over the past decade, and the reach of this critical program appears to have declined further during the pandemic. WIC provides nutritious foods, nutrition education, breastfeeding support, and referrals to health care and social services to low-income pregnant and postpartum people, infants, and children under age 5. A large body of research demonstrates that WIC improves participants’ health, developmental, and nutrition outcomes.[1]
Since the start of the COVID-19 health and economic crisis, the number of individuals eligible for WIC has likely grown substantially. And, with an increase in need, one would expect WIC participation to have grown substantially as well. Yet WIC participation — that is, the number of individuals enrolled in WIC and receiving benefits — increased by only 2 percent between February 2020 and February 2021, a year into the pandemic.[2]
Participation changes over this period varied widely across states, ranging from a 20 percent increase to a 21 percent decrease. States with substantial increases may be reaching a greater share of eligible individuals than before the pandemic, which could illuminate policies and practices that appeal to potential participants. On the other hand, in 31 states WIC grew by less than the nationwide average of 2 percent or declined.[3] In these states, the decline in the share of eligible individuals benefitting from WIC likely accelerated, with substantial numbers of eligible low-income families missing out on WIC’s proven benefits.
Comparing WIC participation data to Medicaid and Supplemental Nutrition Assistance Program (SNAP) participation can shed further light on the extent to which WIC is reaching eligible individuals because Medicaid and SNAP participants are automatically income-eligible for WIC.[4] Though gaps in the publicly available data preclude an ideal comparison, we can glean some important lessons, and state officials — who have access to more nuanced participation data — can measure the extent to which WIC is not reaching eligible families and conduct targeted outreach to families participating in Medicaid or SNAP but not WIC.
Even before the pandemic, a substantial share of Medicaid and SNAP participants who were income-eligible for WIC were not enrolled. Pilot projects conducted in four states during 2018 and 2019 found that between 44 percent and 63 percent of WIC-eligible people enrolled in Medicaid or SNAP were not enrolled in WIC. Recent trends suggest the gap may be even larger today.
Two factors have driven a steady increase in Medicaid enrollment since the start of the pandemic. First, as a result of the economic crisis, unemployment soared; as income dropped and families lost employer-provided health insurance, more families with children qualified for Medicaid. Second, the “continuous coverage” provision established by the Families First Coronavirus Response Act prevents states from terminating Medicaid coverage except under very narrow circumstances, so that low-income individuals can continue receiving health care benefits during the public health emergency.[5] This policy removes procedural barriers that typically cause many eligible families to cycle on and off Medicaid, so more of the families eligible for Medicaid are likely enrolled now. In addition, some individuals are continuing to receive Medicaid who otherwise would have become ineligible or lost benefits, as this policy permits.
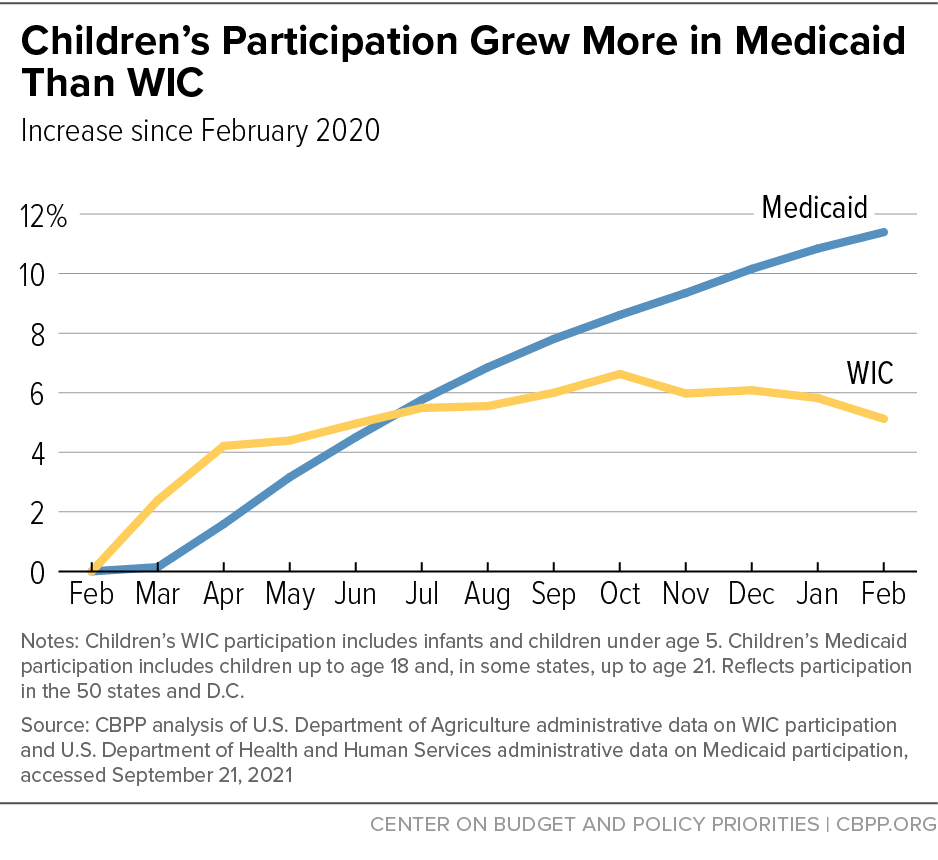
In the 50 states and D.C., Medicaid enrollment increased by 16 percent between February 2020 and February 2021, while WIC participation grew by just 3 percent. Because Medicaid — unlike WIC — serves families with older children as well as seniors and individuals without children at home, it is helpful to focus on enrollment by children where data are available. Here, too, Medicaid growth outpaced WIC. In the 50 states and D.C., Medicaid enrollment of children increased by 11 percent from February 2020 to February 2021, while nationwide WIC participation by infants and young children increased by 5 percent from February 2020 to February 2021.[6] Continuous coverage likely enables Medicaid to serve a higher share of eligible children than it otherwise would, so current Medicaid enrollment (as opposed to enrollment before the policy took effect) may provide a more accurate picture of the number of children whom WIC could serve.
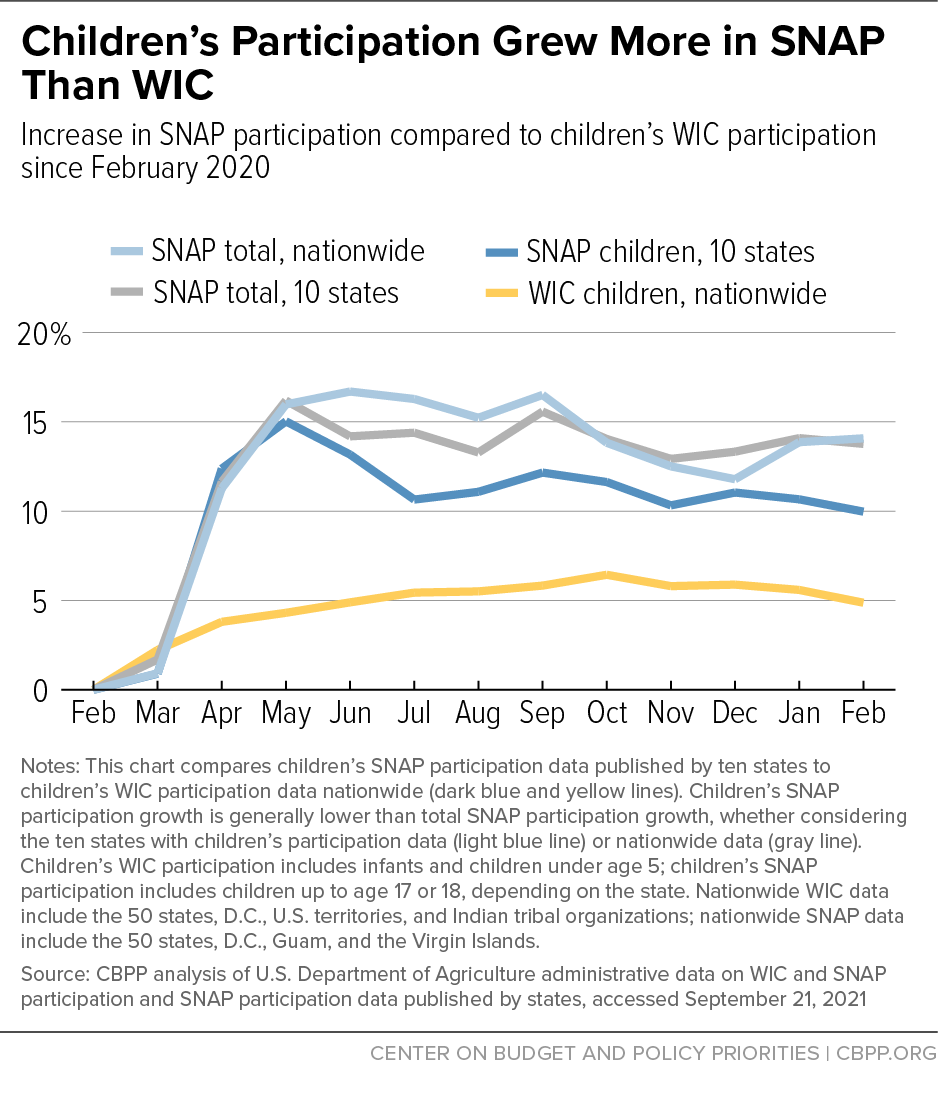
Likewise, nationwide SNAP participation increased by 14 percent between February 2020 and February 2021, compared to just 2 percent for WIC.[7] Nationwide data are not available on the number of children participating in SNAP, but in the ten states that publish SNAP participation data for children, it increased by 10 percent from February 2020 to February 2021, while nationwide WIC participation by infants and young children increased by 5 percent.[8] Because Medicaid and SNAP participants are automatically income-eligible for WIC, WIC’s slower growth provides additional evidence that the share of eligible families participating in WIC has likely declined further during the pandemic.
While food hardship has started to decline in 2021 as more relief has reached low-income families, the number of children in households where children aren’t getting enough to eat appears to be many times higher than pre-pandemic levels, according to our analysis of a separate Census Bureau survey conducted in December 2019.[9] (Methodological differences between the two surveys explain some, but not all, of the increase.[10]) Clearly, many eligible families are not receiving the assistance they need, and many young children who could be benefitting from the health and developmental improvements associated with WIC participation are being left behind.
By working together, state WIC, Medicaid, and SNAP leaders can use data to assess the extent to which WIC is reaching eligible families and take steps to enroll more of them so that low-income young children do not miss out on critical assistance at a time when food hardship is disturbingly high.
WIC Coverage Was Declining Prior to Pandemic
Since 2005, the Department of Agriculture (USDA) has issued detailed annual estimates of the number of individuals eligible for WIC by state, population category, and race and has compared the actual number of participants to the estimated number of eligible people to estimate a “coverage rate” — the share of eligible individuals the program is reaching.
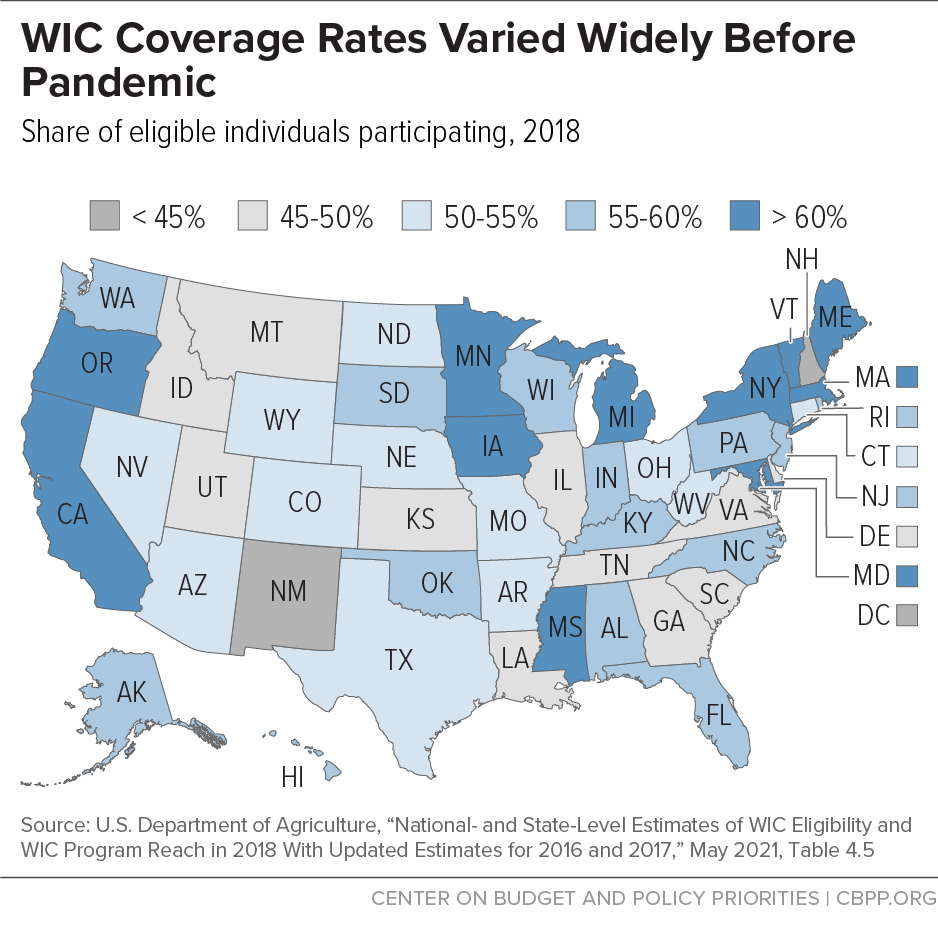
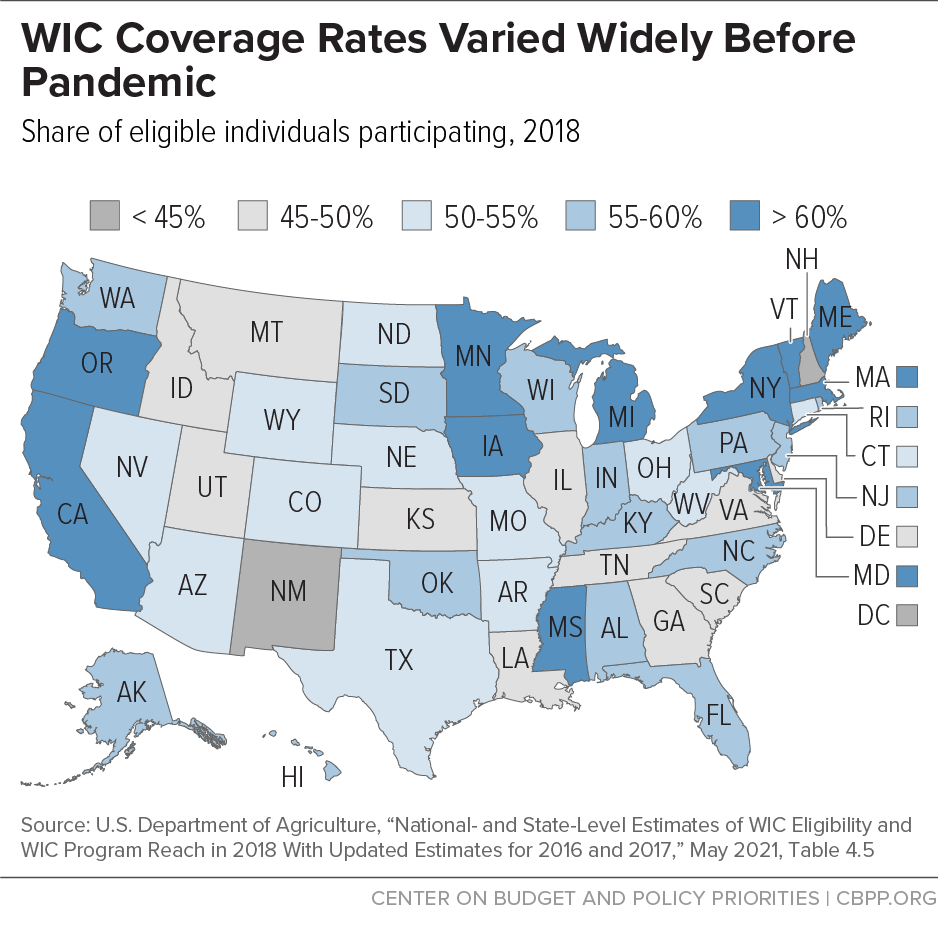
The WIC coverage rate was already declining prior to the COVID-19 pandemic, falling between 2011 and 2015.[11] Revised coverage rate estimates that USDA recently released for 2016 and 2017 and new estimates it released for 2018 suggest that the decline might have levelled off, but a change in the underlying Census data renders them not comparable to earlier years.[12] Regardless of the trend, the coverage rate for 2018 confirms that many eligible low-income families are missing out on WIC’s proven benefits: nationwide, WIC reached only 57 percent of eligible individuals. While nearly all eligible infants participated in WIC, only 53 percent of eligible pregnant individuals participated, as did only 44 percent of eligible children ages 1 through 4. Coverage rates in 2018 also varied widely across states, ranging from 44 percent to 75 percent. (See Figure 1.)
WIC Participation Changes in Pandemic Varied Widely by State
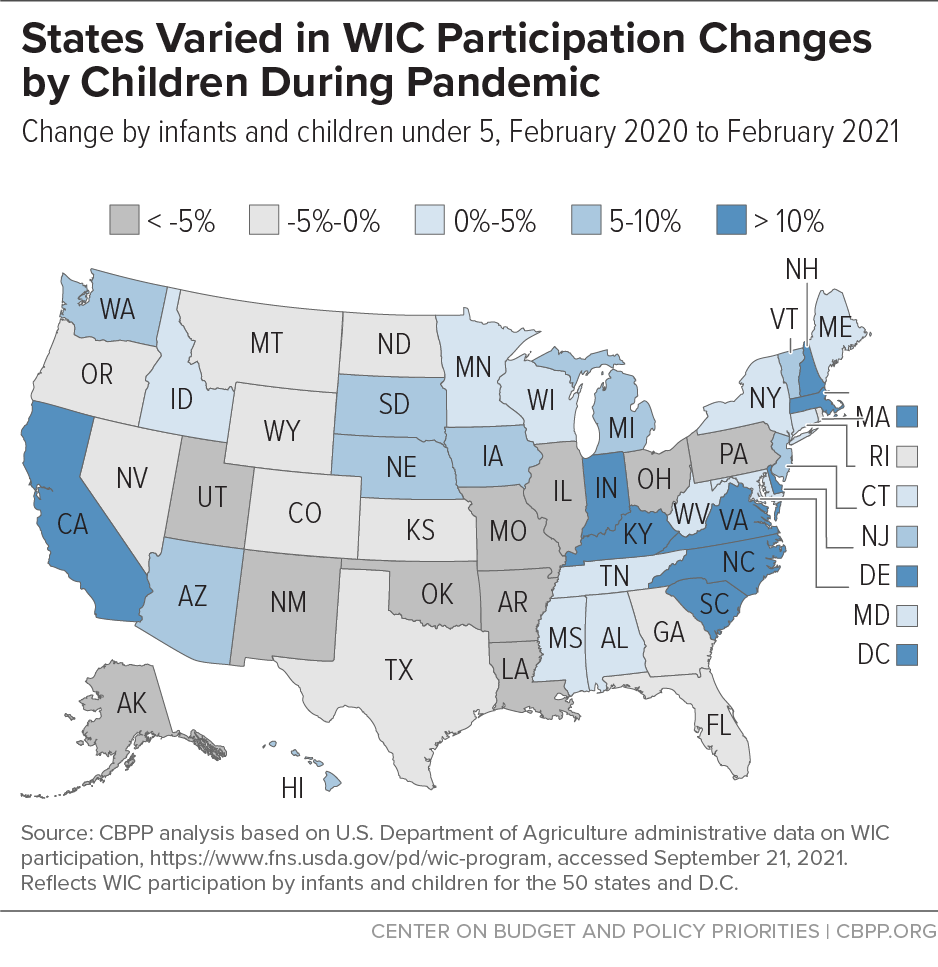
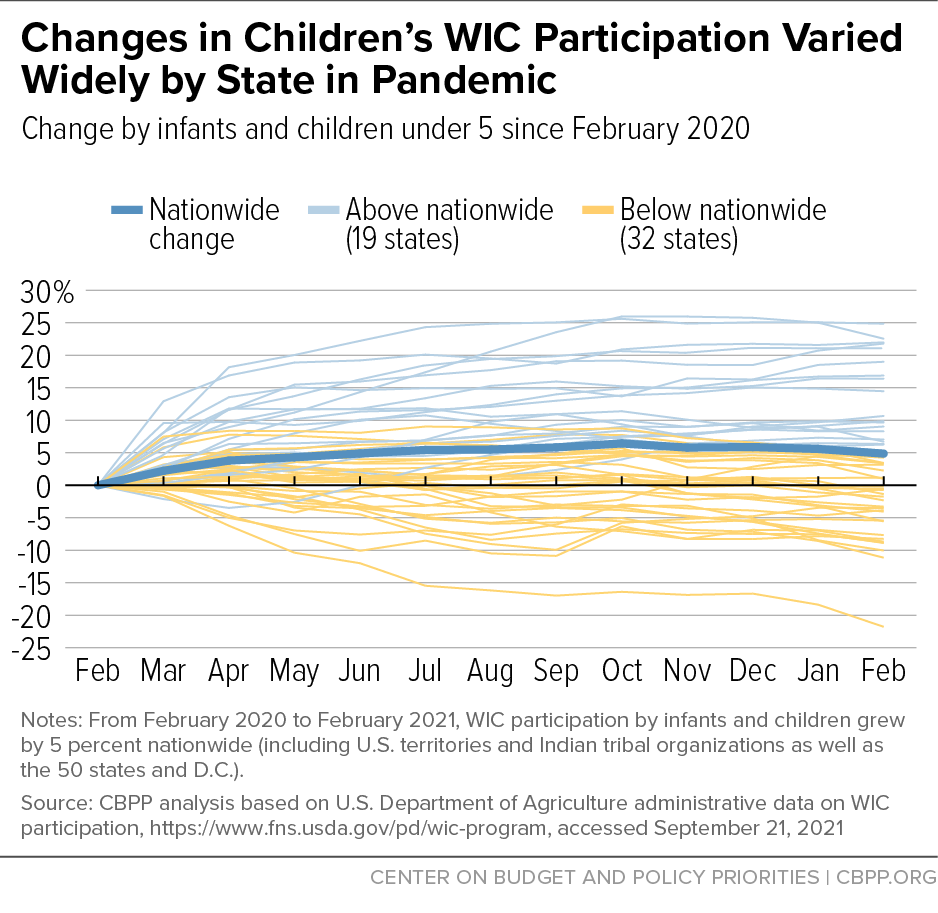
Nationwide, WIC participation increased by 2 percent between February 2020 and February 2021. But the changes varied widely by state, ranging from a 20 percent increase to a 21 percent decrease. Nineteen states plus the District of Columbia grew by more than 2 percent; the rest had smaller growth or declined.
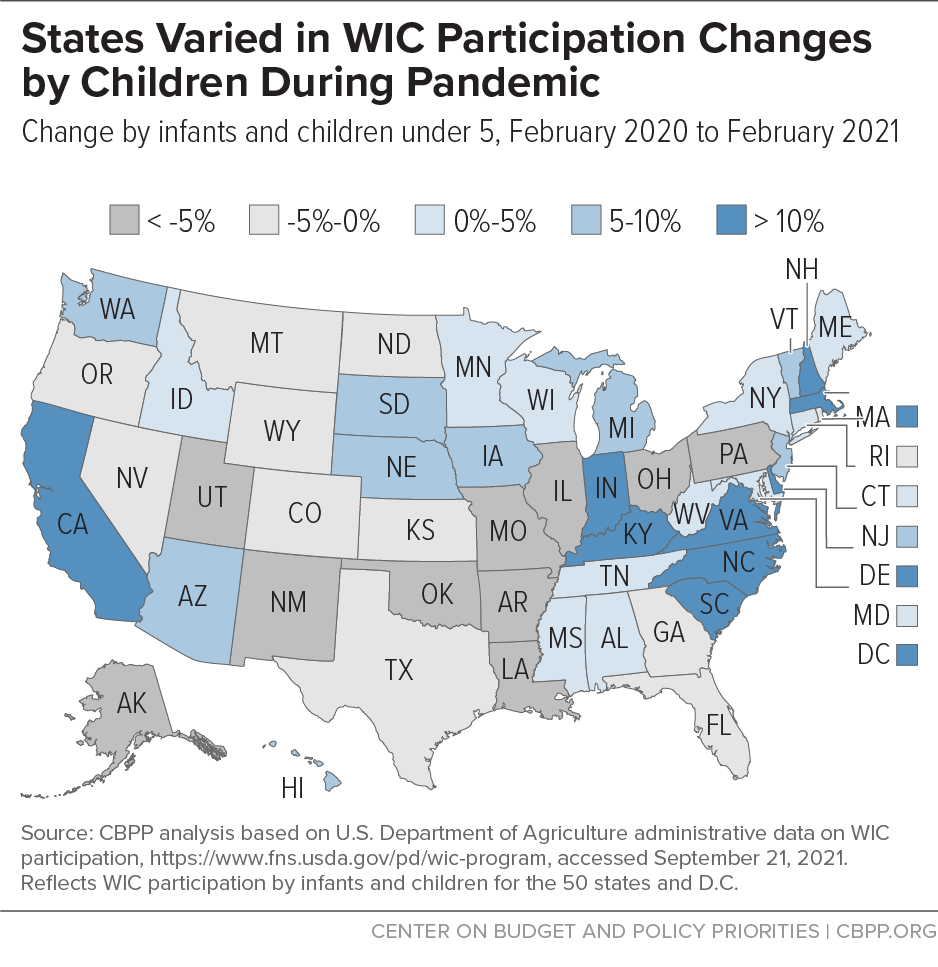
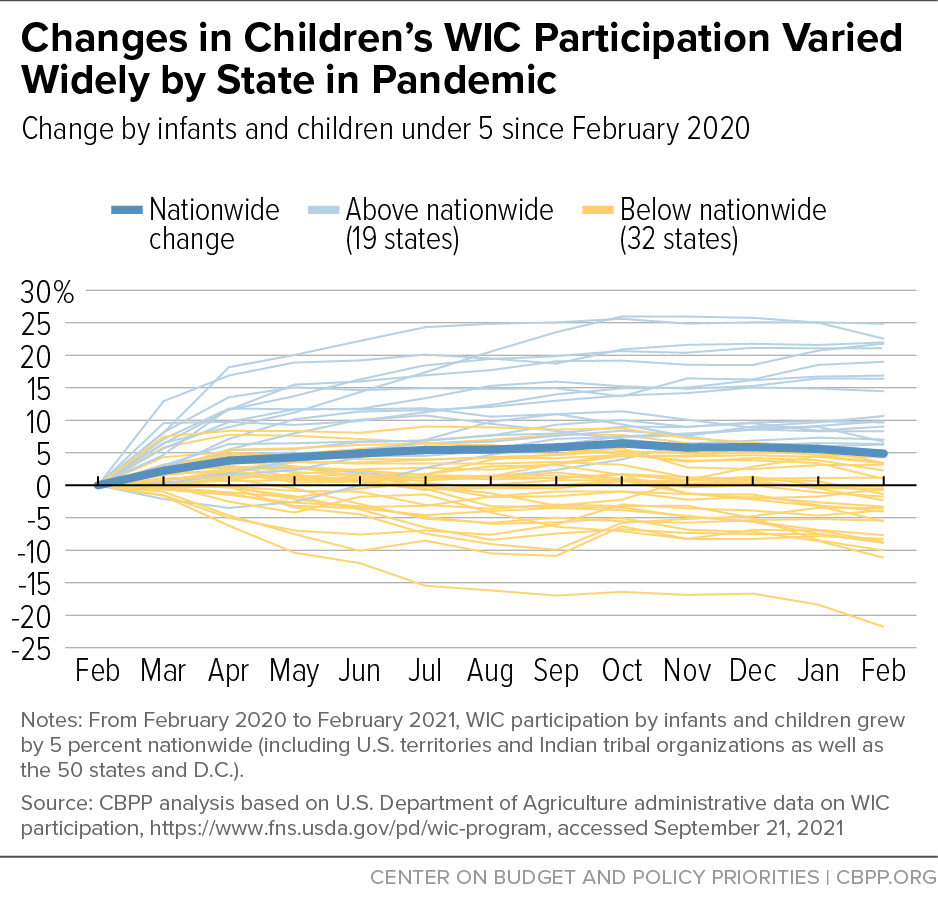
Similarly, changes in WIC participation among children ranged from a 25 percent gain to a 22 percent decline. (See Figure 2.) Eighteen states plus D.C. grew by more than the nationwide figure of 5 percent; the rest had small growth or declined. (See Figure 3.)
WIC participation by pregnant and postpartum people declined by nearly 5 percent nationwide over the same period, with states ranging from a 20 percent decline to a 7 percent increase. A nationwide decline during a period when food hardship was so high and pregnant people faced additional health risks related to COVID-19 is concerning. However, while the COVID-19 crisis likely made more adults income-eligible for WIC, it also led to a decrease in the number of people getting pregnant, which could have reduced the number of adults eligible for WIC. Births have been decreasing since 2007 (by just over 1 percent annually between 2007 and 2019, on average), and provisional data from the U.S. Department of Health and Human Services show a further 4 percent decline between 2019 and 2020.[13] Researchers also predict a decline in births in 2021 due to fewer pregnancies during the pandemic.[14]
There were in fact fewer births in November and December 2020 than earlier in the year, which indicates a decline in pregnancies as the pandemic set in in February and March 2020, but without data for 2021 we do not yet know if this decline was sustained.[15] Moreover, the 2020 data and 2021 projection don’t distinguish by income, so the recent trend might differ for low-income women. Because we do not yet know whether the number of WIC-eligible pregnant and postpartum women increased or decreased during the pandemic, this analysis focuses on participation by children under 5.
At this point we do not know why WIC participation changes varied so much across states, but one factor that has been shown to be associated with declines is that some states can’t remotely load WIC benefits onto electronic benefit cards, so participants must travel to the WIC clinic or drop off their card to receive their benefits — which some people may have been reluctant to do during the health crisis.[16] Every state that couldn’t remotely load benefits experienced a decline in total WIC participation and participation by infants and children between February 2020 and February 2021.
Several other factors may be contributing to smaller participation increases or actual declines. Though 2020 was the deadline for states to implement electronic benefits, some states were still implementing them or were still issuing paper vouchers, posing a burden and health risk for participants to obtain them. In addition, outreach during the pandemic may have been difficult, and some participants and potential applicants may not have been aware that services were being offered remotely while WIC clinics were closed. Moreover, some staff may have been redeployed to COVID-19 work, leaving state and local WIC agencies with fewer staff. Lastly, some WIC-eligible families received other assistance, such as increases to SNAP benefits or economic impact payments, that might have reduced their need for WIC benefits.[17] The fact that WIC participation increased substantially in some states, however, suggests that factors like this, which applied to all states, were not necessarily the driving force behind differences in WIC participation.
Declines in WIC participation, or even small increases, even as food hardship grew substantially indicate that WIC is not keeping up with need. In addition, the high levels of food hardship during the pandemic raise serious concerns about the long-term consequences for children’s health and development — particularly for children of color, given the extreme inequity in food hardship rates. Not getting enough to eat, or eating less nutritious food, can have lasting effects on children’s health, leading to problems that can lower children’s test scores, their likelihood of graduating from high school, and their earnings in adulthood.[18] Even short periods of food insecurity pose long-term risks for children.
Faster Growth in Medicaid, SNAP Show WIC Missing Many Eligible Families
To assess how effectively WIC is reaching eligible families during the pandemic, it is also instructive to compare participation changes in WIC to those in Medicaid, which provides access to comprehensive health care, and in SNAP, which offers grocery benefits to help individuals and families afford food. Medicaid and SNAP participants are “adjunctively eligible” for WIC, which means they are considered income-eligible and do not need to separately document their income to enroll in WIC.[19] Thus, examining the number of pregnant and postpartum people and children under 5 who participate in Medicaid and SNAP gives one indication of the universe of individuals WIC could be reaching.[20]
Historically, WIC participation has overlapped heavily with Medicaid and SNAP. In 2018, about 77 percent of WIC applicants also participated in Medicaid and about 33 percent also participated in SNAP.[21] While there are no comparable national figures on the share of WIC-eligible Medicaid and SNAP participants who also participated in WIC, every pregnant or postpartum individual and child under 5 participating in Medicaid or SNAP would have been eligible for WIC through adjunctive eligibility.
Yet even before the pandemic, a substantial share of Medicaid and SNAP participants who were income-eligible for WIC were not enrolled. Pilot projects conducted in four states during 2018 and 2019 offer a window into the extent to which Medicaid and SNAP participants were missing out on WIC. Based on data matching, these states found that between 44 percent and 63 percent of WIC-eligible people enrolled in Medicaid or SNAP were not enrolled in WIC.[22]
WIC Has Grown Less Than Medicaid in Pandemic
Medicaid enrollment has grown steadily over the course of the pandemic, driven by two main factors. First, the economic crisis resulted in high rates of unemployment. As families lost income, more became eligible for Medicaid and people who had already been eligible for Medicaid but were covered by employer-provided health insurance turned to Medicaid when they lost that coverage.
Second, the Families First Coronavirus Response Act established a “continuous coverage” provision that prohibits states from terminating a participant’s Medicaid coverage during the public health emergency unless the person requests termination, moves out of the state, or dies. This provision will remain in effect until the end of the federal public health emergency, which is expected to last at least through 2021.
Continuous coverage has eliminated gaps in Medicaid coverage that often occur when people’s incomes rise modestly over program limits for short periods of time or they fail to return needed paperwork. For example, enrollees often lose coverage despite remaining eligible because they don’t receive a notice or can’t produce paperwork to document their income. Continuous coverage has likely led more eligible families to participate in Medicaid, so while it allows families to continue participating even if their income increases above the eligibility limit, current Medicaid enrollment may represent the universe of families that are also eligible for WIC more accurately than enrollment prior to continuous coverage.[23]
Total Medicaid enrollment increased by 16 percent in the 50 states and D.C. between February 2020 and February 2021, while WIC participation increased by only 3 percent.[24] Because Medicaid covers seniors and people with disabilities, comparing Medicaid enrollment by children of all ages to WIC participation by children under 5 may be more relevant.[25] Among the 50 states and D.C., Medicaid child enrollment increased by roughly 11 percent over this period while WIC child participation increased by roughly 5 percent. (See Figure 4.) Medicaid’s enrollment increase reflects continuous coverage, but all Medicaid participants are income-eligible for WIC, so WIC’s lower growth suggests that the number of young children participating in Medicaid who are eligible for WIC but missing out has risen since the pandemic started.[26]
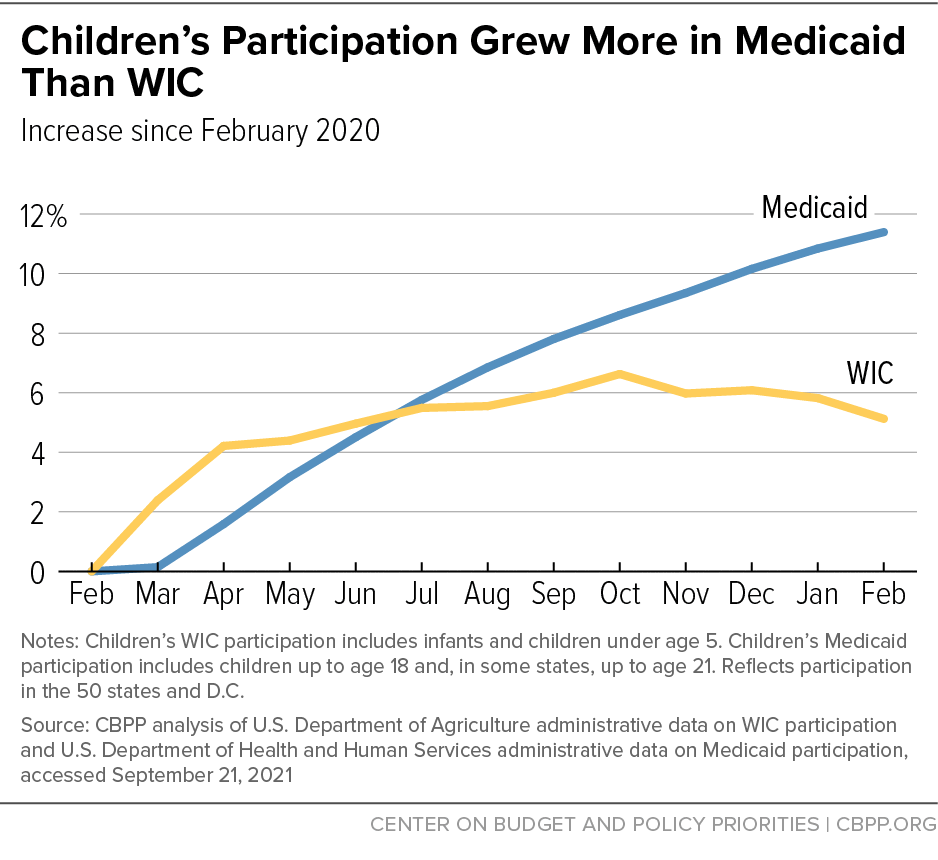
In fact, if all new Medicaid participants under age 5 had also enrolled in WIC, WIC participation would have grown by a larger percentage than Medicaid because WIC serves fewer children under age 5 than Medicaid does. Consider Maryland as an example. Between February 2020 and February 2021, the number of children under 5 enrolled in Medicaid rose by 5,947 (3 percent) while the number of infants and children under 5 participating in WIC rose by just 2,048 (2 percent). If WIC had added 5,947 children, its participation would have grown by 7 percent, exceeding Medicaid’s 3 percent growth.
Although we don’t know whether Medicaid enrollment grew at the same rate for children under 5 as for children of all ages, the fact that WIC participation by children under 5 grew more slowly than Medicaid enrollment of children suggests that substantial numbers of WIC-eligible children are not receiving benefits.
In addition, the fact that WIC participation by children in some states has increased by as much as 25 percent shows that other states can improve in this area. In the 18 states and D.C. where WIC participation growth exceeded the nationwide rate, WIC participation growth exceeded Medicaid enrollment growth; WIC child participation grew by 16 percent from February 2020 to February 2021, far surpassing the 9 percent increase in Medicaid child enrollment. (See Figure 6.) This suggests that some states’ WIC coverage rates may have improved during the pandemic.
During this time of increased need and reduced barriers to participation in Medicaid, states have an important opportunity to try to enroll these children in WIC so they can benefit from its impact on health and development. Conducting data matching to identify WIC-eligible children who are not enrolled and targeting outreach to their families has been shown to increase WIC certification.[27] Given the recent rise in children receiving Medicaid, now is an opportune time to conduct that data matching.
While pregnant and postpartum adults participating in Medicaid are eligible for WIC up to six months postpartum (12 months if breastfeeding), our analysis focuses on participation by children because it is difficult to accurately assess which adults in the Medicaid pregnancy-related enrollment category are eligible for WIC. Prior to the pandemic, pregnant individuals typically remained eligible for Medicaid for 60 days after childbirth.[28] Because of the continuous coverage provision, individuals enrolled in the pregnancy-related enrollment category may remain in that category well past 60 days postpartum. They may also be transferred to another category if its benefits equal or exceed those in the pregnancy-related enrollment category, but the extent to which states are doing this is unclear.[29] Consequently, some individuals may still be in the pregnancy-related enrollment category well after the point at which their WIC eligibility ends. The complexity of determining which Medicaid adult participants are eligible for WIC highlights the importance of delving into state data to determine who is missing out on WIC and how to enroll them.
WIC Has Grown Less Than SNAP in Pandemic
While there are gaps in the available SNAP data, the data that are available suggest that SNAP participation has grown more rapidly than WIC during the pandemic, providing further evidence that WIC coverage has likely declined. Total SNAP participation increased by 14 percent between February 2020 and February 2021 nationwide, while WIC participation increased by only 2 percent.[30]
As with Medicaid, using SNAP and WIC child participation data may allow for a sounder comparison. While USDA does not publish recent child participation data for SNAP, ten states do, and a comparison using these data can indicate the extent to which more SNAP participants could be enrolled in WIC. In these ten states, SNAP participation by children of all ages increased by 10 percent over this period; nationwide, WIC participation by children under 5 increased by 5 percent.[31] If these ten states are representative, child participation nationally grew by roughly half as much in WIC as in SNAP. (See Figure 5.)
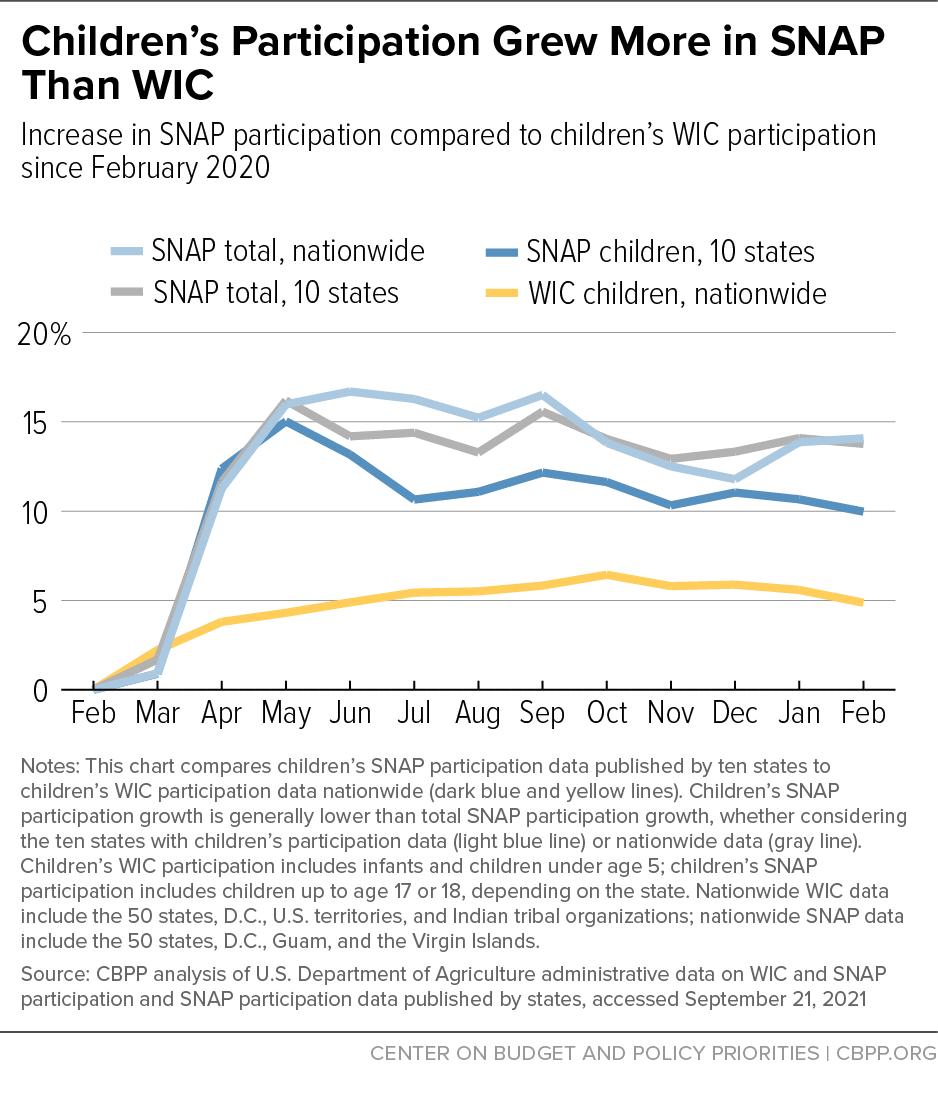
Three facts suggest that those ten states (which accounted for 26 percent of total SNAP participation over this period, on average) are indeed representative. First, as Figure 5 illustrates, the recent trend in the ten states for total SNAP participation (not just among children) is very similar to the national trend. Second, the increase in SNAP child participation among these ten states during the Great Recession (22 percent) was very similar to the increase nationally (23 percent).[32] Third, during the Great Recession SNAP participation grew slightly less among children than among the overall population in the vast majority of states, and it appears the same has been true in these ten states during the pandemic.[33]
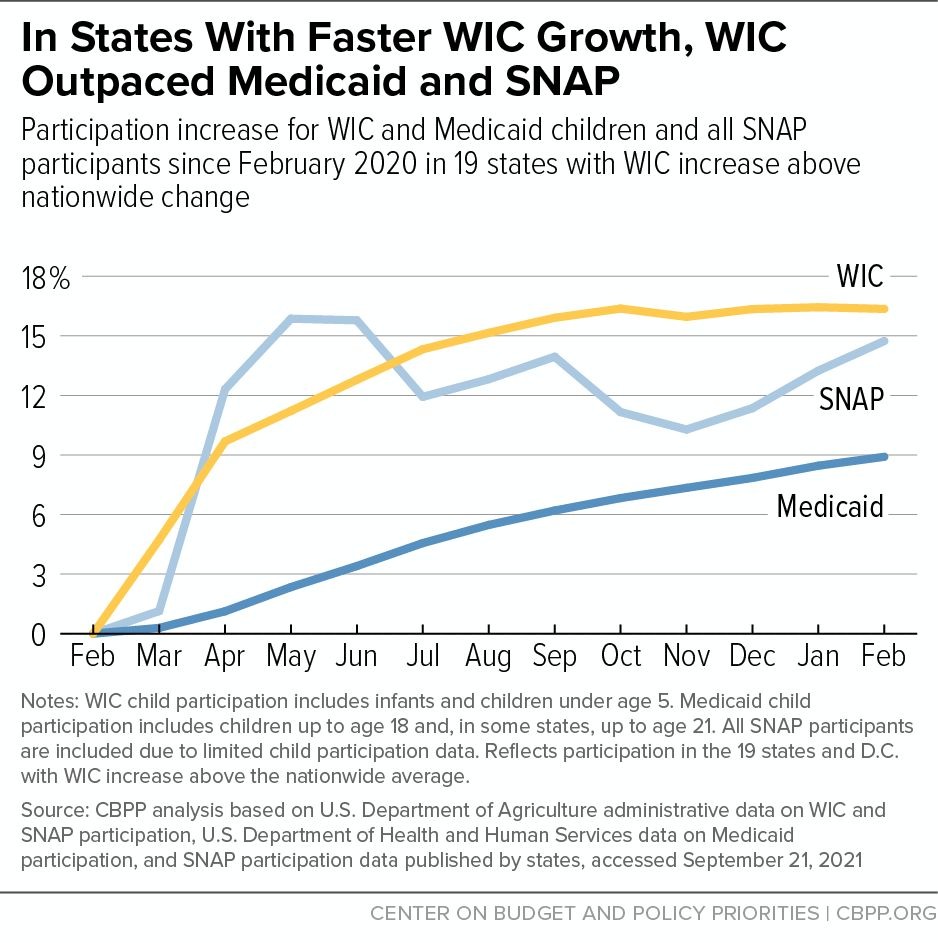
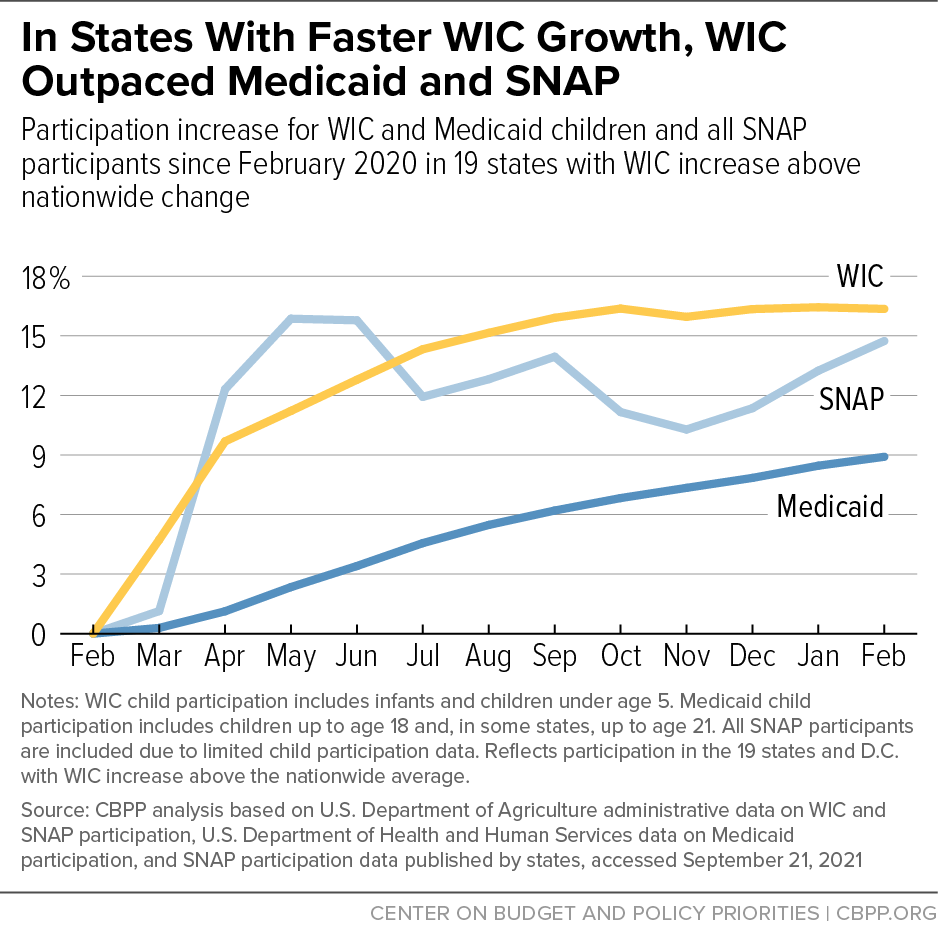
SNAP participation growth didn’t outpace WIC in every state. In the 18 states and D.C. where WIC participation growth by children exceeded the nationwide WIC rate between February 2020 and February 2021, it also slightly exceeded the growth in total SNAP participation: 16 percent versus 15 percent. This suggests there is potential for states with lower increases or declines in WIC child participation to enroll more eligible individuals. Matching SNAP data and WIC would allow for targeted outreach to enroll SNAP participants who are adjunctively eligible for WIC.
Overall, these data suggest that the number of children receiving SNAP who are eligible for WIC but not participating may have grown over the pandemic period. More broadly, given the longer-term decline in WIC participation and the evidence that many SNAP participants who are eligible for WIC aren’t getting WIC benefits, efforts to boost WIC participation among SNAP participants could expand access to WIC’s nutrition, health, and developmental benefits.
State and Local Officials Can Boost WIC Participation
The wide variation in WIC participation during the pandemic across states suggests that there are practices that could help state WIC programs reach more eligible families.[34] But support from other state policy leaders, including Medicaid and SNAP officials, will be critical to expanding WIC’s reach.
Recent COVID-19 relief bills have expanded Medicaid and SNAP eligibility to allow more low-income families to qualify and remain enrolled, reducing procedural hurdles that may have precluded participation previously. These policy changes, combined with rising hardship during the COVID-19 health and economic crises, have resulted in substantial increases in Medicaid and SNAP participation. Through adjunctive eligibility, new Medicaid and SNAP participants are also eligible for WIC.
Comparing WIC participation to Medicaid and SNAP participation can inform state and local efforts to enroll more eligible families in WIC by indicating the extent to which WIC is keeping up with need and the potential benefits of targeting WIC outreach to Medicaid and SNAP participants. This is especially important at this time, while procedural barriers have been removed and a greater share of eligible families are participating in Medicaid. The state data in the Appendix and companion interactive data visualization facilitate such a comparison.[35]
This analysis provides a starting point for such a comparison, but there are limitations in the published national and state data. Fortunately, Congress in 2020 directed USDA to begin publishing state-level estimates of pregnant individuals, infants, and children under 5 who are participating in Medicaid or SNAP but not WIC; when these data become available, they will better illuminate the gaps between WIC participation and Medicaid and SNAP participation.[36]
By partnering with their state Medicaid and SNAP counterparts, state WIC officials could conduct more robust comparisons of participation in each program among children under 5 and pregnant or postpartum individuals. State officials could analyze factors not available publicly, like the age or income level of WIC-eligible individuals who are not enrolled. They could also generate comparisons at the county or local level. Such a partnership could also enable them to:
- Identify Medicaid and SNAP participants who are adjunctively eligible for WIC but are not enrolled.
- Implement robust referrals from Medicaid or SNAP to WIC.
- Ensure that staff who conduct certifications can rely on adjunctive eligibility whenever possible by, for example, establishing online access to Medicaid and SNAP enrollment data or an automated telephone system to confirm Medicaid or SNAP eligibility.
- Conduct targeted outreach to enroll more eligible families in WIC. Pilot projects suggest that individual outreach to eligible families can boost WIC participation.[37]
Together, state WIC, Medicaid, and SNAP leaders can use data to assess the extent to which WIC is reaching eligible families, take steps to enroll more of them, and measure progress over time. Under typical circumstances, the gap between Medicaid and SNAP participation and WIC is worrisome; under the current circumstances it is alarming, given that hardship is significantly higher due to the COVID-19 pandemic and recession. Ensuring that young low-income children receive the full package of supports for which they are eligible can prevent short-term hardship and put children on a healthier course for life.
Appendix: Participation Data for WIC, Medicaid, and SNAP
This report considers overall participation in WIC, Medicaid, and SNAP between February 2020 and February 2021 as a starting point for analysis but focuses on participation by children. To estimate the number of individuals WIC could reach, it would be ideal to examine the number of pregnant and postpartum people and children under 5 who participate in Medicaid and SNAP. Data are available on overall child participation in Medicaid and SNAP, but data on pregnant and postpartum people and children under 5 are limited. In addition, it is unclear how changes in pregnancy and birth rates during the pandemic affected the number of individuals eligible for WIC or Medicaid.[38]
WIC. USDA typically publishes monthly state participation data for WIC within two to three months.[39] In addition to total participation data, it also publishes data on the number of pregnant and postpartum people, infants, and children ages 1-4 who are participating. Data have been published for the 50 states, D.C., U.S. territories, and Indian tribal organizations.
Medicaid. The Department of Health and Human Services (HHS) publishes monthly state enrollment data for Medicaid within five or six months.[40] While HHS does not publish child enrollment data for Medicaid, it publishes combined child enrollment data for Medicaid and the Children’s Health Insurance Program (CHIP). To derive Medicaid child enrollment, we subtract total CHIP enrollment from total child enrollment for Medicaid and CHIP.[41] Data have been published for the 50 states and D.C..[42] Some states have also published Medicaid enrollment data.
SNAP. USDA typically publishes monthly state participation data for SNAP within two to three months.[43] Data have been published for the 50 states, D.C., Guam, and the Virgin Islands. While USDA does not publish child participation data, some states do; ten states have published data for February 2020 through February 2021.[44]
| TABLE 1 | |||||||
|---|---|---|---|---|---|---|---|
Percentage Change in WIC, Medicaid, and SNAP Participation From February 2020 to February 2021, by State | |||||||
| WIC | Medicaid | SNAP | |||||
| State | Total | Children | Pregnant and Postpartum | Total | Children | Total | Children |
| Total | 2% | 5% | -5% | 16% | 11% | 14% | 10% |
| Alabama | 0% | 3% | -11% | 12% | 8% | 13% | |
| Alaska | -7% | -5% | -13% | 11% | 8% | -3% | |
| Arizona | 6% | 9% | -4% | 17% | 13% | 16% | 21% |
| Arkansas | -21% | -22% | -20% | 13% | 7% | 3% | |
| California | 18% | 21% | 6% | 10% | 6% | 10% | |
| Colorado | -1% | -1% | -3% | 21% | 14% | 18% | |
| Connecticut | -1% | 1% | -8% | 12% | 6% | 4% | |
| Delaware | 7% | 11% | -6% | 14% | 12% | -3% | |
| District of Columbia | 16% | 22% | 1% | 10% | 7% | 32% | |
| Florida | -2% | -1% | -8% | 19% | 16% | 27% | |
| Georgia | -7% | -4% | -15% | 16% | 17% | 29% | |
| Hawai’i | 4% | 7% | -5% | 23% | 15% | 30% | |
| Idaho | 2% | 4% | -7% | 23% | 14% | -8% | |
| Illinois | -9% | -8% | -13% | 16% | 6% | 10% | |
| Indiana | 13% | 16% | 0% | 23% | 13% | 18% | |
| Iowa | 4% | 6% | -2% | 14% | 10% | 0% | |
| Kansas | -4% | -2% | -10% | 16% | 15% | 7% | 5% |
| Kentucky | 17% | 23% | -1% | 23% | 11% | 30% | |
| Louisiana | -9% | -9% | -8% | 15% | 6% | 29% | 15% |
| Maine | 4% | 5% | -1% | 17% | 12% | 3% | |
| Maryland | 0% | 2% | -6% | 13% | 9% | 43% | |
| Massachusetts | 11% | 14% | 0% | 15% | 7% | 23% | 22% |
| Michigan | 4% | 6% | -6% | 16% | 10% | 12% | 9% |
| Minnesota | 1% | 3% | -6% | 14% | 10% | 22% | |
| Mississippi | -3% | 1% | -15% | 13% | 13% | -3% | |
| Missouri | -13% | -11% | -17% | 22% | 22% | 6% | |
| Montana | -5% | -3% | -11% | 13% | 8% | -6% | |
| Nebraska | 6% | 8% | -1% | 31% | 13% | 5% | |
| Nevada | -3% | -2% | -9% | 25% | 17% | 17% | |
| New Hampshire | 17% | 19% | 7% | 20% | 11% | -5% | |
| New Jersey | 7% | 10% | -4% | 16% | 12% | 22% | 20% |
| New Mexico | -9% | -8% | -12% | 11% | 8% | 17% | 13% |
| New York | 2% | 5% | -7% | 14% | 8% | 8% | |
| North Carolina | 20% | 25% | 5% | 18% | 10% | 17% | |
| North Dakota | -1% | -1% | -3% | 21% | 19% | 7% | |
| Ohio | -10% | -9% | -14% | 16% | 11% | 12% | 14% |
| Oklahoma | -7% | -6% | -12% | 24% | 19% | 6% | |
| Oregon | -2% | 0% | -7% | 18% | 8% | 30% | |
| Pennsylvania | -9% | -9% | -8% | 14% | 11% | 4% | |
| Rhode Island | -3% | -3% | -3% | 16% | 10% | -1% | |
| South Carolina | 17% | 22% | 2% | 11% | 7% | 7% | |
| South Dakota | 6% | 7% | 2% | 15% | 14% | -2% | -4% |
| Tennessee | 0% | 3% | -8% | 10% | 9% | 7% | |
| Texas | -3% | -1% | -6% | 20% | 19% | 7% | 2% |
| Utah | -11% | -10% | -15% | 32% | 25% | -1% | |
| Vermont | 8% | 10% | 1% | 16% | 7% | 3% | |
| Virginia | 12% | 17% | -2% | 19% | 12% | 12% | |
| Washington | 3% | 5% | -4% | 13% | 5% | 28% | |
| West Virginia | 0% | 3% | -11% | 13% | 9% | 2% | |
| Wisconsin | 2% | 4% | -5% | 19% | 14% | 26% | |
| Wyoming | -5% | -4% | -8% | 20% | 19% | 19% | |
Source: CBPP analysis of USDA administrative data on WIC participation, https://www.fns.usda.gov/pd/wic-program, accessed September 21, 2021; HHS administrative data on Medicaid participation, https://data.medicaid.gov, accessed September 21, 2021; USDA administrative data on SNAP participation, https://www.fns.usda.gov/pd/supplemental-nutrition-assistance-program-snap, accessed September 21, 2021; and monthly state data on SNAP participation published by states. Data are available for the 50 states and D.C. except for SNAP child participation data, which are available for ten states (not including D.C.). Total state participation for WIC includes U.S. territories and Indian tribal organizations in addition to the 50 states and D.C. Total state participation for SNAP includes Guam and the Virgin Islands in addition to the 50 states and D.C. All other totals reflect states with available data.
| |||||||
| TABLE 2 | |||||||||
|---|---|---|---|---|---|---|---|---|---|
WIC Participation by State: Total, Infants and Children Under 5, and Pregnant and Postpartum People | |||||||||
| Total | Infants and Children Under 5 | Pregnant and Postpartum People | |||||||
| State | February 2020 (thousands) | February 2021 (thousands) | Change | February 2020 (thousands) | February 2021 (thousands) | Change | February 2020 (thousands) | February 2021 (thousands) | Change |
| Total | 6,110 | 6,262 | 2% | 4,655 | 4,882 | 5% | 1,455 | 1,380 | -5% |
| Alabama | 112 | 112 | 0% | 84 | 87 | 3% | 27 | 24 | -11% |
| Alaska | 16 | 15 | -7% | 12 | 11 | -5% | 4 | 3 | -13% |
| Arizona | 124 | 132 | 6% | 96 | 105 | 9% | 27 | 26 | -4% |
| Arkansas | 62 | 49 | -21% | 46 | 36 | -22% | 16 | 13 | -20% |
| California | 809 | 953 | 18% | 630 | 763 | 21% | 179 | 190 | 6% |
| Colorado | 79 | 78 | -1% | 61 | 60 | -1% | 19 | 18 | -3% |
| Connecticut | 44 | 43 | -1% | 34 | 34 | 1% | 10 | 9 | -8% |
| Delaware | 16 | 17 | 7% | 13 | 14 | 11% | 4 | 4 | -6% |
| District of Columbia | 12 | 14 | 16% | 9 | 11 | 22% | 3 | 3 | 1% |
| Florida | 413 | 403 | -2% | 314 | 312 | -1% | 99 | 91 | -8% |
| Georgia | 198 | 185 | -7% | 147 | 142 | -4% | 50 | 43 | -15% |
| Hawai’i | 25 | 26 | 4% | 19 | 20 | 7% | 6 | 5 | -5% |
| Idaho | 30 | 30 | 2% | 23 | 24 | 4% | 7 | 7 | -7% |
| Illinois | 171 | 155 | -9% | 130 | 119 | -8% | 41 | 36 | -13% |
| Indiana | 138 | 155 | 13% | 105 | 123 | 16% | 32 | 32 | 0% |
| Iowa | 57 | 59 | 4% | 44 | 47 | 6% | 13 | 13 | -2% |
| Kansas | 46 | 45 | -4% | 36 | 35 | -2% | 11 | 10 | -10% |
| Kentucky | 91 | 107 | 17% | 70 | 86 | 23% | 22 | 21 | -1% |
| Louisiana | 97 | 88 | -9% | 70 | 64 | -9% | 26 | 24 | -8% |
| Maine | 16 | 17 | 4% | 13 | 14 | 5% | 3 | 3 | -1% |
| Maryland | 119 | 119 | 0% | 90 | 92 | 2% | 28 | 27 | -6% |
| Massachusetts | 101 | 112 | 11% | 79 | 90 | 14% | 22 | 22 | 0% |
| Michigan | 203 | 211 | 4% | 160 | 170 | 6% | 44 | 41 | -6% |
| Minnesota | 99 | 100 | 1% | 77 | 80 | 3% | 21 | 20 | -6% |
| Mississippi | 77 | 75 | -3% | 59 | 59 | 1% | 18 | 15 | -15% |
| Missouri | 101 | 88 | -13% | 75 | 67 | -11% | 26 | 22 | -17% |
| Montana | 15 | 14 | -5% | 12 | 11 | -3% | 3 | 3 | -11% |
| Nebraska | 33 | 35 | 6% | 25 | 27 | 8% | 7 | 7 | -1% |
| Nevada | 58 | 56 | -3% | 45 | 44 | -2% | 13 | 12 | -9% |
| New Hampshire | 12 | 14 | 17% | 10 | 11 | 19% | 2 | 3 | 7% |
| New Jersey | 132 | 141 | 7% | 101 | 111 | 10% | 32 | 30 | -4% |
| New Mexico | 38 | 35 | -9% | 29 | 26 | -8% | 9 | 8 | -12% |
| New York | 361 | 368 | 2% | 277 | 290 | 5% | 84 | 78 | -7% |
| North Carolina | 211 | 253 | 20% | 159 | 199 | 25% | 51 | 54 | 5% |
| North Dakota | 10 | 10 | -1% | 8 | 8 | -1% | 2 | 2 | -3% |
| Ohio | 184 | 166 | -10% | 140 | 128 | -9% | 44 | 38 | -14% |
| Oklahoma | 65 | 60 | -7% | 49 | 46 | -6% | 16 | 14 | -12% |
| Oregon | 78 | 76 | -2% | 61 | 61 | 0% | 17 | 16 | -7% |
| Pennsylvania | 190 | 174 | -9% | 147 | 134 | -9% | 43 | 39 | -8% |
| Rhode Island | 17 | 17 | -3% | 14 | 13 | -3% | 4 | 4 | -3% |
| South Carolina | 75 | 87 | 17% | 55 | 67 | 22% | 20 | 20 | 2% |
| South Dakota | 14 | 15 | 6% | 11 | 12 | 7% | 3 | 3 | 2% |
| Tennessee | 111 | 111 | 0% | 81 | 83 | 3% | 30 | 28 | -8% |
| Texas | 678 | 660 | -3% | 488 | 482 | -1% | 190 | 178 | -6% |
| Utah | 41 | 37 | -11% | 31 | 28 | -10% | 10 | 8 | -15% |
| Vermont | 11 | 12 | 8% | 9 | 9 | 10% | 2 | 2 | 1% |
| Virginia | 109 | 122 | 12% | 83 | 96 | 17% | 26 | 26 | -2% |
| Washington | 121 | 125 | 3% | 94 | 99 | 5% | 27 | 26 | -4% |
| West Virginia | 33 | 33 | 0% | 25 | 26 | 3% | 8 | 7 | -11% |
| Wisconsin | 86 | 87 | 2% | 68 | 70 | 4% | 18 | 17 | -5% |
| Wyoming | 7 | 7 | -5% | 6 | 5 | -4% | 2 | 2 | -8% |
Source: CBPP analysis of USDA administrative data on WIC participation, https://www.fns.usda.gov/pd/wic-program, accessed September 21, 2021. Data are available for the 50 states, D.C., U.S. territories, and Indian tribal organizations. Total state participation does not add up to the total participation in the first row because the first row also includes territories and tribal organizations. | |||||||||
| TABLE 3 | ||||||
|---|---|---|---|---|---|---|
Medicaid Enrollment by State: Total and Children | ||||||
| Total | Children | |||||
| State | February 2020 (thousands) | February 2021 (thousands) | Change | February 2020 (thousands) | February 2021 (thousands) | Change |
| Total | 64,559 | 74,584 | 16% | 29,386 | 32,733 | 11% |
| Alabama | 752 | 838 | 12% | 489 | 530 | 8% |
| Alaska | 206 | 230 | 11% | 81 | 87 | 8% |
| Arizona | 1,608 | 1,875 | 17% | 655 | 738 | 13% |
| Arkansas | 769 | 866 | 13% | 337 | 360 | 7% |
| California | 10,275 | 11,347 | 10% | 3,491 | 3,715 | 6% |
| Colorado | 1,198 | 1,453 | 21% | 488 | 556 | 14% |
| Connecticut | 825 | 923 | 12% | 311 | 330 | 6% |
| Delaware | 218 | 249 | 14% | 93 | 104 | 12% |
| District of Columbia | 225 | 248 | 10% | 74 | 78 | 7% |
| Florida | 3,360 | 3,997 | 19% | 2,170 | 2,527 | 16% |
| Georgia | 1,619 | 1,872 | 16% | 1,054 | 1,231 | 17% |
| Hawai’i | 300 | 370 | 23% | 113 | 130 | 15% |
| Idaho | 292 | 358 | 23% | 148 | 169 | 14% |
| Illinois | 2,554 | 2,969 | 16% | 1,071 | 1,138 | 6% |
| Indiana | 1,386 | 1,701 | 23% | 701 | 793 | 13% |
| Iowa | 598 | 681 | 14% | 258 | 283 | 10% |
| Kansas | 319 | 369 | 16% | 204 | 235 | 15% |
| Kentucky | 1,193 | 1,468 | 23% | 453 | 503 | 11% |
| Louisiana | 1,382 | 1,592 | 15% | 602 | 639 | 6% |
| Maine | 256 | 300 | 17% | 97 | 109 | 12% |
| Maryland | 1,190 | 1,341 | 13% | 481 | 525 | 9% |
| Massachusetts | 1,350 | 1,555 | 15% | 476 | 507 | 7% |
| Michigan | 2,263 | 2,629 | 16% | 877 | 968 | 10% |
| Minnesota | 1,043 | 1,194 | 14% | 529 | 582 | 10% |
| Mississippi | 538 | 608 | 13% | 340 | 384 | 13% |
| Missouri | 818 | 1,000 | 22% | 500 | 609 | 22% |
| Montana | 227 | 256 | 13% | 89 | 96 | 8% |
| Nebraska | 213 | 279 | 31% | 130 | 147 | 13% |
| Nevada | 584 | 728 | 25% | 254 | 297 | 17% |
| New Hampshire | 166 | 200 | 20% | 74 | 82 | 11% |
| New Jersey | 1,470 | 1,706 | 16% | 580 | 648 | 12% |
| New Mexico | 706 | 785 | 11% | 293 | 317 | 8% |
| New York | 5,376 | 6,138 | 14% | 1,778 | 1,915 | 8% |
| North Carolina | 1,489 | 1,751 | 18% | 908 | 998 | 10% |
| North Dakota | 88 | 106 | 21% | 40 | 48 | 19% |
| Ohio | 2,398 | 2,791 | 16% | 954 | 1,064 | 11% |
| Oklahoma | 593 | 733 | 24% | 379 | 453 | 19% |
| Oregon | 873 | 1,029 | 18% | 288 | 310 | 8% |
| Pennsylvania | 2,749 | 3,140 | 14% | 1,197 | 1,329 | 11% |
| Rhode Island | 256 | 297 | 16% | 83 | 91 | 10% |
| South Carolina | 941 | 1,042 | 11% | 553 | 592 | 7% |
| South Dakota | 94 | 108 | 15% | 62 | 71 | 14% |
| Tennessee | 1,324 | 1,462 | 10% | 696 | 755 | 9% |
| Texas | 3,633 | 4,344 | 20% | 2,736 | 3,260 | 19% |
| Utah | 272 | 360 | 32% | 143 | 179 | 25% |
| Vermont | 146 | 170 | 16% | 56 | 60 | 7% |
| Virginia | 1,270 | 1,507 | 19% | 600 | 671 | 12% |
| Washington | 1,650 | 1,858 | 13% | 753 | 790 | 5% |
| West Virginia | 472 | 536 | 13% | 179 | 194 | 9% |
| Wisconsin | 980 | 1,166 | 19% | 435 | 497 | 14% |
| Wyoming | 52 | 62 | 20% | 33 | 39 | 19% |
Notes: While HHS does not publish total child participation data for Medicaid, it publishes combined child participation data for Medicaid and CHIP. To derive Medicaid child participation, we subtract total CHIP participation from total child participation for Medicaid and CHIP. The definition of “child” varies across states according to the state’s Medicaid or CHIP state plan; it includes children up to age 18, and in some states, 21. HHS does not publish Medicaid child participation data for Arizona, so we estimate monthly child participation based on quarterly figures published by the state. Source: CBPP analysis of HHS administrative data on Medicaid participation, https://data.medicaid.gov, accessed September 21, 2021. Total participation and child participation data are available for the 50 states and D.C. | ||||||
| TABLE 4 | ||||||
|---|---|---|---|---|---|---|
SNAP Participation by State: Total and Children | ||||||
| Total | Children | |||||
| State | February 2020 (thousands) | February 2021 (thousands) | Change | February 2020 (thousands) | February 2021 (thousands) | Change |
| Total | 36,868 | 42,057 | 14% | 4,379 | 4,816 | 10% |
| Alabama | 705 | 793 | 13% | |||
| Alaska | 80 | 78 | -3% | |||
| Arizona | 783 | 907 | 16% | 359 | 434 | 21% |
| Arkansas | 339 | 349 | 3% | |||
| California | 4,031 | 4,451 | 10% | |||
| Colorado | 431 | 507 | 18% | |||
| Connecticut | 360 | 374 | 4% | |||
| Delaware | 116 | 112 | -3% | |||
| District of Columbia | 109 | 143 | 32% | |||
| Florida | 2,635 | 3,344 | 27% | |||
| Georgia | 1,343 | 1,734 | 29% | |||
| Hawai’i | 152 | 198 | 30% | |||
| Idaho | 148 | 135 | -8% | |||
| Illinois | 1,748 | 1,927 | 10% | |||
| Indiana | 566 | 669 | 18% | |||
| Iowa | 291 | 290 | 0% | |||
| Kansas | 190 | 204 | 7% | 88 | 93 | 5% |
| Kentucky | 482 | 625 | 30% | |||
| Louisiana | 782 | 1,007 | 29% | 364 | 420 | 15% |
| Maine | 154 | 158 | 3% | |||
| Maryland | 591 | 844 | 43% | |||
| Massachusetts | 761 | 934 | 23% | 257 | 313 | 22% |
| Michigan | 1,176 | 1,317 | 12% | 477 | 521 | 9% |
| Minnesota | 391 | 478 | 22% | |||
| Mississippi | 424 | 411 | -3% | |||
| Missouri | 657 | 700 | 6% | |||
| Montana | 106 | 99 | -6% | |||
| Nebraska | 153 | 160 | 5% | |||
| Nevada | 412 | 482 | 17% | |||
| New Hampshire | 72 | 69 | -5% | |||
| New Jersey | 667 | 811 | 22% | 303 | 363 | 20% |
| New Mexico | 445 | 521 | 17% | 183 | 207 | 13% |
| New York | 2,560 | 2,761 | 8% | |||
| North Carolina | 1,213 | 1,424 | 17% | |||
| North Dakota | 48 | 51 | 7% | |||
| Ohio | 1,366 | 1,533 | 12% | 572 | 654 | 14% |
| Oklahoma | 572 | 609 | 6% | |||
| Oregon | 581 | 754 | 30% | |||
| Pennsylvania | 1,729 | 1,795 | 4% | |||
| Rhode Island | 146 | 145 | -1% | |||
| South Carolina | 568 | 610 | 7% | |||
| South Dakota | 78 | 76 | -2% | 38 | 36 | -4% |
| Tennessee | 844 | 900 | 7% | |||
| Texas | 3,162 | 3,396 | 7% | 1,738 | 1,775 | 2% |
| Utah | 165 | 163 | -1% | |||
| Vermont | 68 | 70 | 3% | |||
| Virginia | 680 | 759 | 12% | |||
| Washington | 797 | 1,017 | 28% | |||
| West Virginia | 304 | 308 | 2% | |||
| Wisconsin | 600 | 757 | 26% | |||
| Wyoming | 26 | 31 | 19% | |||
Notes: While USDA does not publish child participation data, ten states do. The definition of “child” varies across states; it includes children up to age 17 or 18. Source: CBPP analysis of USDA administrative data on SNAP participation, https://www.fns.usda.gov/pd/supplemental-nutrition-assistance-program-snap, accessed September 21, 2021, and monthly state data on SNAP participation published by states. Total participation data are available for Guam and the Virgin Islands in addition to the 50 states and D.C. Child participation data are available for ten states (not including D.C.). Participation figures for individual states do not add up to the national total because the national total also includes Guam and the Virgin Islands. The total for child participation only reflects states with available data. | ||||||
End Notes
[1] See Steven Carlson and Zoë Neuberger, “WIC Works: Addressing the Nutrition and Health Needs of Low-Income Families for More Than Four Decades,” CBPP, updated January 27, 2021, www.cbpp.org/wicworks.
[2] In this report, the change in participation between February 2020 and February 2021 refers to the percent by which participation in February 2021 was higher or lower than participation in February 2020. This period was chosen to reflect participation changes that occurred in the year after the start of the COVID-19 pandemic. When this report was originally published in July 2021, there were some gaps in data for the period of February 2020 through February 2021. Those data have since become available and we have updated this report to incorporate the newly available data. While data since February 2021 are now available, they are not included in this report.
[3] “Nationwide” WIC participation growth refers to growth in the 50 states, the District of Columbia, U.S. territories, and Indian tribal organizations. In other contexts, this report will refer to growth in the 50 states and D.C. only.
[4] See interactive data visualization displaying change in participation during the pandemic for WIC, Medicaid, and SNAP by state at www.cbpp.org/wicpandemicparticipationinteractive.
[5] Judith Solomon, Jennifer Wagner, and Aviva Aron-Dine, “Medicaid Protections in Families First Act Critical to Protecting Health Coverage,” CBPP, April 17, 2020, https://www.cbpp.org/research/health/medicaid-protections-in-families-first-act-critical-to-protecting-health-coverage.
[6] References to WIC child participation include infants and children under age 5. While data on participation by infants and children under 5 are available for WIC, data are not published on participation by infants and children under 5 in Medicaid or SNAP. Thus, references to Medicaid and SNAP participation by children include children of all ages. Specifically, references to Medicaid child participation include children up to age 18, and in some states, 21. References to SNAP child participation vary across states and include children up to age 17 or 18.
[7] “Nationwide” SNAP participation growth refers to growth in the 50 states, the District of Columbia, Guam, and the Virgin Islands. Participating in SNAP means the state issued SNAP benefits to a household that month.
[8] WIC participation increased by 1 percent in the ten states with SNAP participation data for children and by 5 percent nationwide. The ten states are likely representative of national participation rates for SNAP but not WIC; WIC participation increased more slowly in these states than nationwide.
[9] Multiple data sources find similarly high levels of food hardship. See Brynne Keith-Jennings, Catlin Nchako, and Joseph Llobrera, “Number of Families Struggling to Afford Food Rose Steeply in Pandemic and Remains High, Especially Among Children and Households of Color,” CBPP, April 27, 2021, https://www.cbpp.org/research/food-assistance/number-of-families-struggling-to-afford-food-rose-steeply-in-pandemic-and. For the most recent data on food hardship during the pandemic, see CBPP, “Tracking the COVID-19 Recession’s Effects on Food, Housing, and Employment Hardships,” https://www.cbpp.org/research/poverty-and-inequality/tracking-the-covid-19-recessions-effects-on-food-housing-and.
[10] The Household Pulse Survey, designed to gather data on the pandemic’s impact on American households, is administered through an online survey, while the Current Population Survey Food Security Supplement is administered through in-person and telephone interviews. Differences between online and other (in-person or telephone) surveys explain some of the difference between food hardship rates in the Household Pulse Survey and in the December 2019 survey (the Current Population Survey Food Security Supplement). One comparison found that, before the pandemic, respondents in an online survey were 38 percent more likely to report food insecurity than comparable respondents in a different survey with a live interviewer.
[11] Kelsey Gray et al., “National and State-Level Estimates of Special Supplemental Nutrition Program for Women, Infants, and Children (WIC) Eligibility and Program Reach in 2017,” USDA, December 2019, https://fns-prod.azureedge.net/sites/default/files/resource-files/WICEligibles2017-Volume1.pdf.
[12] Also in the underlying Census data, some infants who would have been eligible for WIC by virtue of participating in Medicaid were omitted from the estimate of eligible individuals. Thus, the WIC coverage rate (for infants and overall) might be overstated. While the overall coverage rate increased from 56.0 percent in 2017 to 56.9 percent in 2018, it remained below the 58.9 rate for 2016, and if all infants receiving Medicaid were counted as eligible for WIC, the downward trend in participation earlier in the decade might have continued. Kelsey Gray et al., “National- and State-Level Estimates of WIC Eligibility and WIC Program Reach in 2018 With Updated Estimates for 2016 and 2017,” USDA, May 2021, https://fns-prod.azureedge.net/sites/default/files/resource-files/WICEligibles2018-VolumeI.pdf.
[13] Brady Hamilton et al., “Births: Provisional Data for 2020,” U.S. Department of Health and Human Services, Centers for Disease Control and Prevention, May 2021, https://www.cdc.gov/nchs/data/vsrr/vsrr012-508.pdf.
[14] For example, the Brookings Institution estimates that there will be 300,000 (8 percent) fewer births in 2021 than in 2019. See Melissa Kearney and Phillip Levine, “The coming COVID-19 baby bust: Update,” Brookings Institution, December 17, 2020, https://www.brookings.edu/blog/up-front/2020/12/17/the-coming-covid-19-baby-bust-update/; and Melissa Kearney and Phillip Levine, “The coming COVID-19 baby bust is here,” Brookings Institution, May 5, 2021, https://www.brookings.edu/blog/up-front/2021/05/05/the-coming-covid-19-baby-bust-is-here/.
[15] Hamilton et al., op. cit.
[16] Systems that do not allow for remote loading of WIC benefits are referred to as “offline.” For information about which states have offline electronic benefit systems, see WIC EBT Detail Status Report, U.S. Department of Agriculture, last updated June 2, 2021, https://fns-prod.azureedge.net/sites/default/files/resource-files/June2021WICEBTDetailStatusReport.pdf. For further discussion of the difference in participation trends between states with online and offline electronic benefit systems see Aditi Vasan et al., “Association of Remote vs In-Person Benefit Delivery With WIC Participation During the COVID-19 Pandemic,” Journal of the American Medical Association, August 20, 2021, https://jamanetwork.com/journals/jama/fullarticle/2783501.
[17] SNAP benefits do not seem to play a major role in how much of their benefits WIC participants use. A multi-state survey of WIC participants conducted during the spring of 2021 found that 83 percent of respondents did not identify receipt of SNAP as a reason they did not redeem all of their WIC food benefits. Presentation by the Nutrition Policy Institute on June 16, 2021 at the National WIC Association’s Annual Conference.
[18] Keith-Jennings, Nchako, and Llobrera, op. cit.
[19] Individuals also qualify for WIC if they participate in Temporary Assistance for Needy Families (TANF) cash assistance. While all income-eligible individuals also must be at nutritional risk to qualify for WIC, income-eligible families generally meet one of the nutritional risk criteria. For more on adjunctive eligibility, see 7. C.F.R. § 246.7 (d)(2)(vi).
[20] A limited number of individuals are eligible for WIC but not Medicaid or SNAP because WIC has a higher income limit in some states and because WIC eligibility generally does not depend on immigration status.
[21] See Nicole Kline et al., “WIC Participant and Program Characteristics 2018: Final Report,” U.S. Department of Agriculture, May 2020, p. 34, Table 4.1, https://fns-prod.azureedge.net/sites/default/files/resource-files/WICPC2018.pdf. WIC applicants’ higher participation in Medicaid than SNAP may reflect Medicaid’s higher income eligibility limits in some states. It may also reflect underreporting of program participation in instances where participation in another program was not the basis for determining eligibility. Most states have an online portal that allows WIC staff to check an applicant’s participation in Medicaid, but such portals are far less common for SNAP or TANF, so WIC staff may be more likely to gather information on Medicaid participation than on SNAP participation. See Zoë Neuberger, “Modernizing and Streamlining WIC Eligibility Determination and Enrollment Processes,” CBPP, January 6, 2017, Appendix B, Table 3, www.cbpp.org/wicstreamlining.
[22] CBPP and Benefits Data Trust conducted pilots in partnership with Colorado, Massachusetts, Montana, and Virginia in 2018-2019 to identify and address under-enrollment in WIC through data matching and text outreach. Colorado and Montana matched WIC data with SNAP data. Massachusetts matched WIC data with Medicaid data on recent enrollees. Virginia matched WIC data with Medicaid, SNAP, TANF, and foster care data. Massachusetts found that 77 percent of Medicaid participants were not enrolled in WIC, which is higher than the other states likely because Massachusetts matched WIC data with Medicaid data on recent enrollees, who might have had less time to apply for WIC. See Jess Maneely and Zoë Neuberger, “Using Data Matching and Targeted Outreach to Enroll Families With Young Children in WIC,” CBPP, January 5, 2021, https://www.cbpp.org/wicpilotreport.
[23] Even when parents would have lost Medicaid eligibility due to an income increase if not for continuous coverage, their children would have remained income-eligible in many cases since children’s eligibility thresholds are higher. Further, most children who remain on Medicaid likely remain below WIC’s income limit.
[24] CBPP analysis of USDA administrative data on WIC participation, available at https://www.fns.usda.gov/pd/wic-program, accessed September 21, 2021, and Department of Health and Human Services administrative data on Medicaid enrollment, available at https://data.medicaid.gov/, accessed September 21, 2021.
[25] Some 77 percent of WIC participants are infants and children ages 1-4 (referred to in this report as children under 5), based on CBPP analysis of USDA data for fiscal years 2017-2020 available at https://www.fns.usda.gov/pd/wic-program, accessed September 21, 2021.
[26] Medicaid enrollment also reflects income limits above 185 percent of the federal poverty line for pregnant individuals, infants, and/or young children in some states. While Medicaid enrollees in these states are adjunctively income-eligible for WIC, they may be less likely to participate in WIC than lower-income Medicaid enrollees. For each state’s Medicaid income limit for pregnant individuals, infants, and children ages 1 through 5, see Tricia Brooks et al., “Medicaid and CHIP Eligibility and Enrollment Policies as of January 2021: Findings from a 50-State Survey,” Kaiser Family Foundation, March 8, 2021, Tables 1 and 2, https://www.kff.org/medicaid/report/medicaid-and-chip-eligibility-and-enrollment-policies-as-of-january-2021-findings-from-a-50-state-survey/.
[27] For a description of recent pilots that used this approach, see Maneely and Neuberger, op. cit. For more information about how to conduct data matching and targeted text message outreach, see Jess Maneely and Zoë Neuberger, “Matching Data Across Benefit Programs Can Increase WIC Enrollment,” CBPP, April 27, 2021, https://www.cbpp.org/wicdatamatching; and Zoë Neuberger and Jess Maneely, “Targeted Text Message Outreach Can Increase WIC Enrollment, Pilots Show,” CBPP, June 10, 2021, https://www.cbpp.org/wictexting.
[28] Under a provision of the American Rescue Plan, beginning in April 2022 states will have the option to extend Medicaid coverage to individuals for 12 months postpartum.
[29] Usha Ranji, Ivette Gomez, and Alina Salganicoff, “Expanding Postpartum Medicaid Coverage,” Kaiser Family Foundation, March 9, 2021, https://www.kff.org/womens-health-policy/issue-brief/expanding-postpartum-medicaid-coverage/.
[30] See published USDA data on WIC participation, https://www.fns.usda.gov/pd/wic-program, accessed September 21, 2021, and on SNAP participation, https://www.fns.usda.gov/pd/supplemental-nutrition-assistance-program-snap, accessed September 21, 2021.
[31] WIC participation increased by 1 percent in the ten states with SNAP participation data for children and by 5 percent nationwide. The ten states are likely representative of national participation rates for SNAP but not WIC; WIC participation increased more slowly in these states than nationwide.
[32] If the trend during the pandemic is similar, then the growth based on these ten states may modestly understate the national growth in SNAP participation by children, and the gap between SNAP and WIC could be even larger.
[33] CBPP analysis of USDA’s “Characteristics of SNAP Households” reports, fiscal years 2007-2019, https://www.fns.usda.gov/data-research. This report was previously titled “Characteristics of Food Stamp Households.”
[34] For a discussion of steps states can take to simplify WIC enrollment and case studies describing state and local projects to streamline certification, see Zoë Neuberger, “Streamlining and Modernizing WIC Enrollment,” CBPP, updated December 17, 2020, www.cbpp.org/wiccasestudies. For an online toolkit state and local WIC agencies can use to identify ways to streamline WIC enrollment and participation and find examples of promising practices, see CBPP, “Assessing Your WIC Certification Practices,” June 15, 2021, www.cbpp.org/wiccertificationtoolkit.
[35] The interactive, which displays state variation in WIC participation trends and changes in participation during the pandemic for WIC, Medicaid, and SNAP, is available at www.cbpp.org/wicpandemicparticipationinteractive.
[36] See report submitted by the House Agriculture Committee accompanying the fiscal year 2021 appropriations bill, “Agriculture, Rural Development, Food and Drug Administration, and Related Agencies Appropriations Bill, 2021,” Report 116-446, July 13, 2020, p. 73, https://www.congress.gov/116/crpt/hrpt446/CRPT-116hrpt446.pdf.
[37] See Maneely and Neuberger, “Using Data Matching and Targeted Outreach to Enroll Families With Young Children in WIC,” op. cit.
[38] The number of pregnant individuals participating in WIC declined between February 2020 and February 2021, but so did the number of infants participating, most of whom would have been conceived before the pandemic. The declines were larger than for the same period one year earlier (February 2019 to February 2020) but smaller than for the same period two years earlier (February 2018 to February 2019). Thus, it is not clear whether the ongoing decline in pregnancies and births is merely continuing or whether the pandemic is accelerating it. There were in fact fewer births in November and December 2020 than earlier in the year, which indicates a decline in pregnancies as the pandemic set in in February and March 2020, but without data for 2021 we do not yet know if this decline was sustained.
[39] USDA data are available at https://www.fns.usda.gov/pd/wic-program, accessed September 21, 2021.
[40] HHS data are available at https://data.medicaid.gov/, accessed September 21, 2021. There are small variations in how a few states report data to HHS, but these do not result in substantial differences in rates of growth across all states.
[41] CHIP provides health insurance to children in low-income households whose incomes are too high for Medicaid. CHIP is also available to pregnant individuals, so our calculation likely underestimates the total number of children enrolled in Medicaid.
[42] The definition of “child” varies across states according to the state’s Medicaid or CHIP state plan; it includes children up to age 18, and in some states, 21. HHS does not publish Medicaid child enrollment data for Arizona, so we estimate monthly child enrollment based on quarterly figures published by the state.
[43] USDA published data are available at https://www.fns.usda.gov/pd/supplemental-nutrition-assistance-program-snap, accessed September 21, 2021.
[44] The definition of “child” varies across states; it includes children up to age 17 or 18. Massachusetts did not publish child participation data for May 2020, so we estimated it by assuming the same share of children as in other months.