House GOP Framework Would Give Millionaires $2.6 Trillion in Tax Cuts, While Cutting Programs for Low- and Moderate-Income People by $3.7 Trillion
Middle Class Would Also Lose More Than It Would Gain
End Notes
[1] James R. Nunns, et al., “An Analysis of the House GOP Tax Plan,” Tax Policy Center, September 16, 2016, http://www.taxpolicycenter.org/publications/analysis-house-gop-tax-plan; and TPC Tables T16-0196, T16-0197, T16-0198, and T16-0199, http://www.taxpolicycenter.org/simulations/house-gop-tax-plan-sep-2016.
[2] Richard Kogan and Isaac Shapiro, “House GOP Budget Gets 62 Percent of Budget Cuts From Low- and Moderate-Income Programs,” Center on Budget and Policy Priorities, March 28, 2016, https://www.cbpp.org/research/federal-budget/house-gop-budget-gets-62-percent-of-budget-cuts-from-low-and-moderate-income.
[3] For an analysis of the specific provisions in the plan, see Chuck Marr and Chye-Ching Huang, “House GOP ‘A Better Way’ Tax Cuts Would Overwhelmingly Benefit Top 1 Percent While Sharply Expanding Deficits,” Center on Budget and Policy Priorities, September 16, 2016, https://www.cbpp.org/research/federal-tax/house-gop-a-better-way-tax-cuts-would-overwhelmingly-benefit-top-1-percent.
[4] As context, in 2025 only a projected 0.8 percent of the population will live in households with incomes exceeding $1 million. The TPC data also project that millionaires will receive 14 percent of the nation’s total after-tax income in 2025, before considering the effects of the House GOP tax plan.
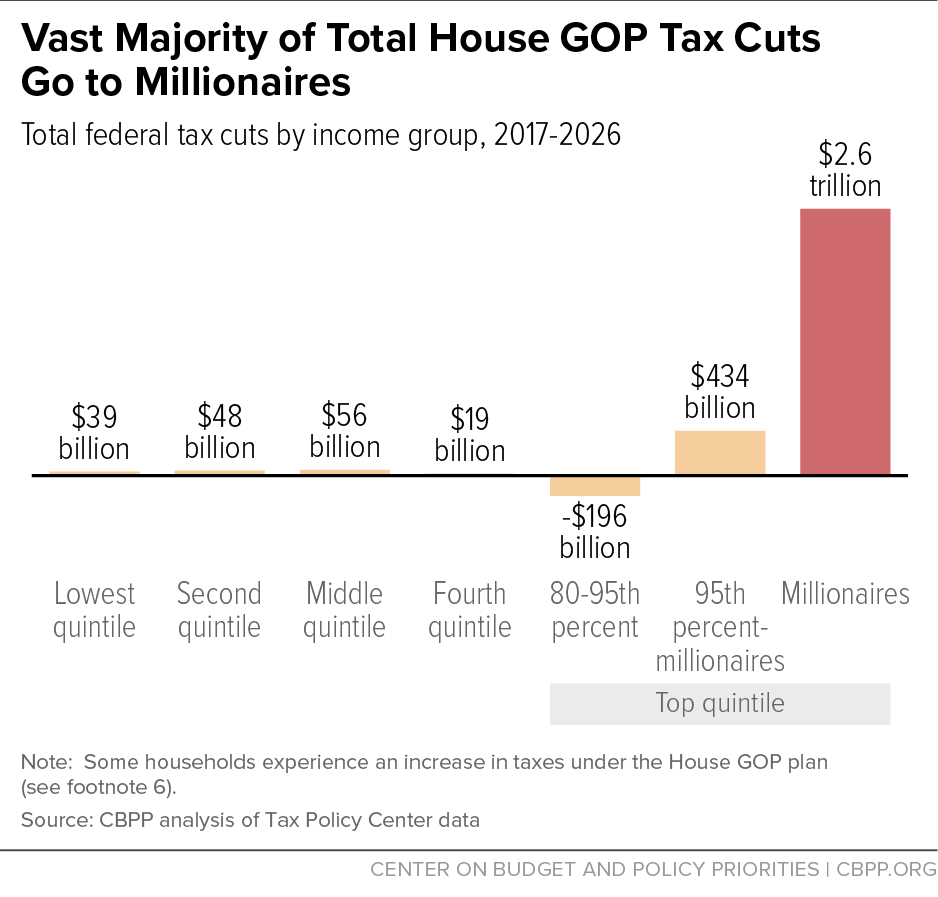
[5] TPC only estimates the distribution of the tax cuts for 2017 and 2025. To estimate the tax cuts that millionaires would receive over the decade as a whole, this analysis averages the share of the tax cuts they would receive in those two years and multiplies the result by $3.1 trillion (TPC’s ten-year estimate of the plan’s total tax cuts). TPC found that millionaires would receive 71.2 percent of the tax cuts in 2017 and 96.5 percent in 2025, yielding an average of 83.9 percent. Multiplying that figure by $3.1 trillion produces a total tax cut for millionaires of $2.6 trillion. The middle fifth of taxpayers would receive 2.8 percent of the tax cuts in 2017 and 0.8 percent in 2025, yielding an average of 1.8 percent; $3.1 trillion*.018 = $56 billion.
[6] The TPC data also indicate that over the next decade, as a group households with incomes between $75,000 and $500,000 — whose incomes mostly place them in the 80-95th percentile of households — will experience a tax increase under the House GOP plan. This likely results from a combination of the elimination of certain deductions that benefit these households (such as the ability to deduct state and local tax payments) and the elimination, after 2017, of the deductibility of certain interest expenses on loans (this disallowance likely has the most effect on business owners somewhat below the very top cash income levels, who may be more highly leveraged than those at the very top). TPC estimates indicate that for this group, changes such as these outweigh the value of cuts to their tax rates and other provisions that benefit them.
[7] The top 0.1 percent of taxpayers would receive 46.5 percent of the tax cuts in 2017 and 61.0 percent in 2025, yielding an average of 53.8 percent. $3.1 trillion*.538 = $1.7 trillion.
[8] Although this budget was not voted on by the full House of Representatives, the Republican House majority passed budgets with similar priorities several years in a row.
[9] Kogan and Shapiro, March 28, 2016.
[10] Given the lack of specificity in the House GOP budget plan, and the inherent difficulty in allocating the impact of reductions in programs such as infrastructure spending or medical research that are not direct transfer programs, it is impossible to measure the precise effects of the $2.3 trillion in spending cuts on millionaires. But ballpark estimates, using two approaches suggested by the Congressional Budget Office, indicate these negative effects would be quite modest relative to the size of their tax cuts. One method is to allocate the spending reductions “in proportion to each household’s share of the population”; by this approach, millionaires would lose just $16 billion over the decade. A second method is to allocate spending reductions “in proportion to each household’s share of total market income”; by this approach, millionaires would lose about $370 billion from the $2.3 trillion in spending reductions. Congressional Budget Office, The Distribution of Federal Spending and Taxes in 2006, November 2013, pp. 8-9. https://www.cbo.gov/sites/default/files/113th-congress-2013-2014/reports/44698-Distribution_11-2013.pdf.
[11] Using TPC’s conventional cost estimate of the tax plan, the total spending cuts needed to balance the budget after accounting for the GOP’s tax plan would be 52 percent larger than those required under the House GOP budget plan, amounting to a total of $9.1 trillion. Using TPC’s dynamic revenue estimate, the total spending cuts would be 42 percent larger than those required under the budget plan.
The model that TPC uses for its dynamic estimate (known as an “overlapping generations” or “life-cycle” model) is especially sensitive to problematic assumptions about people’s expectations of future tax and spending policy. As TPC notes, there is substantial uncertainty in its estimates because changing assumptions can greatly alter its results. In addition to this type of model, the Congressional Budget Office (CBO) and the Joint Committee on Taxation (JCT) also use alternative models known as “Solow” models, which typically produce smaller dynamic effects that more closely reflect available empirical estimates of the relationship between changes in the tax system and changes in economic behavior. TPC intends to add a Solow model for its future estimates of dynamic effects, but the model isn’t yet complete. Former CBO Director Douglas Elmendorf discusses the complexity of the assumptions underlying the overlapping generations model and his general (though not universal) recommendation that CBO and JCT should emphasize results from the Solow model at https://www.brookings.edu/wp-content/uploads/2015/09/ElmendorfTextFall15BPEA.pdf (paper page 124-125, pdf page 34-35).
[12] For instance, if the $2.3 trillion in cuts in programs not targeted on low- and moderate-income people were distributed evenly across the population, the middle fifth of the population would lose $460 billion. In addition, some middle-class households would be affected by the cuts to programs targeted on low- and moderate-income people.


