Health Premiums Will Rise Steeply for Millions if Rescue Plan Tax Credits Expire
Temporary enhancements to premium tax credits, included in the American Rescue Plan, have played a critical role in helping more people afford health coverage in the Affordable Care Act (ACA) marketplaces. But the enhancements are set to expire at the end of the year. If Congress does not act this summer, the large majority of the 14.5 million people who signed up for marketplace coverage this year, including those in low- and moderate-income households, will either lose coverage or pay much more for premiums in 2023.
The Rescue Plan increased the size of health insurance premium tax credits available through the ACA marketplaces for 2021 and 2022, eliminating or reducing out-of-pocket premiums for millions of people. In addition, the Rescue Plan made more people eligible for the tax credits, ensuring that enrollees with moderate incomes pay no more than 8.5 percent of their incomes toward premiums. These affordability improvements also increased health coverage, prompting a record 14.5 million people to select marketplace plans during the 2022 open enrollment period, up from 12 million in 2021 and 11.4 million in 2020. Nearly one-third of enrollees selected a plan for $10 per month or less, and average monthly premiums fell 23 percent compared to the year before the enhancements.[1]
Expiration of the credit improvements would cause a steep rise in the average amount that those who remain covered must pay toward premiums, at a time when many people are already struggling with increased costs for food, housing, and other basics. And it would lead some to forgo coverage given the higher cost. Without congressional action this summer, people shopping for marketplace coverage will be notified of these looming premium hikes this fall and an estimated 3.1 million people will lose coverage and become uninsured in 2023.[2] Moreover, the sudden increase in marketplace premium costs may coincide with the expected end of the federal public health emergency declaration, when many Medicaid enrollees no longer eligible under the “continuous coverage” requirement will be seeking new sources of affordable coverage. Extending the tax credit improvements, while also closing the coverage gap in the 12 states that have not adopted the ACA Medicaid expansion, are critical steps to protect people from becoming uninsured and to ensure affordable health coverage for people of all incomes.[3]
Millions Would Lose Coverage or Face Premium Hikes
If the Rescue Plan premium tax credit enhancements expire, 3.1 million people are projected to lose coverage and become uninsured in 2023, based on research by the Urban Institute.[4] Coverage losses would occur broadly across demographic and income groups. The largest percentage declines in coverage would occur among those with low and moderate incomes: the number of uninsured people between 138 and 400 percent of the federal poverty level would increase by over 17 percent. All age groups would experience significant increases in the number of people uninsured, including older people. For example, the number of 55- to 64-year-olds who are uninsured would increase by over 12 percent. The tremendous, recent gains in marketplace enrollment would be reversed.
Of those who remain in marketplace coverage, an estimated 8.9 million would see their premium subsidies reduced. Another 1.5 million people would keep some source of coverage, most of them individual market coverage on or off the marketplace, but lose their subsidies entirely, research by the Department of Health and Human Services projects.[5] The amounts people would have to pay for coverage would increase sharply. Subsidy losses would average $406 a year for those who see reductions but remain in marketplace coverage and $3,277 a year for those who lose their subsidies entirely but keep some source of coverage.[6] Premium increases would also occur broadly across income groups, age groups, and races and ethnicities. For example, the Urban Institute estimates that those with subsidized marketplace coverage and incomes between 150 and 400 percent of the federal poverty level (about $20,000-$54,000 for an individual in 2022) would pay over $1,000 more per person in annual premiums.[7]
Expiration of the premium tax credit enhancements could come at a particularly difficult time for the potentially 15 million people estimated to lose Medicaid coverage after the federal public health emergency ends and states are no longer required to maintain continuous coverage for Medicaid enrollees.[8] These Medicaid enrollees who lose coverage, due for example to slight income increases, will be seeking other forms of coverage, and the far higher marketplace premiums that would result if the Rescue Plan enhancements expire could be the deciding factor in whether they obtain marketplace coverage or become uninsured.
Premiums Would Rise in Every State for Individuals and Families Across Ages, Income Levels
Premium costs would increase for marketplace enrollees of all ages and across income levels if the Rescue Plan expansions expire, and would come on top of inflation that is straining family budgets. Among those with lower incomes who would see their subsidies reduced, for example:
- A single individual making $18,000 (139 percent of the poverty level) would no longer be eligible for a zero-premium plan and would see their monthly marketplace premium rise from $0 to $52 — an annual increase of $624.
- A single individual making $30,000 (232 percent of the poverty level) would see their monthly marketplace premium more than double, from $82 to $192 — an annual increase of $1,320.
- A 60-year-old couple making $45,000 (258 percent of the poverty level) would see monthly marketplace premiums increase from $162 to $321 — an annual increase of roughly $1,900.
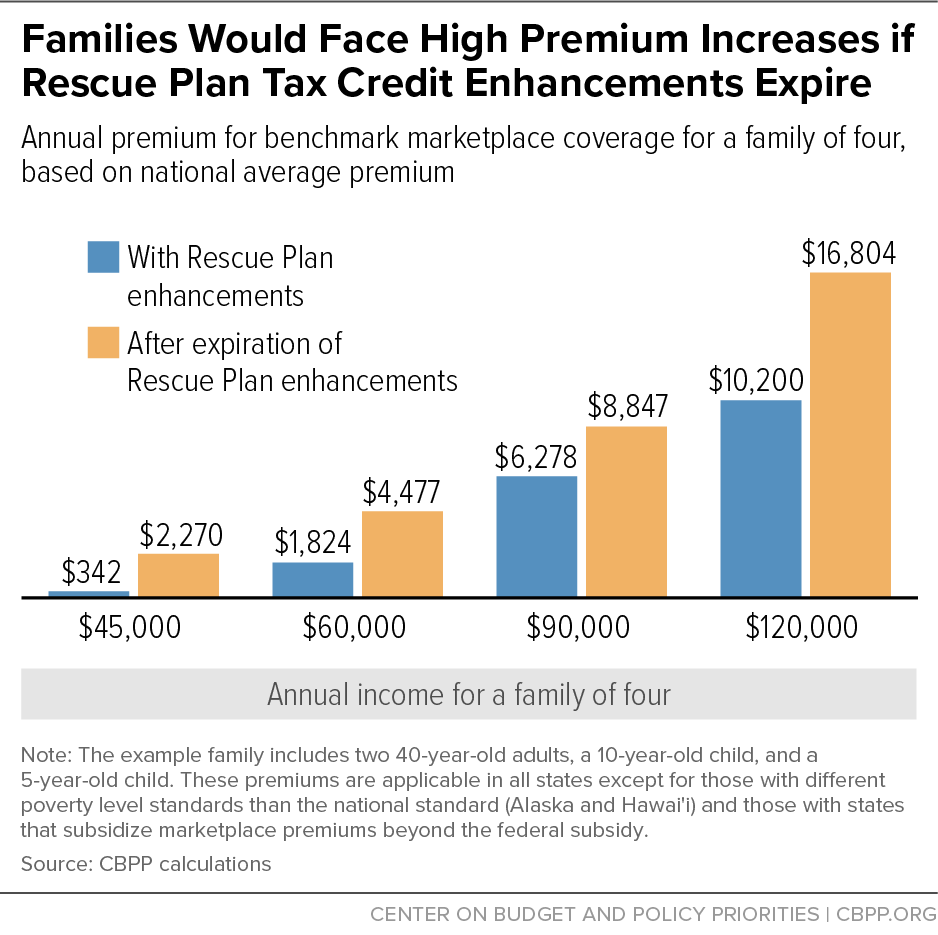
- A family of four making $60,000 (226 percent of the poverty level) would see their monthly marketplace premium increase from $152 to $373 — an annual increase of about $2,650.[9] (See Appendix Table 1 for the costs facing people of various family sizes, ages, and incomes, and Figure 1 for a family of four at different income levels.)
The Rescue Plan also made those with incomes above 400 percent of the federal poverty level newly eligible for premium tax credits if their premiums are high enough. This has helped many people who do not have low incomes but do face high premium burdens to afford coverage. The Rescue Plan limited marketplace premiums to no more than 8.5 percent of income for this group; if the enhancements expire, this protection would be eliminated, and many would face dramatic premium hikes. For example:
- A typical 60-year-old couple making $75,000 (430 percent of the poverty level) would see monthly marketplace premiums more than triple, from $531 to $1,860 — an annual increase of roughly $16,000.
- A typical family of four making $120,000 (452 percent of the poverty level) would see their monthly marketplace premium increase from $850 to $1,400 — an annual increase of about $6,600.
Residents in Some States Face Particularly High Premium Increases
Residents in all states would see higher premiums, but in some states more than others. (See Appendix Table 2.) For example, due to the Rescue Plan enhancements, West Virginia’s 2022 enrollees saved an average of $1,536 in annual premiums, more than any other state using the HealthCare.gov platform.[10] If the enhancements are not extended, many in West Virginia would no longer be protected from the state’s high average marketplace premiums; at $752 per month for benchmark premiums (the second-lowest-cost silver plan), they are the second highest among all states and far higher than the national average of $438.[11]
As a result, residents in many states will face skyrocketing out-of-pocket cost increases. Part of the reason for West Virginia’s high average marketplace premiums could be that their marketplace enrollees tend to be older than those in other states. Older enrollees, particularly those with incomes above 400 percent of the poverty level who would lose subsidies entirely, would likely face the largest premium hikes if the Rescue Plan enhancements expire. For example, a 60-year-old West Virginia couple making $75,000 would see annual marketplace premiums increase from $6,375 to over $38,000. Families with moderate incomes would also face steep increases in West Virginia. For example, a family of four making $120,000 would see their annual marketplace premium increase from $10,200 to almost $29,000. Cost spikes like this are likely to drive up the number of people forgoing coverage entirely.
Similarly, Wyoming marketplace enrollees saved $1,392 in annual premiums thanks to the Rescue Plan, second only to West Virginia. Wyoming enrollees who lose their subsidies will be exposed to the state’s high premiums, which at an average of $762 per month for benchmark coverage are higher than any other state. In Wyoming, a 60-year-old couple making $75,000 would see annual marketplace premiums increase from $6,375 to nearly $39,000, and a family of four making $120,000 would see their annual marketplace premium increase from $10,200 to over $29,000.[12]
Appendix
| APPENDIX TABLE 1 | ||||
|---|---|---|---|---|
| Premiums Will Increase for Individuals, Couples, and Families at Various Income Levels if Premium Tax Credit Enhancements Expire | ||||
| Annual marketplace premiums | ||||
| With Rescue Plan enhancements (current law) | Rescue Plan enhancements expire | Premium increase if enhancements expire | Percentage premium increase | |
| 45-year-old individual | ||||
| $18,000 (139% FPL) | $0 | $624 | $624 | N/A |
| $30,000 (232% FPL) | $984 | $2,304 | $1,320 | 134% |
| $45,000 (349% FPL) | $3,251 | $4,424 | $1,173 | 36% |
| $60,000 (465% FPL) | $5,100 | $5,939 | $839 | 16% |
| 60-year-old couple | ||||
| $30,000 (172% FPL) | $264 | $1,556 | $1,292 | 489% |
| $45,000 (258% FPL) | $1,944 | $3,857 | $1,913 | 98% |
| $60,000 (344% FPL) | $4,260 | $5,898 | $1,638 | 38% |
| $75,000 (430% FPL) | $6,375 | $22,324 | $15,949 | 250% |
| Family of four | ||||
| $45,000 (169% FPL) | $342 | $2,270 | $1,928 | 564% |
| $60,000 (226% FPL) | $1,824 | $4,477 | $2,653 | 145% |
| $90,000 (339% FPL) | $6,278 | $8,847 | $2,569 | 41% |
| $120,000 (452% FPL) | $10,200 | $16,804 | $6,604 | 65% |
| APPENDIX TABLE 2 | |||||||||||
|---|---|---|---|---|---|---|---|---|---|---|---|
| Annual Premiums Will Increase for Individuals, Couples, and Families at Various Income Levels if Premium Tax Credit Enhancements Expire | |||||||||||
| 45-year-old individual; $60,000 (465% FPL) | 60-year-old couple; $75,000 (430% FPL) | Family of four; $120,000 (452% FPL) | |||||||||
| State | With Rescue Plan enhancements (current law) |
Rescue Plan enhancements expire | Premium increase if enhancements expire | With Rescue Plan enhancements (current law) | Rescue Plan enhancements expire | Premium increase if enhancements expire | With Rescue Plan enhancements (current law) | Rescue Plan enhancements expire | Premium increase if enhancements expire | ||
| U.S. average | $5,100 | $5,939 | $839 | $6,375 | $22,324 | $15,949 | $10,200 | $16,804 | $6,604 | ||
| Alabama | 5,100 | 8,095 | 2,995 | 6,375 | 30,427 | 24,052 | 10,200 | 21,447 | 11,247 | ||
| Alaska | 6,371 | 9,654 | 3,283 | 7,967 | 36,289 | 28,322 | 12,752 | 27,317 | 14,565 | ||
| Arizona | 5,100 | 5,288 | 188 | 6,375 | 19,877 | 13,502 | 10,200 | 14,963 | 4,763 | ||
| Arkansas | 5,100 | 5,247 | 147 | 6,375 | 19,724 | 13,349 | 10,200 | 14,848 | 4,648 | ||
| California | 5,100 | 5,654 | 554 | 6,375 | 21,253 | 14,878 | 10,200 | 15,999 | 5,799 | ||
| Colorado | 4,854 | 4,854 | 0 | 6,375 | 18,246 | 11,871 | 10,200 | 13,735 | 3,535 | ||
| Connecticut | 5,100 | 7,878 | 2,778 | 6,375 | 29,612 | 23,237 | 10,200 | 22,291 | 12,091 | ||
| Delaware | 5,100 | 7,430 | 2,330 | 6,375 | 27,930 | 21,555 | 10,200 | 21,025 | 10,825 | ||
| District of Columbia | 5,100 | 5,625 | 525 | 6,375 | 19,995 | 13,620 | 10,200 | 15,518 | 5,318 | ||
| Florida | 5,100 | 6,183 | 1,083 | 6,375 | 23,241 | 16,866 | 10,200 | 17,495 | 7,295 | ||
| Georgia | 5,100 | 5,342 | 242 | 6,375 | 20,081 | 13,706 | 10,200 | 15,116 | 4,916 | ||
| Hawai'i | 5,868 | 6,562 | 694 | 7,334 | 24,668 | 17,334 | 11,732 | 18,569 | 6,837 | ||
| Idaho | 5,100 | 6,251 | 1,151 | 6,375 | 23,496 | 17,121 | 10,200 | 17,687 | 7,487 | ||
| Illinois | 5,100 | 5,668 | 568 | 6,375 | 21,304 | 14,929 | 10,200 | 16,037 | 5,837 | ||
| Indiana | 5,100 | 5,396 | 296 | 6,375 | 20,285 | 13,910 | 10,200 | 15,270 | 5,070 | ||
| Iowa | 5,100 | 6,806 | 1,706 | 6,375 | 25,586 | 19,211 | 10,200 | 19,260 | 9,060 | ||
| Kansas | 5,100 | 6,101 | 1,001 | 6,375 | 22,935 | 16,560 | 10,200 | 17,265 | 7,065 | ||
| Kentucky | 5,100 | 5,247 | 147 | 6,375 | 19,724 | 13,349 | 10,200 | 14,848 | 4,648 | ||
| Louisiana | 5,100 | 7,335 | 2,235 | 6,375 | 27,573 | 21,198 | 10,200 | 20,756 | 10,556 | ||
| Maine | 5,100 | 5,790 | 690 | 6,375 | 21,763 | 15,388 | 10,200 | 16,382 | 6,182 | ||
| Maryland | 4,447 | 4,447 | 0 | 6,375 | 16,717 | 10,342 | 10,200 | 12,584 | 2,384 | ||
| Massachusetts | 5,063 | 5,063 | 0 | 6,375 | 15,850 | 9,475 | 10,200 | 14,369 | 4,169 | ||
| Michigan | 4,610 | 4,610 | 0 | 6,375 | 17,329 | 10,954 | 10,200 | 13,045 | 2,845 | ||
| Minnesota | 4,434 | 4,434 | 0 | 6,375 | 16,666 | 10,291 | 10,200 | 13,313 | 3,113 | ||
| Mississippi | 5,100 | 6,074 | 974 | 6,375 | 22,833 | 16,458 | 10,200 | 16,094 | 5,894 | ||
| Missouri | 5,100 | 5,993 | 893 | 6,375 | 22,527 | 16,152 | 10,200 | 16,958 | 6,758 | ||
| Montana | 5,100 | 6,549 | 1,449 | 6,375 | 24,617 | 18,242 | 10,200 | 18,531 | 8,331 | ||
| Nebraska | 5,100 | 8,067 | 2,967 | 6,375 | 30,325 | 23,950 | 10,200 | 22,828 | 12,628 | ||
| Nevada | 5,100 | 5,193 | 93 | 6,375 | 19,520 | 13,145 | 10,200 | 14,694 | 4,494 | ||
| New Hampshire | 4,190 | 4,190 | 0 | 6,375 | 15,749 | 9,374 | 10,200 | 11,855 | 1,655 | ||
| New Jersey | 5,100 | 5,749 | 649 | 6,375 | 21,610 | 15,235 | 10,200 | 16,267 | 6,067 | ||
| New Mexico | 5,100 | 5,274 | 174 | 6,375 | 19,826 | 13,451 | 10,200 | 14,924 | 4,724 | ||
| New York | 5,100 | 7,104 | 2,004 | 6,375 | 14,208 | 7,833 | 10,200 | 20,246 | 10,046 | ||
| North Carolina | 5,100 | 6,834 | 1,734 | 6,375 | 25,687 | 19,312 | 10,200 | 19,337 | 9,137 | ||
| North Dakota | 5,100 | 6,739 | 1,639 | 6,375 | 25,331 | 18,956 | 10,200 | 19,068 | 8,868 | ||
| Ohio | 5,085 | 5,085 | 0 | 6,375 | 19,113 | 12,738 | 10,200 | 14,387 | 4,187 | ||
| Oklahoma | 5,100 | 6,752 | 1,652 | 6,375 | 25,382 | 19,007 | 10,200 | 19,106 | 8,906 | ||
| Oregon | 5,100 | 6,020 | 920 | 6,375 | 22,629 | 16,254 | 10,200 | 15,951 | 5,751 | ||
| Pennsylvania | 5,100 | 5,288 | 188 | 6,375 | 19,877 | 13,502 | 10,200 | 14,963 | 4,763 | ||
| Rhode Island | 4,895 | 4,895 | 0 | 6,375 | 18,399 | 12,024 | 10,200 | 13,850 | 3,650 | ||
| South Carolina | 5,100 | 6,020 | 920 | 6,375 | 22,629 | 16,254 | 10,200 | 17,035 | 6,835 | ||
| South Dakota | 5,100 | 8,149 | 3,049 | 6,375 | 30,631 | 24,256 | 10,200 | 23,058 | 12,858 | ||
| Tennessee | 5,100 | 6,034 | 934 | 6,375 | 22,680 | 16,305 | 10,200 | 17,073 | 6,873 | ||
| Texas | 5,100 | 5,749 | 649 | 6,375 | 21,610 | 15,235 | 10,200 | 16,267 | 6,067 | ||
| Utah | 5,100 | 6,467 | 1,367 | 6,375 | 22,199 | 15,824 | 10,200 | 16,812 | 6,612 | ||
| Vermont | 5,100 | 8,988 | 3,888 | 6,375 | 17,976 | 11,601 | 10,200 | 25,256 | 15,056 | ||
| Virginia | 5,100 | 6,101 | 1,001 | 6,375 | 22,935 | 16,560 | 10,200 | 17,265 | 7,065 | ||
| Washington | 5,100 | 5,369 | 269 | 6,375 | 20,183 | 13,808 | 10,200 | 15,193 | 4,993 | ||
| West Virginia | 5,100 | 10,196 | 5,096 | 6,375 | 38,327 | 31,952 | 10,200 | 28,851 | 18,651 | ||
| Wisconsin | 5,100 | 5,817 | 717 | 6,375 | 21,865 | 15,490 | 10,200 | 16,459 | 6,259 | ||
| Wyoming | 5,100 | 10,332 | 5,232 | 6,375 | 38,837 | 32,462 | 10,200 | 29,235 | 19,035 | ||
End Notes
[1] Gideon Lukens, Jennifer Sullivan, and Farah Erzouki, “COVID Relief Provisions Stabilized Health Coverage, Improved Access and Affordability,” CBPP, March 10, 2022, https://www.cbpp.org/research/health/covid-relief-provisions-stabilized-health-coverage-improved-access-and.
[2] Matthew Buettgens, Jessica Banthin, and Andrew Green, “What If the American Rescue Plan Act Premium Tax Credits Expire?” Urban Institute, April 7, 2022, https://www.urban.org/research/publication/what-if-american-rescue-plan-act-premium-tax-credits-expire.
[3] Laura Guerra-Cardus and Laura Harker, “Congress Needs to Act Now to Reduce Coverage Losses When Public Health Emergency Ends,” CBPP, April 26, 2022, https://www.cbpp.org/blog/congress-needs-to-act-now-to-reduce-coverage-losses-when-public-health-emergency-ends.
[4] Buettgens, Banthin, and Green, op cit.
[5] D. Keith Branham et al., “Projected Coverage and Subsidy Impacts If the American Rescue Plan’s Marketplace Provisions Sunset in 2023,” Office of the Assistant Secretary for Planning and Evaluation (ASPE), Department of Health and Human Services, March 23, 2022, https://aspe.hhs.gov/reports/impacts-ending-american-rescue-plan-marketplace-provisions.
[6] Ibid.
[7] Buettgens, Banthin, and Green, op. cit.
[8] Matthew Buettgens and Andrew Green, “What Will Happen to Medicaid Enrollees’ Health Coverage after the Public Health Emergency?” Urban Institute, March 9, 2022, https://www.urban.org/research/publication/what-will-happen-medicaid-enrollees-health-coverage-after-public-health-emergency.
[9] CBPP calculations using 2022 benchmark (second-lowest cost silver tier plan) premiums with age adjustments and pre-Rescue Plan contribution percentages. Examples are not projections but rather illustrate the magnitude of the shift in costs that typical individuals and families under these scenarios would experience if the premium tax credit enhancements expire. Actual costs will be determined by future premiums, contribution percentages, and other unknown factors. These national estimates are applicable in all states except for a small number that have state-specific poverty levels and/or provide additional premium subsidies. The family of four includes two 40-year-old parents, a 10-year-old, and a 5-year-old. See Appendix Table 2 for state-specific estimates.
[10] Centers for Medicare and Medicaid Services (CMS), “2022 Open Enrollment Report,” https://www.cms.gov/files/document/health-insurance-exchanges-2022-open-enrollment-report-final.pdf.
[11] Kaiser Family Foundation, Marketplace Average Benchmark Premiums, https://www.kff.org/health-reform/state-indicator/marketplace-average-benchmark-premiums/?currentTimeframe=0&sortModel=%7B%22colId%22:%22Location%22,%22sort%22:%22asc%22%7D. The ACA establishes metal tiers — bronze, silver, gold, and platinum — to organize plans for consumers and set standards for what deductibles and other charges insurers can include. See CBPP, “Cost-Sharing Charges in Marketplace Plans, Answers to Frequently Asked Questions,” updated August 2020, http://www.healthreformbeyondthebasics.org/cost-sharing-charges-in-marketplace-health-insurance-plans-answers-to-frequently-asked-questions/.
[12] CBPP calculations using 2022 West Virginia and Wyoming average benchmark premiums with age adjustments and pre-Rescue Plan contribution percentages. These estimates illustrate the cost increases that typical individuals and families under these scenarios would face if the premium tax credit enhancements expire. Actual costs will be determined by future premiums, contribution percentages, and other unknown factors. The family of four includes two 40-year-old parents, a 10-year-old, and a 5-year-old. See Appendix Table 2 for estimates including all states.
More from the Authors