

Have Domestic Appropriations Exploded?
Claims of Runaway Costs Not Supported by the Data; Growth in Defense Funding Far Outpaces Domestic Funding GrowthSummary
As Congress seeks to complete action on appropriations bills for fiscal year 2006, many Members of Congress seem to be laboring under the impression that appropriations for domestic programs have exploded in recent years. This impression appears to stem, in part, from several releases issued by conservative groups charging that the federal government has been on a “spending spree.”
For example, a recent Heritage Foundation brief contends that expenditures for discretionary (i.e., appropriated) programs increased 48 percent between 2001 and 2005[1] and that domestic programs, rather than defense and anti-terrorism spending, have been the main culprit. A memorandum by G. William Hoagland, the respected senior budget staffer for Senate Majority Leader Bill Frist and a former Republican staff director of the Senate Budget Committee, addressed the Heritage contentions. The Hoagland memorandum showed that federal spending as a share of the economy is below its average level for both the 1980s and 1990s and that most of the recent budget growth has occurred in defense and related security programs, rather than domestic programs.[2]
Where does the true story lie? Have appropriations for domestic programs exploded since 2001? This analysis examines the data.
Budget Data Do Not Support Claims of Runaway Domestic Appropriations Growth
Analysts generally believe that the best measure of the size and burden of the federal government is the magnitude of the federal budget measured as a share of the economy. When the budget remains steady as a share of the economy, deficit and debt burdens do not rise, and no increase in tax rates is required.[3] Accordingly, the Hoagland memorandum relies upon this measure.
Table 1: | |||
| Defense and related security programs | Domestic discretionary programs | All discretionary programs | |
| Total increase in funding | 64% | 23% | 44% |
| Increase, after adjustment for inflation and population growth | 44% | 8% | 26% |
| Increase as a share of GDP | +1.2% of GDP | No Change | +1.2% of GDP |
| Average annual growth rate, with adjustment for inflation and population growth | 9.5% per year | 1.9% per year | 5.9% per year |
- Total appropriations for discretionary programs, including both defense and domestic programs, rose from 6.8 percent of the Gross Domestic Product (the basic measure of the size of the economy) in 2001 to 8.0 percent of GDP in 2005.
- All of this growth came in defense and related security areas. Overall funding for defense, homeland security, and international affairs (which includes funding for post-war operations and reconstruction in Iraq and Afghanistan) rose from 3.4 percent of GDP in 2001 to 4.6 percent of GDP in 2005. Funding for domestic discretionary programs, by contrast, remained unchanged,at slightly less than 3.4 percent of GDP in both 2001 and 2005. In other words, measured as a share of the economy, funding for domestic discretionary programs was no higher in 2005 than in 2001.
An examination of the growth rates for defense and domestic discretionary programs tells much the same story. Funding for defense and related security programs has grown far more rapidly than funding for domestic programs. (Growth rates are measured here taking inflation and changes in the size of the U.S. population into account; see the box on page 3.)
- Funding for defense, homeland security, and international programs grew at an average annual rate of 9.5 percent per U.S. resident between 2001 and 2005, after adjusting for inflation.
- By contrast, funding for domestic discretionary programs rose at an average annual rate of 1.9 percent per U.S. resident from 2001 to 2005, after adjustment for inflation.
The picture also remains unchanged if one examines cumulative budget growth between 2001 and 2005, rather than annual growth rates.
- Total funding for defense and related security programs climbed a total of 44 percent between 2001 and 2005 in real per capita terms (i.e., after adjustment for inflation and growth in the U.S. population).
- Total funding for domestic programs rose 8 percent in real per capita terms.
In other words, funding for defense and security-related programs rose more than five times as fast as funding for domestic discretionary programs. Furthermore, what growth did occur in domestic discretionary programs came almost entirely between 2001, when large budget surpluses still were projected, and 2002. After that, when deficits returned, the growth essentially stopped. Funding for domestic discretionary programs actually declined as a share of the economy between 2002 and 2005.
CBO Data Indicate Tax Cuts and Defense-related Increases Have Been the Primary Factors Behind the Growth in the Deficit
To assess changes in the budget as a whole — and how changes in policies affecting the budget have contributed to the reemergence of deficits — one must look at changes in all parts of the budget, including revenues and entitlement programs. To do this, one can examine Congressional Budget Office analyses of the cost of all legislation enacted since the start of 2001, when budget surpluses were large.
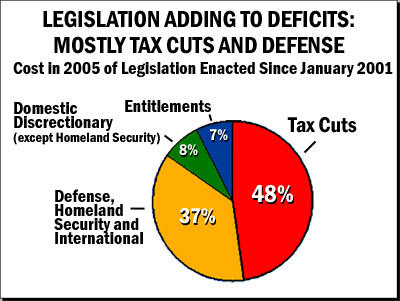
The CBO data show that the single largest factor (among factors that were caused by policymakers’ actions) in the slide from surpluses to deficits has been the tax cuts enacted in recent years. Increases in defense and security-related spending have been the second largest factor. Increases in domestic discretionary programs have played only a modest role.
- CBO estimates show that legislation enacted since the start of 2001 increased the deficit by $542 billion in 2005 alone, far in excess of the $319 billion deficit the government ran in 2005. Without such legislation, the budget would still be in surplus.
- The CBO data also show that 48 percentof this $542 billion in costs — or $260 billion — came from tax cuts. Some 37 percent of the cost came from legislated increases in defense and security costs.
- Increases in costs for domestic discretionary programs accounted for only 8 percent of the $542 billion in increased costs. (The remaining 7 percent of the increased costs is due to expansion of entitlement programs.)[4]
How Much Have Discretionary Programs Grown
The Heritage Foundation release referred to above notes that discretionary programs grew 48 percent between 2001 and 2005. This number is rather misleading, however. To derive it, Heritage failed to adjust for inflation (acting as though a dollar in 2005 were the same as a dollar in 2001) and used other problematic practices. This number also masks an enormous disparity between the growth in defense and security programs and the much smaller growth in domestic discretionary programs.
- Heritage’s 48 percent figure measures changes in total yearly expenditures for discretionary programs. This measure is not consistent with how federal budgeting is conducted. Congress appropriates funds for federal agencies to use, and the agencies spend this money on schedules that make sense for the programs they administer. When long-term contracts are involved, there can be a lag of several years or more between when funding is appropriated and when it is spent. For this reason, in examining trends in the decisions that particular Administrations or Congresses have made regarding discretionary programs, analysts generally examine changes in funding levels (i.e., appropriations) that occurred during the particular administration’s or Congress’ term, rather than the changes in expenditures.
Overall expenditures for appropriated programs increased by 48 percent from 2001 through 2005, as Heritage notes, but this partly reflects spending increases that were budgeted for in the final years of the previous decade (before the current Administration took office), at a time when large budget surpluses had emerged. Over the 2001-2005 period, funding for these programs increased by a slightly smaller amount, 44 percent.[5]
- This 44 percent figure needs to be adjusted, however, to take inflation into account. To get a meaningful sense of funding trends over time, one must adjust funding-level figures from different years for increases in prices, as the Congressional Budget Office does in its budget baseline. When an inflation adjustment in made, the 44 percent growth in total discretionary funding between 2001 and 2005 is seen to be an increase of 31 percent in real (i.e., inflation-adjusted) dollars.
- In undertaking analyses of this sort, adjustment for growth in the U.S. population also is necessary to produce the most meaningful results, as explained in the box below. Were government to remain static in the face of a growing population, either the proportion of the population receiving government services would have to fall every year or the benefits received by each person would have to be cut every year. Accordingly, to measure trends in funding levels over time, one should adjust for changes in the size of the population.
- When this is done, the overall increase in funding for discretionary programs from 2001 through 2005 — including both defense and domestic programs — is found to be 26 percent in real per-capita terms (i.e., after adjustment for inflation and population growth).
Defense Versus Domestic Discretionary Programs
Funding for discretionary programs thus grew 44 percent from 2001 to 2005 without adjustment for inflation or population growth and 26 percent with such an adjustment. These figures, however, mask large disparities between growth for defense and domestic programs.
- Funding for defense, homeland security, the reconstruction of New York City after 9-11, and international affairs (including post-war operations and reconstruction in Iraq and Afghanistan) grew a total of 64percent between 2001 and 2005, without adjustment for inflation and population growth, and 44 percent when such adjustments are made. (See Table 1)
- By contrast, funding for domestic appropriated programs grew 23 percent without adjustment for inflation and population growth and just 8 percent when those adjustments are made. As these figures indicate, funding growth for defense, homeland security, and international programs has been on a much more rapid upward trajectory than funding for domestic discretionary programs.
- It also is instructive to look at average annual growth rates. From 2001 to 2005, real per capita funding for defense and security programs rose at an annual average rate of 9.5 percent, while funding for domestic discretionary programs rose at an annual average rate of 1.9 percent.
- Moreover, the majority of the growth in funding for discretionary programs occurred between 2001, when large surpluses were still projected, and 2002. Since 2002, real per-capita funding for domestic discretionary programs has risen at an average annual rate of only 0.8 percent.
Funding for defense and security programs climbed at an annual average rate of 4.4 percent over this period.
Discretionary Programs as a Share of the Economy
The real per capita growth rate figures just cited show the degree to which funding for discretionary programs has simply kept pace with inflation and increases in the U.S. population, and the degree to which it has climbed faster than that. Real per capita growth rates do not, however, tell us whether government programs are growing faster than the economy as a whole and thus whether they are consuming a steadily increasing share of the national income. To determine that, we must examine changes in the federal budget as a share of the economy. When the budget absorbs a rapidly increasing share of the economy, it is growing at an unsustainable rate.
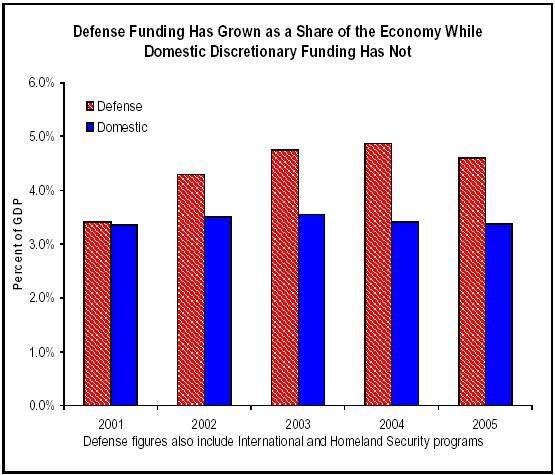
As reported earlier in this analysis, appropriations for domestic discretionary programs, measured as a share of the economy, have remained unchanged since 2001. All of the growth in discretionary programs as a share of GDP has come in defense and related security areas.
Appendix Table: * "Defense" includes discretionary amounts for international, homeland security, and NYC reconstruction. | |||
| Discretionary Programs | |||
| NOMINAL, in billions | Defense* | Domestic | Total |
| 2001 | $344 | $338 | $681 |
| 2002 | 446 | 364 | 809 |
| 2003 | 515 | 385 | 900 |
| 2004 | 562 | 394 | 956 |
| 2005 | 564 | 414 | 978 |
| % growth | 64% | 23% | 44% |
| avg annual % growth | 13.2% | 5.3% | 9.5% |
| avg annual % since 02 | 8.2% | 4.5% | 6.5% |
| ADJUSTED for CPI, in billions | |||
| 2001 | $377 | $370 | $747 |
| 2002 | 481 | 393 | 874 |
| 2003 | 543 | 406 | 949 |
| 2004 | 580 | 406 | 986 |
| 2005 | 564 | 414 | 978 |
| % growth | 50% | 12% | 31% |
| avg annual % growth | 10.6% | 2.9% | 7.0% |
| avg annual % since 02 | 5.4% | 1.8% | 3.8% |
| PER PERSON and adjusted for CPI, in dollars | |||
| 2001 | $1,324 | $1,300 | $2,624 |
| 2002 | 1,673 | 1,366 | 3,039 |
| 2003 | 1,871 | 1,398 | 3,269 |
| 2004 | 1,978 | 1,385 | 3,363 |
| 2005 | 1,905 | 1,400 | 3,305 |
| % growth | 44% | 8% | 26% |
| avg annual % growth | 9.5% | 1.9% | 5.9% |
| avg annual % since 02 | 4.4% | 0.8% | 2.8% |
| AS A PERCENT of GDP | |||
| 2001 | 3.42% | 3.36% | 6.78% |
| 2002 | 4.29% | 3.50% | 7.79% |
| 2003 | 4.75% | 3.55% | 8.30% |
| 2004 | 4.87% | 3.41% | 8.28% |
| 2005 | 4.59% | 3.38% | 7.97% |
| % point growth | 1.17% | 0.02% | 1.20% |
| avg annual percentage point growth | 0.29% | 0.01% | 0.30% |
| avg annual percentage point growth since 02 | 0.10% | -0.04% | 0.06% |
| Highlighted figures appear in our analysis. | |||
End Notes
[1]Brian M. Riedl, Federal Spending – By The Numbers, Heritage Foundation, October 7, 2005.
[2]G. William Hoagland, “Republicans and Fiscal Responsibility,” October 18, 2005.
[3] If, however, the existing deficit is so large that it causes the debt to grow faster than the economy, taxes must be raised or programs cut to get the deficit under control. Once that is done, the programs can continue to grow at the same pace as the economy with no need for further tax increases.
[4] CBPP calculations from data issued by CBO in August 2005. Both tax cuts and spending increases result in increases in the cost of interest payments on the debt, since they cause the debt to be larger than it otherwise would have been. The analysis provided here attributes these increased interest costs to the legislation that caused them. For example, the total cost of the tax cuts in 2005 is $260 billion, which consists of $225 billion in direct costs and $35 billion in increased interest payments.
[5] Funding data from 2001 through 2004 are from the Office of Management and Budget, Historical Tables, February 2005. Funding data for 2005 were supplied by CBO and accompanied The Budget and Economic Outlook: An Update, CBO, August, 2005. Funding for relief and reconstruction after Hurricane Katrina, enacted in September 2005, is not included in the figures used in this analysis. (In every other case, these figures cover all discretionary funding, whether “regular” or “emergency.”) Because the Heritage Foundation uses expenditure data rather than funding data and because expenditures for Katrina relief will occur almost entirely after fiscal year 2005 (which ended on September 30, 2005), the Heritage foundation analyses also exclude most Katrina-related costs. Finally, we adjust the OMB and CBO funding data to account for anomalies associated with transportation trust funds, advance appropriations, low-income housing, and the timing of the change in administrations. (Expenditure data do not require such adjustments.) The bases for these adjustments to the funding data are explained in the appendix to The Omnibus Appropriations Act: Are Appropriation For Domestic Programs Out of Control? CBPP, February 1, 2004.