By the end of 2014, the U.S. economy had experienced 58 consecutive months of job growth, and the unemployment rate had fallen to 5.6 percent from a high of 10 percent in October 2009. In fact, 2014 was by far the strongest year of the recovery, with job growth averaging over 246,000 per month, the highest monthly rate since before the recession. Economic growth also picked up, with gross domestic product rising at annual rates of 4.6 percent and 5 percent during the second and third quarters, respectively, following a first-quarter decline of 2.1 percent.
Last year’s solid job growth proved to be especially beneficial to communities of color, whose unemployment rates rose well above 10 percent during the worst years of the recession. In particular, after reaching a high of 16.8 percent in March 2010, the African American unemployment rate fell to 10.4 percent in December 2014. Between December 2013 and December 2014, African Americans had the largest increase in the share of adults with a job and the largest increase in their labor force participation rate,[1] translating to nearly 200,000 fewer unemployed black workers.
Despite this progress, the labor market is nowhere near a full recovery, much less full employment. For African American workers in particular, much is at stake in whether the economy is allowed to reach a full recovery and full employment, as evidence from the last four recoveries strongly suggests:
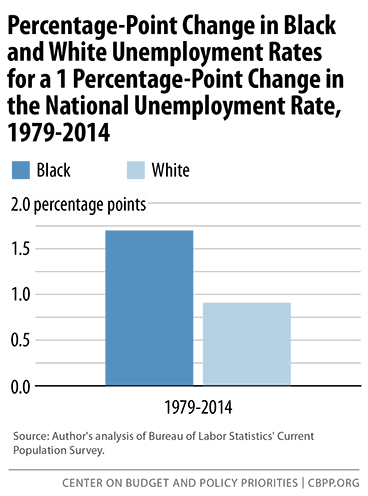
- On average, the black unemployment rate is more volatile with respect to aggregate labor market changes than the white rate. Between 1979 and 2014, the average annual black unemployment rate changed by 1.7 percentage points for every 1 percentage-point change in the national unemployment rate, compared to a change of 0.91 percentage points for whites.
- Wages of black workers are more responsive to aggregate labor market changes. Doubling the national unemployment rate is estimated to reduce real hourly wages by at least 8 percent for the median black worker compared to 3 percent for the median white worker.
In the five-year period between 1995 and 2000, during which the annual unemployment rate dropped to 4 percent:
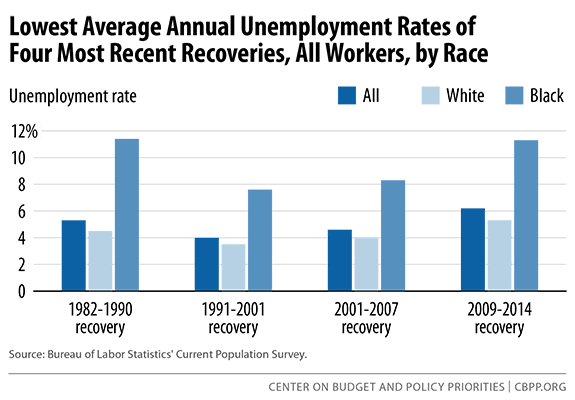
- The black unemployment rate fell to 7.6 percent, the lowest rate on record and the closest it has ever been to the white rate (within 4.1 percentage points) during a period of economic expansion.
- Real wage growth for African Americans narrowly exceeded that of whites, as median hourly wages of black workers grew by 2 percent per year compared to 1.7 percent per year for whites.
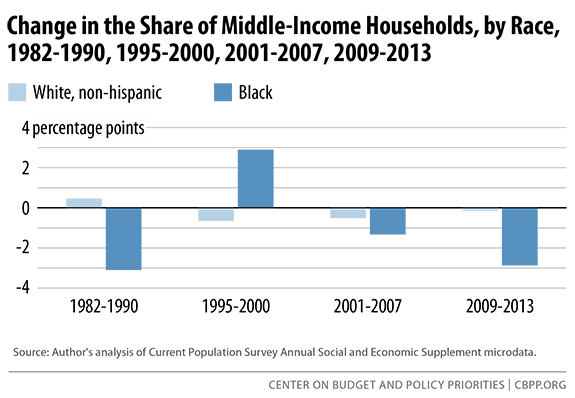
- The African American middle class expanded more than in periods of economic recovery when the economy was further from full employment. The share of African American households in the middle 60 percent of the income distribution increased 3 percentage points between 1995 and 2000, while it declined during the recoveries of the 1980s and the 2000s as well as during the current one.
- The fact that all of these positive developments occurred without setting off an inflationary spiral suggests that policymakers should be willing to experiment aggressively with low rates of unemployment in order to bring the benefits of a full recovery to African American households.
As the Recovery Builds Steam, Critical Labor Market Weaknesses Persist
The good news about the fall in the unemployment rate since its 2009 peak is tempered by the fact that labor force participation continued to decline sharply even after the recession officially ended. A better measure of labor market strength is the prime-age employment-to-population ratio (EPOP), which measures the share of adults between the ages of 25 and 54 who are working. The prime-age EPOP declined 4.8 percentage points between 2007 and 2010 (peak to trough), and the average for 2014 remained 3.2 percentage points below the pre-recession rate. The employment gap for prime-age African Americans is even wider: Having declined 8.1 percentage points between 2007 and 2011 (peak to trough), it remained 4.2 percentage points below the pre-recession rate.
Another key indicator of remaining slack in the labor market has been slow wage growth. Real wages have been essentially flat since 2009, and even with the recent drop in inflation wages in 2014 grew at a slightly slower pace than wages in 2013.[2] Wage growth is as an important signal of inflationary pressure that the Federal Reserve considers as it sets interest rate policy. But as Bivens and Gould point out, as long as nominal wages grow at or below the rate of productivity growth plus the Fed’s price inflation target, there is no risk that excess labor market tightness will push inflation above that target.[3] If this is the case, then with productivity growth averaging 1.5 to 2 percent and nominal wage growth sitting at 2 percent over the last year, wage growth could essentially double without putting any pressure on the Fed’s 2 percent price inflation target.
In spite of the gains in employment, for most workers slow and stagnant wage growth continues to challenge any sense of confidence about the economic recovery. History strongly suggests that full employment provides the best chance for American workers to experience wage and income growth. Baker and Bernstein show that incomes have grown faster and more equally when the economy was at or near full employment, notwithstanding other factors that influence wage growth.[4] They also show that lower-income and African American families suffer greater income losses during periods of slack labor markets and faster income growth when labor markets are tighter.
Federal Reserve Policy Looms Large Over Prospects for Full Employment and Wage Growth
The Federal Reserve’s monetary policy decisions have tremendous influence over economic growth and employment in the United States and across the world. The Great Recession tested the limits of this power, as the Federal Reserve took extraordinary actions to stabilize the financial sector, end the recession, and bring about economic recovery. At the beginning of 2015, near-zero interest rates are the last policy tool that the Fed continues to use to maximum effect to promote a full economic recovery. Still, the Fed is under pressure from monetary hawks to raise short-term interest rates as a guard against price and wage inflation.
The timing of the Fed’s decision to raise interest rates will be a deciding factor in how close the economy gets to full employment and, thus, how fast the wages of American workers will grow. Given the amplified relationship between labor market strength and African American income growth estimated by Baker and Bernstein,[5] the Fed’s decision also has major implications for how complete the recovery will be for African American workers. Evidence on today’s labor market suggests that it would be premature to slow the recovery in the name of staying ahead of any possible inflationary pressure. And the potential consequences of premature tightening are huge — years of foregone income and wage growth for precisely those American families that have disproportionately suffered over the past decade.
African Americans Experience Stronger Employment Gains When Labor Markets Are Tight
This paper examines how full employment, or the lack thereof, has affected African American employment and wages over the last four economic cycles. This examination argues that genuinely full employment has been much rarer than one might expect taking at face value estimates of the natural rate of unemployment (i.e., the NAIRU, the non-accelerating inflation rate of unemployment). The implication for policy is that we should be willing to experiment aggressively with low rates of unemployment.
The analysis begins by contrasting the economic recoveries following the 1981, 1991, 2001, and 2007 recessions with the five-year period between 1995 and 2000, when the unemployment rate dropped to its lowest level in generations—well below existing estimates of the NAIRU—and wages rose strongly across the wage distribution. I then estimate the statistical relationship between the unemployment rate and real wages for black and white workers since 1979.
Tables 1 and 2 present two basic indicators of labor market strength — the unemployment rate and the employment-population ratio — along with the changes in those indicators from the trough to the peak of the last four economic recoveries as well as from 1995 to 2000. These numbers are reported for all workers and for white and black workers separately. The first panel of each table summarizes conditions for the entire working-age population (age 16 and older), and the second panel includes only prime-age workers (age 25 to 54).
| TABLE 1 | |||||||
|---|---|---|---|---|---|---|---|
| Unemployment Rates for All Working-Age Adults and Prime-Age Workers During Last Four Recoveries, by Race | |||||||
|
All workers (age 16 or older)
|
Prime-age workers (age 25-54)
|
||||||
|
Unemployment rate (low)
|
Change (trough to peak)
|
Change (1995-2000)
|
Unemployment rate (low)
|
Change (trough to peak)
|
Change (1995-2000)
|
||
| 1982-1990 recovery |
All
|
5.3
|
-4.1
|
|
4.2
|
-3.3
|
|
|
White
|
4.5
|
-3.8
|
|
3.6
|
-3.0
|
|
|
|
Black
|
11.4
|
-7.5
|
|
9.0
|
-5.6
|
|
|
| 1991-2001 recovery |
All
|
4.0
|
-2.1
|
-1.. 6 |
3.1
|
-1.9
|
-1.4
|
|
White
|
3.5
|
-1.9
|
-1.4
|
2.7
|
-1.8
|
-1.2
|
|
|
Black
|
7.6
|
-3.9
|
-2.8
|
5.6
|
-3.6
|
-2.2
|
|
| 2001-2007 recovery |
All
|
4.6
|
-0.1
|
|
3.7
|
-0.1
|
|
|
White
|
4.0
|
-0.1
|
|
3.3
|
0.0
|
|
|
|
Black
|
8.3
|
-0.3
|
|
6.5
|
0.0
|
|
|
| 2009-2014 recovery |
All
|
6.2
|
-3.1
|
|
5.2
|
-3.1
|
|
|
White
|
5.3
|
-3.2
|
|
4.5
|
-3.1
|
|
|
|
Black
|
11.3
|
-3.5
|
|
9.5
|
-3.5
|
|
|
| Source: Author's analysis of Bureau of Labor Statistics' Current Population Survey. | |||||||
| TABLE 2 | |||||||
|---|---|---|---|---|---|---|---|
| Employment-Population (EPOP) Ratios for All Working-Age Adults and Prime-Age Workers During Last Four Recoveries, by Race | |||||||
| All workers (age 16 or older) | Prime-age workers (age 25-54) | ||||||
|
|
Employment-population ratio (high)
|
Change (trough to peak)
|
Change (1995-2000)
|
Employment-population ratio (high)
|
Change (trough to peak) | Change (1995-2000) | |
| 1982-1990 recovery |
All
|
63
|
5.0
|
|
79.9
|
6.2
|
|
|
White
|
63.8
|
4.9
|
|
|
|
|
|
|
Black
|
56.9
|
7.3
|
|
|
|
|
|
| 1991-2001 recovery |
All
|
64.4
|
2.0
|
1.5
|
81.5
|
0.3
|
0.5
|
|
White
|
64.9
|
1.6
|
1.1
|
82.4
|
|
0.2
|
|
|
Black
|
60.9
|
4.3
|
3.8
|
77.2
|
|
4.2
|
|
| 2001-2007 recovery |
All
|
63.7
|
-0.7
|
|
83.7
|
-0.6
|
|
|
White
|
64.2
|
-0.6
|
|
84.4
|
-0.7
|
|
|
|
Black
|
59.7
|
-1.3
|
|
75.5
|
-0.7
|
|
|
| 2009-2014 recovery |
All
|
59.3
|
-2.5
|
|
76.7
|
0.9
|
|
|
White
|
60.2
|
-2.7
|
|
78.1
|
1.0
|
|
|
|
Black
|
54.3
|
-1.2
|
|
70.6
|
1.8
|
|
|
| Source: Author's analysis of Bureau of Labor Statistics' Current Population Survey; note that EPOP ratios by race available only for 1994 and later. | |||||||
Looking across the four periods of recovery, it is clear that the 1990s recovery produced the strongest labor market in recent history. The overall unemployment rate reached a low of 4 percent on an annual basis, and the lowest rates for whites and blacks were 3.5 percent and 7.6 percent, respectively. (See Figure 1.) Although the roughly 2-to-1 black-white unemployment-rate ratio held across each of the economic recoveries, the black unemployment rate was closest to the white rate (within 4.1 percentage points) during the 1990s. Moreover, the lowest annual black unemployment rate of the 1990s was nearly 4 percentage points lower than the low of the 1980s and the low of the current recovery. For white workers, the difference between the 1990s and other periods was less dramatic: The lowest annual white unemployment rate of the 1990s was only 1 percentage point below the low of the 1980s and 1.8 percentage points below the most recent low. Though unemployment rates were relatively low during the post-2001 recovery, their level was due more to an extension of the gains of the late 1990s, and a relatively mild recession, than to a particularly strong labor market recovery. In fact, in terms of simple rates of job growth, the recovery following the 2001 recession remains the worst post-World War II recovery on record; unemployment rates barely changed between the trough and peak. Further, wage-growth trends seemed to retain their momentum from the late 1990s recovery into the 2001 recession. Wages for most workers rose until 2002 or even 2003 before reversing as the recovery matured (an odd historical pattern).
For prime-age workers, labor market outcomes were even better during the 1990s than they were for workers overall. Prime-age workers typically have the most consistent labor market attachment because they are less likely to voluntarily leave the labor market to enroll in school or retire. In the right-hand panel of Table 2 we see that, during the 1990s, up to 81.5 percent of all people between the ages of 25 and 54 were employed. The peak rate for whites, at 82.4 percent, was 4.3 percentage points higher than in the current recovery, and the peak rate for blacks, 77.2 percent, was 6.6 points higher.
The Bureau of Labor Statistics (BLS) does not report prime-age EPOP ratios by race for years prior to 1994. However, we can glean the story by comparing prime-age unemployment rates of blacks and whites and get an idea of how well this core group of African American workers fared during the late 1990s. While the unemployment rate for African American workers age 16 or older reached a low of 7.6 percent during the 1990s recovery, the rate for prime-age African American workers fell to 5.6 percent (see the left and right panels of Table 1). The latter was 3.4 percentage points below the low of the 1980s recovery and 3.9 points below the low of the current recovery. By focusing on the segment of the workforce with the strongest labor market attachment, we get a sense of just how important full employment is to bringing down the black unemployment rate. Since BLS began reporting black unemployment rates in 1972, 2000 was the only year the annual rate for African American workers age 16 or older was less than 8 percent. The rate for prime-age African American workers has been less than 6 percent in only three years, two of which occurred during the 1990s recovery — 1973 (5.7 percent), 1999 (5.9 percent), and 2000 (5.6 percent).
In addition to historically high black employment during the 1995–2000 period of full employment, another important point to draw from Table 1 is the fact that blacks experienced relatively larger labor market gains than whites during the 1990s recovery. While the black unemployment rate declined by twice as much as the white rate during both the 1980s and 1990s recoveries, the larger absolute change in unemployment rates during the 1980s should be evaluated within the context of the depth of the preceding recession, a downturn that, prior to the 2007 recession, held the distinction as the worst on record since the Great Depression. However, relative changes in employment, as measured by the EPOP, were much higher for blacks than whites in the 1990s recovery than in the 1980s. During the 1980s recovery, employment of black working-age adults increased 1.5 times more than it did for whites (7.3 versus 4.9 percentage points). During the 1990s, the increase for blacks was 2.7 times greater (4.3 versus 1.6 percentage points).
The discussion so far has focused on labor market outcomes for prime-age workers who typically have stronger labor force attachments. The relative strength of the labor market over different periods of recovery can be further underscored by gains among teens and young adults, groups that traditionally have weaker labor market attachments or face greater barriers to employment. Beginning in 1994, BLS began reporting alternative measures of labor utilization that are useful for assessing the strength of the labor market. One of those measures, commonly referred to as underemployment, accounts for people officially classified as unemployed but also for marginally attached workers and people working part time for economic reasons. Marginally attached workers are people who searched for work in the past 12 months (though not the most recent four weeks) and are willing and available to take a job. Those working part time for economic reasons are people who would prefer full-time employment if it were available.
Table 3 presents changes in unemployment, underemployment, and EPOP ratios for the last three recoveries and for 1995–2000 specifically for workers age 16-24. Underemployment for all young workers fell to a much lower rate (14.4 percent) during the 1990s than it has during the current recovery (22.8 percent). For young African American workers, the underemployment rate reached a low of 24.9 percent during the 1990s, compared to 32.3 percent in the current recovery. Comparing the change in the unemployment rate over the entire 1990s recovery to the change from 1995 to 2000, we see that all the improvement in this group’s unemployment rate took place during the 1995–2000 part of that recovery, during which the overall unemployment rate was below 5 percent for four of the five years. Similarly, the share of all 16-24-year-olds who were employed peaked at 59.7 percent in 2000 but has declined steadily since then. While school enrollment has been trending upward over the last two decades, it does not explain the decline in employment for this group: Enrollment rates haven’t increased any faster since 2000 than they did between 1995 and 2000, and in fact they have plummeted since 2012.[6] Rather, tighter labor markets in the mid- to late-1990s served to effectively expand job opportunities for young job seekers who traditionally face greater barriers to employment.
| TABLE 3 | |||||||||||
|---|---|---|---|---|---|---|---|---|---|---|---|
| Labor Market Outcomes for 16-24-Year-Olds During Last Three Recoveries, by Race | |||||||||||
|
|
Unemployment rate
|
Underemployment rate
|
Employment-population ratio
|
||||||||
|
|
Low
|
Change (trough to peak)
|
Change (1995-2000)
|
Low
|
Change (trough to peak)
|
Change (1995-2000)
|
High
|
Change (trough to peak)
|
Change (1995-2000)
|
||
| 1991-2001 recovery |
All
|
9.3
|
-2.8
|
-2.8
|
14.4
|
|
-4.6
|
59.7
|
0.5
|
1.4
|
|
|
White
|
7.9
|
-2.7
|
-2.3
|
9.6
|
|
-4.2
|
|
|
|
||
|
Black
|
18.1
|
-5.6
|
-5.8
|
24.9
|
|
-7.8
|
|
|
|
||
| 2001-2007 recovery |
All
|
10.5
|
-0.1
|
|
16.1
|
0.4
|
|
57.7
|
-4.6
|
|
|
|
White
|
9
|
0.2
|
|
10.9
|
0.6
|
|
|
|
|
||
|
Black
|
19.3
|
-1.1
|
|
26.2
|
-1.3
|
|
|
|
|
||
| 2009-2014 recovery |
All
|
13.4
|
-4.2
|
|
22.8
|
-3.6
|
|
47.6
|
0.7
|
|
|
|
White
|
11.3
|
-4.4
|
|
15.2
|
-3.5
|
|
|
|
|
||
|
Black
|
23.1
|
-5.7
|
|
32.3
|
-4.6
|
|
|
|
|
||
| Source: Author's analysis of Bureau of Labor Statistics' Current Population Survey; note that the series for the underemployment rate (U6 measure of labor underutilization) began in 1994. | |||||||||||
This examination carries an important lesson: Premature interest-rate tightening in the mid-1990s would have robbed millions of the most disadvantaged workers of a half-decade of historically fast job growth. And to be clear —many in the mid-1990s argued precisely that unemployment should not be allowed to get much below the 5.6 percent rate that prevailed at the beginning of 1996, as pushing it below this level, they believed, would surely set off accelerating inflation. Four years later, overall unemployment averaged 4 percent for two solid years, and accelerating price inflation never arrived.
The evidence presented in this section shows that, on average, the black unemployment rate is more volatile with respect to aggregate labor market changes. Between 1979 and 2014, the average annual black unemployment rate changed an average of 1.7 percentage points for every 1 percentage-point change in the national unemployment rate (see Figure 2); the corresponding figure for whites was 0.91. In short, the stakes of effective macroeconomic stabilization policy are extraordinarily high for African American employment. African American families suffer disproportionately from labor market downturns and reap disproportionate gains during recoveries. Given the vast suffering inflicted by the Great Recession, and given the slow job growth of the early phase of recovery, it would be a tragedy to deny the gains that could be achieved should the economy be allowed to reach a full recovery, and even full employment.
The distinction between a full recovery and full employment is an important one. A full recovery would simply mean a return to pre-Great Recession labor market conditions without any regard to how good or bad those conditions were. Full employment, on the other hand, raises the bar to a point at which all who are willing to work at the prevailing wage rate are employed. Another way of thinking about full employment is as the point at which all unemployment is “frictional,” i.e., consists of people searching for the best job fit.
African Americans Experience Stronger Growth in Income and Hours Worked When Labor Markets Are Tight
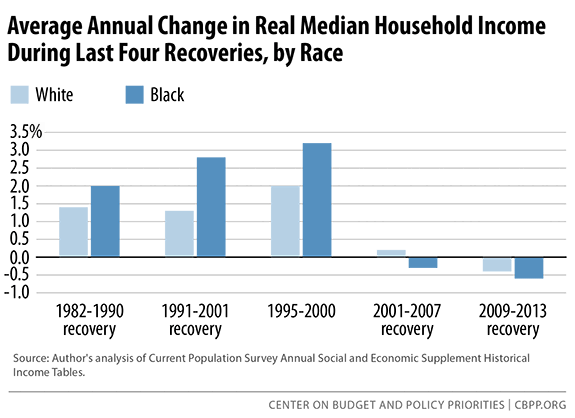
Thus far, our analysis has focused primarily on differences in employment outcomes across each of the last four economic recoveries. Since most Americans derive the large majority of their income from working, increased employment is also associated with increased income. Figure 3 shows how income increased more for African American households[7] than for white households during the recoveries that followed the 1981 and 1991 recessions, but also declined more during the recoveries from the 2001 and 2007 recessions. Household labor income can increase because household members work more hours, because hourly wages increase, or both. As Table 4 shows, in all periods when median household income for African Americans increased more than that for whites (1982-1990, 1991-2001, and 1995-2000), African American households also experienced a greater increase in hours worked than did white households, especially if the households had lower incomes.
| TABLE 4 | ||||||
|---|---|---|---|---|---|---|
| Percent Change in Total Household Hours Worked During 1980s and 1990s Recoveries, by Income Quintile and Race | ||||||
|
1982-1990
|
1991-2001
|
1995-2000
|
||||
| Income quintile |
White
|
Black
|
White
|
Black
|
White
|
Black
|
| All |
6.8%
|
10.9%
|
0.1%
|
7.5%
|
0.0%
|
6.4%
|
| 1st fifth |
-3.1%
|
32.7%
|
-7.0%
|
22.0%
|
1.8%
|
18.6%
|
| 2nd fifth |
9.6%
|
11.3%
|
-1.0%
|
4.5%
|
2.9%
|
6.0%
|
| 3rd fifth |
7.5%
|
11.8%
|
0.9%
|
-2.8%
|
0.9%
|
-1.0%
|
| 4th fifth |
8.6%
|
3.8%
|
2.6%
|
0.0%
|
1.4%
|
3.7%
|
| 5th fifth |
4.4%
|
0.8%
|
-1.0%
|
-0.4%
|
-0.6%
|
0.9%
|
| Source: Author's analysis of Current Population Survey microdata. | ||||||
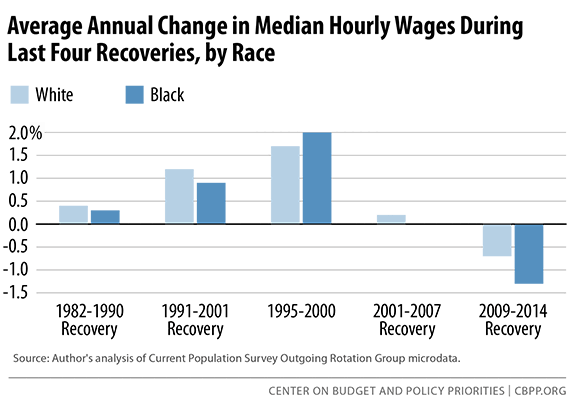
Trends in annual median wage growth show that inflation-adjusted median wages for all workers grew by less than 0.5 percent per year during the 1982–1990 recovery but grew by about 1 percent per year during the recovery of 1991–2001. (See Figure 4.) Real median hourly wage growth for African Americans narrowly exceeded that of whites between 1995 and 2000; median wages for black workers grew by 2 percent per year compared to 1.7 percent per year for whites. The combination of increased hours of work and higher annual wage growth for low-income families during the late 1990s recovery had the added benefit of shifting more African American households into the broad middle class, defined here as the middle 60 percent of the income distribution. Between 1995 and 2000 the share of African American households in the middle 60 percent of the income distribution grew by nearly 3 percentage points, while the share of white middle-income households declined by just under 1 percentage point. (See Figure 5.) This expansion of the black middle class was unique to this period of economic growth. During each of the other recoveries, the share of black households in the middle 60 percent actually declined.
The Role of Full Employment in Driving Wage Growth of Black and White Workers
The preceding sections of this report presented evidence on broad trends in employment, income, hours worked, and wages over the last four economic recoveries in order to demonstrate the importance of full employment in promoting greater employment and wage growth for all workers and for African Americans in particular. Next, I use regression analysis to formalize the relationship between the unemployment rate and real hourly wages of white and black workers. This exercise is an extension of the original Phillips curve, which posited a negative relationship between the unemployment rate and nominal wage growth.[8] The acceleration of inflation in the 1970s led many macroeconomists to assert that low rates of unemployment did not just lead to higher rates of wage growth but also to accelerating rates of wage growth that could lead to spiraling price inflation. The lowest level of unemployment consistent with stable wage (and hence price) inflation was labeled the NAIRU, and an entire industry of economists sprung up trying to provide policy-relevant ex ante estimates of it.
The experience of the late 1990s showed that these ex ante NAIRU estimates were too conservative, but it is the only period since 1979 in which policymakers pushed actual unemployment rates down anywhere near these too-conservative targets. As others have shown, trends in real wage growth, productivity growth, and full employment since 1979 suggest that sustained periods of unemployment above official estimates of the NAIRU have been at least one of the factors working to suppress real wages. Bivens et al. show that wages generally kept pace with productivity during most of the post-World War II era, but starting in 1979 this relationship started to diverge.[9] One of several factors contributing to the weakening of this relationship for most earners has been the failure to pursue full-employment policies. According to Baker and Bernstein, the unemployment rate was an accumulated 31 percentage points above official estimates of the NAIRU for the years 1980 to 2012, compared to an accumulated 15 percentage points below this measured NAIRU from 1949 to 1979.[10]
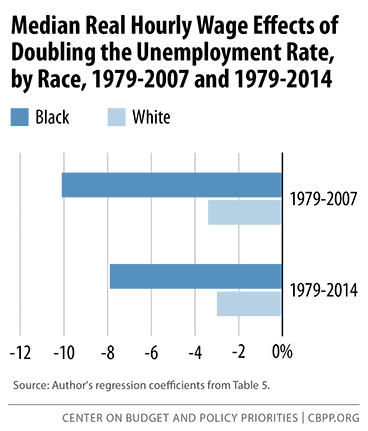
At the median, wage growth of black workers has been more responsive to changes in labor market slack than wage growth of white workers. (See Figure 6.) This relationship held for the entire period between 1979 and 2014 as well as between 1979 and 2007, a period that excludes the effects of the Great Recession and subsequent recovery. These results are based on annual state-level real median hourly wages for whites and blacks and state unemployment rates. (Under this specification, individual state and year “dummy variables” are included to control for any effects on wages, other than unemployment, that might be unique to a particular state or year.)
Row 1 of Table 5 shows in statistical terms that a doubling of the state unemployment rate reduced median real hourly wages by 7.9 percent for blacks and 3.0 percent for whites between 1979 and 2014. In the period before the Great Recession, a doubling of the state unemployment rate reduced real median hourly wages by 10.1 percent for blacks and 3.4 percent for whites. The lower estimates for the period including the Great Recession are consistent with the concept of downward nominal wage rigidities.[11] With inflation relatively low and employers reluctant to cut the dollar value of workers’ pay during tough economic times, real wages have been less responsive to changes in the unemployment rate than in the years preceding the Great Recession. Estimates of wage responsiveness to changes in the EPOP and the underemployment rate reveal similar patterns through 2007, with the median real hourly wage of black workers changing more than the wage of white workers in response to fluctuations in the labor market.
| TABLE 5 | ||||||||||||
|---|---|---|---|---|---|---|---|---|---|---|---|---|
| Estimated State Median Real Wage Elasticities With Respect to Unemployment Rate, Employment-Population Ratio, and Underemployment Rate, by Race, 1979-2014 and 1979-2007* | ||||||||||||
| Unemployment rate | Employment-population ratio | Underemployment (1994-2014 only) | ||||||||||
|
1979-2014
|
1979-2007
|
1979-2014
|
1979-2007
|
1994-2014
|
1994-2007
|
|||||||
|
White
|
Black
|
White
|
Black
|
White
|
Black
|
White
|
Black
|
White
|
Black
|
White
|
Black
|
|
| Real median wage |
-0.030
|
-0.079
|
-0.034
|
-0.101
|
0.348
|
0.264
|
0.303
|
0.491
|
-0.090
|
-0.082
|
-0.069
|
-0.108
|
| Standard error |
0.007
|
0.020
|
0.008
|
0.024
|
0.043
|
0.141
|
0.052
|
0.183
|
0.007
|
0.023
|
0.008
|
0.032
|
| Number of states |
51
|
25
|
51
|
25
|
51
|
25
|
51
|
25
|
51
|
25
|
51
|
25
|
| N |
1785
|
476
|
1479
|
345
|
1785
|
476
|
1479
|
345
|
1020
|
330
|
714
|
179
|
| Real median wage (AZ, CA, FL, IL, NJ, NM, NY & TX only) |
-0.045
|
-0.103
|
-0.058
|
-0.114
|
0.301
|
0.360
|
0.356
|
0.634
|
-0.041
|
-0.068
|
-0.027
|
-0.079
|
| Standard error |
0.018
|
0.026
|
0.021
|
0.029
|
0.131
|
0.194
|
0.152
|
0.211
|
0.025
|
0.038
|
0.039
|
0.052
|
| Number of states |
8
|
8
|
8
|
8
|
8
|
8
|
8
|
8
|
8
|
8
|
8
|
8
|
| N |
280
|
276
|
232
|
230
|
280
|
276
|
232
|
230
|
160
|
158
|
112
|
112
|
| *Labor market variables are lagged 1 year. Note: Coefficients in bold are significant at 5% level. Source: Author's regression analysis of state unemployment and wage data from Current Population Survey. |
||||||||||||
Because population size restricts the number of states and years for which reliable median wage estimates are available for African Americans, the above analysis includes fewer observations for black workers than for whites. The estimates in row 5 of Table 5 are based on the subsample of eight states for which a full panel of median wage data for African Americans is available.[12] Again, the effect of changes in the unemployment rate on median wage growth is roughly twice as large for African American workers as it is for whites.
Conclusion
This paper presents a case for the role of full employment in helping to reduce racial disparities in unemployment and wages. On average, African American families suffer disproportionately from labor market downturns, but they also reap disproportionate gains during recoveries. These labor market fluctuations affect employment levels as well as wage growth, the primary means by which the majority of families maintain and improve their standard of living.
Based on evidence from the economic recoveries following the 1981, 1991, 2001, and 2007 recessions, this examination argues that genuinely full employment has been much rarer than one might expect taking estimates of the NAIRU at face value. But in the five-year period between 1995 and 2000, during which the annual unemployment rate dropped to 4 percent, the difference between the black and white unemployment rates was smaller than it’s ever been — within 4.1 percentage points — during an economic expansion; real median hourly wage growth for African Americans narrowly exceeded that of whites; and the African American middle class expanded. Further, all of this happened without causing price inflation to accelerate or even increase.
Given the vast suffering caused by the Great Recession and the slow job growth of the early phase of recovery, much is at stake for African American families in whether the economy is allowed to reach a full recovery and full employment. Based on evidence over the past year as well as the estimates presented in this report, a 1 percentage-point decline in the national unemployment rate means that roughly 200,000 fewer African American workers will be unemployed.[13] From a policy perspective, this likely outcome strongly suggests that we should experiment aggressively with low rates of unemployment.
End Notes
[1] Valerie Wilson, “Keep the Jobs Coming! People of Color Have Actually Benefited More From Job Growth This Year,” Working Economics (Economic Policy Institute blog), November 7, 2014, http://www.epi.org/blog/keep-the-jobs-coming-people-of-color-have-actually-benefited-more-from-job-growth-this-year/; Valerie Wilson, “Single Digit Black Unemployment May Not Be so Far Away,” Working Economics (Economic Policy Institute blog), January 9, 2015, http://www.epi.org/blog/single-digit-black-unemployment-may-not-be-so-far-away/.
[2] Elise Gould, “Average Real Hourly Wage Growth in 2014 Was No Better Than 2013,” Working Economics (Economic Policy Institute blog), January 16, 2015, http://www.epi.org/blog/average-real-hourly-wage-growth-in-2014-was-no-better-than-2013/.
[3] Josh Bivens and Elise Gould, “What to Watch on Jobs Day: It’s No Longer a Jobless Recovery but It’s Undoubtedly a Wage-Growth-Less Recovery,” Working Economics (Economic Policy Institute blog), September 4, 2014, http://www.epi.org/blog/watch-jobs-day-longer-jobless-recovery-undoubtedly/.
[4] Dean Baker and Jared Bernstein, Getting Back to Full Employment: A Better Bargain for Working People (Washington, DC: Center for Economic Policy Research, 2013), http://www.cepr.net/documents/Getting-Back-to-Full-Employment_20131118.pdf.
[5] Ibid.
[6] Heidi Shierholz, Alyssa Davis, and Will Kimball, “Class of 2014: The Weak Economy Is Idling Too Many Young Graduates,”Economic Policy Institute, Briefing Paper #377, http://www.epi.org/publication/class-of-2014/.
[7] The race of the household is based on the race of the household head.
[8] Alban Phillips, “The Relation Between Unemployment and the Rate of Change of Money Wages in the United Kingdom, 1861-1957,” Economica (25, 1958), pp. 283-99.
[9] Josh Bivens, Elise Gould, Lawrence Mishel, and Heidi Shierholz, “Raising America’s Pay: Why It’s Our Central Economic Policy Challenge,” Economic Policy Institute, Briefing Paper #378.
[10] Baker and Bernstein 2013.
[11] Mary C. Daly and Bart Hobijn, “Downward Nominal Wage Rigidities Bend the Phillips Curve,” Federal Reserve Bank of San Francisco, Working Paper 2013-08, http://www.frbsf.org/publications/economics/papers/2013/wp2013-08.pdf.
[12] African American wage rates are missing in 1980 for Arizona and New Mexico, but since excluding these states did not change the results, there were included to maximize the number of observations.
[13] This estimate assumes a continuation of trends in black labor force participation and unemployment over the last year (from December 2013 to December 2014). The black labor force grew by 3.4 percent over the year.