Introduction
The benefits to running a hot labor market continue to be evident both in the data and in anecdotal accounts. In our last paper, we examined the monetary policy rationale for allowing high-pressure labor markets to continue to flourish.[2] We also focused on the benefits of persistently low unemployment to lower-income workers, through both higher real pay and more hours of work. In this short paper, we turn back to this evidence, with a closer focus on the benefits of high-pressure labor markets to the labor supply of lower-paid workers.
The most basic labor market theories generally lack the necessary nuance to shed much light on this question. The textbook 101 model assumes full employment and an equilibrium wage where employers’ demands and undifferentiated workers’ supply perfectly match. A wage set too high will lead to more job seekers than jobs; a wage set too low will cause the opposite problem: too few workers willing to fill available slots. In the real world, however, there are of course periods of slack labor markets, along with factors such as racial and gender discrimination. Some particularly disadvantaged workers may face uniquely high barriers to labor market entry. Also, recent research has identified large sectors in our economy, like retail, tech, and health care, where few employers dominate. In such markets, employers can become wage makers, not wage takers, i.e., they can use their dominance to set wages below the theoretical equilibrium.
In this note, we ask a simple, specific question related to this more realistic version of the labor market: do low-wage workers respond to high-pressure labor markets by increasing their labor supply? What evidence is there that tight job markets pull in such workers?
We find highly cyclical responses to both the extensive and intensive margins of labor supply for low-income, prime-age persons, especially for first-quintile African Americans and for women. A simple decomposition finds, for example, that the earnings of low-income Black people increased by more than 70 percent in the high-pressure labor market of the 1990s, with gains in their share working (extensive margin) explaining more than half of the increase. Conversely, under low-pressure conditions, the decline in working shares is the dominant force behind sharp income losses for these groups of people. We also find that the two labor supply margins — extensive and intensive, or share working and annual hours among incumbent workers — were particularly important for low- and middle-income women. Over the full period we analyze — 1975-2018 — the gains in the gender gap as measured by changes in relative annual earnings (women’s to men’s) were largely due to women’s relative gains along these supply margins. We offer policy implications of these findings on both macro and micro levels.
Previous Literature
Arthur Okun is widely credited with pioneering research into the benefits of very low unemployment for marginalized groups. In the context of a “high-pressure economy” he hypothesized that employers are more likely to lower formal hiring standards in order to fill vacancies, and that this would benefit less-advantaged job seekers in the labor market.[3] In a 1973 paper Okun found that in such periods, women and teenagers experienced disproportionately large increases in employment. Since this initial confirmation of a rather straightforward hypothesis, many studies have reinforced this finding. The uniquely strong economy in the late 1990s prompted a body of work evaluating the impacts of these conditions. Roberts and Rodgers examined the impacts of low unemployment on earnings and employment in metro labor markets and found that less-educated men, and young African American men in particular, experienced the greatest improvements.[4]
Similarly, Wilson explored the positive impacts of strong economic growth in the late 1990s on both the employment and earnings of African American people.[5] Katz and Krueger found that the tight labor market of the late 1990s contributed to a significant increase in the both the incomes of lower-income families and falling poverty rates in those years.[6] Jargowsky’s research captured a 24 percent decline in the number of people living in high-poverty neighborhoods, census tracts where 40 percent or more of residents are in poverty, between 1990 and 2000.[7] This study found that the strong economy reduced the concentration of poverty for all racial and ethnic groups, but had a particularly pronounced effect on African American communities. The share of poor African American people living in high-poverty neighborhoods fell from 30 percent in 1990 to 19 percent in 2000. Such impacts have informed William J. Wilson’s assertion that the “ideal solution” to addressing a root cause of concentrated poverty, inner-city joblessness, “would be economic policies that produce tight labor markets.”[8]
The specific findings of greater cyclical variation in wages, employment, and labor market participation for economically vulnerable groups have been widely documented. Hoynes found this to be the case for the employment and earnings of less educated workers, people of color, and women with lower skill levels. All experienced more variation over the course of the business cycle relative to higher-skilled men, a finding that was particularly pronounced in the context of one’s probability of being employed full-time year round.[9] Jefferson found that trends in the employment-to-population ratio for workers with less education are substantially more volatile compared to those with more educated workers.[10] And more recent research, including that which examines the current strong economy, has only further bolstered these findings. For example, Aaronson et al. state that their research
reaffirm[s] the earlier finding of other authors that the labor market outcomes of blacks, Hispanics, and those with less education are more cyclically sensitive than the outcomes of whites and those with more education.[11]
And consistent with the work of Roberts and Rodgers, they find that cyclical variability in labor market outcomes is particularly pronounced for young African American workers. Further, Aaronson et al. find suggestive evidence that further strengthening in the context of an already very strong economy is particularly beneficial to some disadvantaged groups.
The flip side of higher cyclical variability is that recessions hit low-wage workers and members of marginalized groups particularly hard. Decreases in earnings and employment during recessions are consistently disproportionately larger for low-wage earners, people of color, and low-income female-headed households.[12] Kenworthy has stressed the devastating impact of recessions on hours worked by very low-income households, an issue compounded when followed by a weak recovery.[13] While the evidence is admittedly thin at this point, high-pressure labor markets may potentially play a small protective role in regards to this cyclical vulnerability. Aaronson et al. find that the gains made during high-pressure periods for Black people and women are “somewhat persistent.” Similarly, Hotchkiss and Moore find that high-pressure periods lead to higher employment, wages, and earnings in subsequent downturns for young men and Black people.[14] However, they stress that these specific positive benefits are largely confined to these groups and may be short-lived.
Data
For a full description of the data used below, see our earlier paper. We use the same procedures and inclusion criteria to generate the estimates used here with only two important changes. First, previously we used household income from all sources to determine quintile thresholds, while here we employ a common technique to adjust income for household size: household income/square root of household size.[15] Second, our estimates of annual hours worked are based on the average of individual-level data on hours worked (hours per week*weeks per year), as opposed to a quintile-level estimate of annual hours. We found that our inclusion of individuals with $0 earnings in our estimates of quintile-level hours and weeks produced an underestimation of annual hours that was not present in the averaged individual-level estimate of annual hours.
Findings
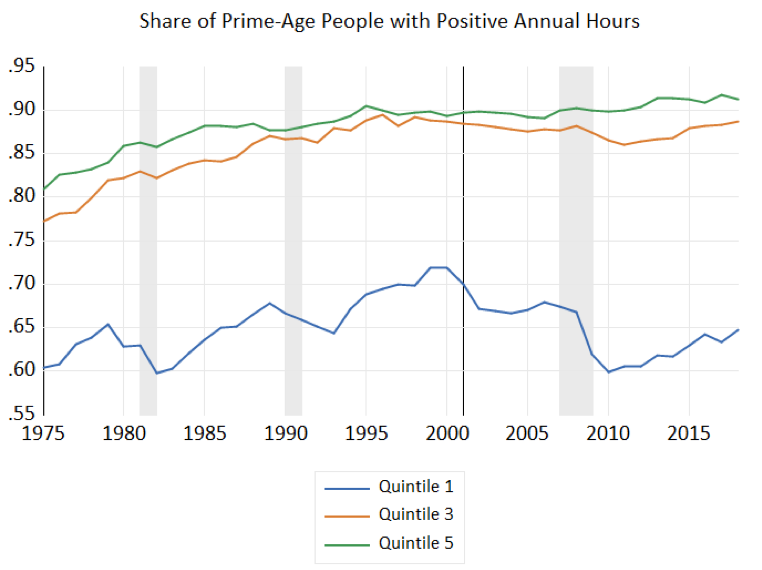
While it is common for labor analysts to look at employment rates, such rates are generally overall averages, often by gender or race. Because our data are broken out by income fifth (and by gender and race), we can look at the share of prime-age people with positive annual work hours, meaning any reported paid work last year, by quintile.[16] As Figure 1 shows, consistent with prior research, the series for persons in the lowest fifth is much more cyclical than that for the middle or top fifth.
In fact, simply using the “unemployment gap” (the extent to which the unemployment rate diverges from the so-called “natural rate”[17]) and the lagged first-quintile series in the above figure, we can derive a dynamic prediction that tracks the series well (see Figure 2).[18] The share working exceeded the forecast in the latter 1990s, but this was a period when many “pro-work” policy changes affected low-income workers, including work requirements in TANF (“welfare reform”), a large expansion in the Earned Income Tax Credit, and an increase in the minimum wage. But it was also a high-pressure labor market period.
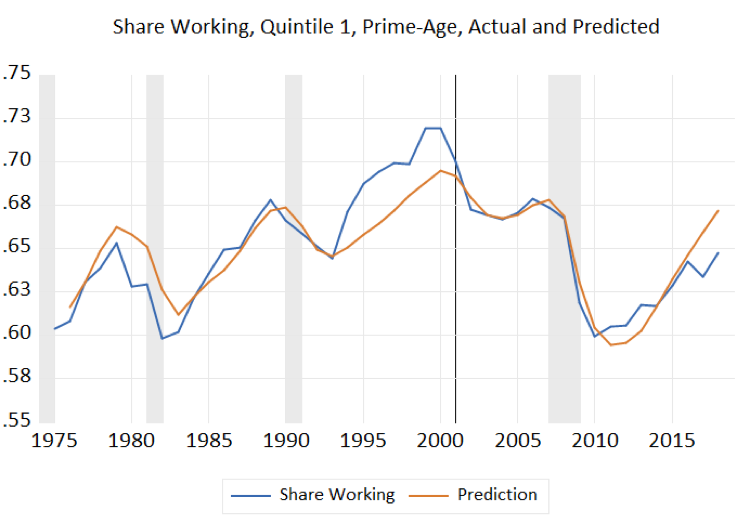
Figure 3 examines the share of working African American people. Because of the smaller sample size, we plot the bottom 40 percent. These workers appear to be particularly elastic to high-pressure labor markets, with large employment gains in the 1990s and in the current recovery.

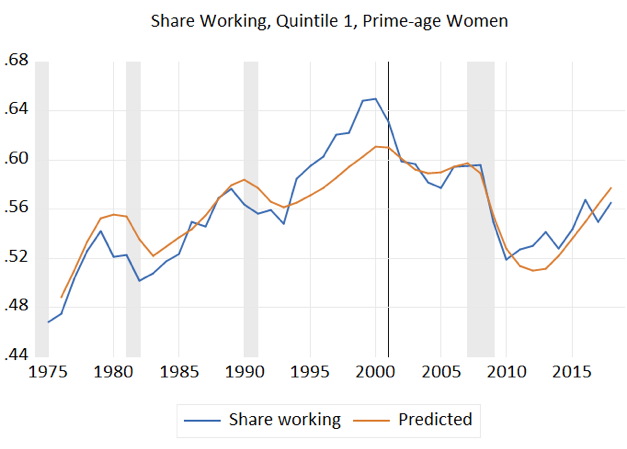
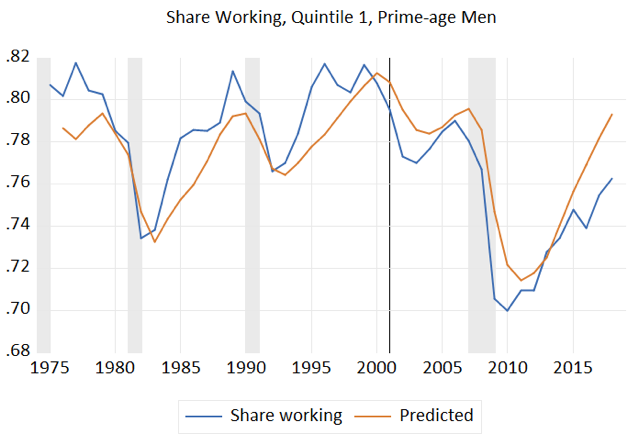
In the appendix, we include similar figures for prime-aged men and women in the first quintile of adjusted household incomes. The cyclical patterns are roughly similar to the total figure above (the simple model tracks the series well), though as earlier research has shown, the women’s series tends to trend up while that of men trends down, at least since 2000, due in part to structural challenges like the loss of blue-collar production jobs, which fell sharply in that expansion.
Because we have earnings data and annual hours, we can decompose the earnings of low-income people into the share working (the “extensive margin”), annual hours among workers, and hourly wages (see Table 1).[19] By decomposing these changes over different time periods, we can observe how this group has fared in both high- and low-pressure labor markets and which factors have the greatest impact on real earnings growth.
| TABLE 1 | ||||
|---|---|---|---|---|
| Real Earnings Contributions in High- and Low-Pressure Labor Markets | ||||
| High-Pressure | ||||
| All, Q1 | Share Working | Annual Hours | Hourly Wage | All Earnings |
| 1993 | 64% | 1,607 | $11.65 | $12,062 |
| 2000 | 72% | 1,748 | $12.90 | $16,210 |
| Log change | 11% | 8% | 10% | 30% |
| All, Q1 | Share Working | Annual Hours | Hourly Wage | All Earnings |
| 2011 | 61% | 1,608 | $12.33 | $12,005 |
| 2017 | 65% | 1,763 | $13.34 | $15,230 |
| Log change | 7% | 9% | 8% | 24% |
| African Americans, Q1 | Share Working | Annual Hours | Hourly Wage | All Earnings |
| 1993 | 52% | 1,348 | $8.57 | $5,969 |
| 2000 | 74% | 1,608 | $10.32 | $12,231 |
| Log change | 35% | 18% | 19% | 72% |
| Low-Pressure | ||||
| All, Q1 | Share Working | Annual Hours | Hourly Wage | All Earnings |
| 2007 | 67% | 1,739 | $12.91 | $12,552 |
| 2011 | 61% | 1,608 | $12.33 | $9,416 |
| Log change | -11% | -8% | -5% | -29% |
| African Americans, Q1 | Share Working | Annual Hours | Hourly Wage | All Earnings |
| 2007 | 65% | 1,621 | $10.82 | $11,454 |
| 2011 | 50% | 1,435 | $10.15 | $7,219 |
| Log change | -28% | -12% | -6% | -46% |
| Top Fifth | ||||
| All, Q5 | Share Working | Annual Hours | Hourly Wage | All Earnings |
| 1975 | 81% | 2,091 | $33.06 | $55,965 |
| 2015 | 91% | 2,217 | $60.07 | $121,574 |
| Log change | 12% | 6% | 60% | 78% |
The first few panels look at high-pressure labor markets. Between 1993-2000, when the unemployment rate fell from 6.9 to 4 percent, the real annual earnings for all low-income persons rose 30 percent (log points), from about $12,000 to $16,200. Importantly, we include those with zero hours, and thus zero earnings, in these calculations, so as to capture the impact on earnings of their crossing the extensive margin (going from zero to positive hours worked). As the first panel shows, the share working increased 11 percent, and since this is an additive decomposition (the first three columns of the row “log change” sum to the fourth column), this added labor supply explains about a third (11/30) of the earnings gain over this high-pressure period.
The second panel shows the more recent period, 2011-2018, when unemployment fell from 8.9 percent to 4.4 percent. Real earnings were up about 24 percent over this period, meaning that on an annualized basis, real earnings grew 6 points faster in the 1990s high-pressure labor market than in 2011 through 2018. The extensive and intensive margins, entry into employment and increased hours, respectively, explain roughly one-third each, as does the growth in real hourly wages.
The next panel drills down into the experience of first-quintile African Americans in the high-pressure labor market of the 1990s, when Black unemployment fell from 13 percent to 7.6 percent and their real annual earnings grew by a strong 72 percent, for an annual real growth rate of over 10 percent per year. Almost half of that gain was due to a 35 percent increase in the share working, with the other half split between more annual hours by workers and higher real hourly wages.
It is important to turn to low-pressure labor markets to see how this process shifts into reverse. From 2007-11, the jobless rate rose from 4.6 to 8.9 percent, and first quintile real earnings fell 23 percent, with almost half the decline attributable to the fall in the share of workers from 67 to 61 percent. Compare this fall to the absence of change (not shown) for the top quintile over these years. In both 2007 and 2011, their prime-age share at work was 90 percent, a stark reminder of who bears the brunt of recessions.
African American unemployment about doubled, 2007-11, from about 8 to 16 percent. Black people in the first quintile lost almost half of their real earnings in this downturn, with three-fifths of the decline coming from the decline in the share working.
Turning back to the top fifth, the bottom panel of Table 1 shows how earnings gains for affluent, prime-age people derive more from higher real wages than increase labor supply. In fact, by 2018, at about 2,200 annual hours worked, they’re largely topped out, at least in terms of annual hours. As shown above, these high earners are also much less buffeted up or down by the business cycle.
Table 2 presents the same decomposition for first, middle, and top quintile, prime-age people by gender, looking at the full period covered by our data, from 1975-2018. The findings show stark differences between the earnings outcomes and contributors to those outcomes for women and men, at least for those in quintiles 1 and 3. Real earnings for women in the first quintile rose by almost 60 percent, or 1.4 percent per year, driven, in order of importance, by the intensive margin (annual hours for workers, which explains about half their earnings gains), extensive margin (increase in share working), and hourly wage. In contrast, earnings for low-income men fell by 6 percent, as intensive margin gains were outpaced by losses in the other two margins.
Middle-income women almost doubled their earnings over these years, with fairly equal contributions from all three margins. Middle-income men, however, did only slightly better than their low-income counterparts (the next table examines changes in the gender earnings gap). One important regularity in our data is that middle and upper income prime-age men are close to the “ceiling” in terms of labor supply, with shares working over 90 percent and annual hours over 2000. This implies that earnings gains for them must come largely from higher real hourly wages.
Earnings for high-income (quintile 5) women more than doubled, up 118 log points, 1975-2018, a gain of 2.7 percent per year, with 69 percent of their gains (81/118) coming from hourly wage gains. In contrast to their lower-income brethren, Q5-prime-age men experienced earnings gains of 63 percent, or 1.5 percent per year, also from higher hourly wages, as expected given their largely tapped out labor supply.
The results in Table 2 show clear evidence of the closing of gender earnings gaps over these years. Table 3 shows these changes, again in log points, and decomposes them into the part of the closure explained by extensive and intensive labor supply margins between men and women, and their relative wages (see note for explanation).[20] The gender wage gap closed 88 log points for middle-income women relative to middle-income men over this period, with about a third of the gap closure due to relative gains at the extensive margin, and about 40 percent of the gap closure (35/88) from relative wage gains. For low-income women, the increase in the share working closed 25 of the 64 log points in by which women’s annual earnings improved relative to that of low-income men. For high-wage women, labor-supply ceiling constraints tend to place most of the pay gap closing on the hourly wage rate, which explained just under half the closure (26/55).
| TABLE 2 | |||||
|---|---|---|---|---|---|
| Real Earnings Contributions for Low-Income, Prime-Age Workers by Gender | |||||
| Women, Q1 | Share Working | Annual Hours | Hourly Wage | All Earnings | |
| 1975 | 47% | 1,209 | $10.61 | $6,002 | |
| 2018 | 57% | 1,612 | $11.88 | $10,823 | |
| Log change | 19% | 29% | 11% | 59% | |
| Men, Q1 | Share Working | Annual Hours | Hourly Wage | All Earnings | |
| 1975 | 81% | 1,760 | $16.01 | $22,738 | |
| 2018 | 76% | 1,923 | $14.67 | $21,515 | |
| Log change | -6% | 9% | -9% | -6% | |
| Women, Q3 | Share Working | Annual Hours | Hourly Wage | All Earnings | |
| 1975 | 60% | 1,488 | $15.16 | $13,635 | |
| 2018 | 83% | 1,945 | $21.75 | $35,041 | |
| Log change | 31% | 27% | 36% | 94% | |
| Men, Q3 | Share Working | Annual Hours | Hourly Wage | All Earnings | |
| 1975 | 93% | 2,140 | $26.32 | $52,299 | |
| 2018 | 94% | 2,216 | $26.73 | $55,834 | |
| Log change | 2% | 3% | 2% | 7% | |
| Women, Q5 | Share Working | Annual Hours | Hourly Wage | All Earnings | |
| 1975 | 71% | 1,792 | $22.29 | $28,261 | |
| 2018 | 88% | 2,089 | $50.08 | $91,648 | |
| Log change | 21% | 15% | 81% | 118% | |
| Men, Q5 | Share Working | Annual Hours | Hourly Wage | All Earnings | |
| 1975 | 90% | 2,260 | $39.36 | $80,015 | |
| 2018 | 95% | 2,327 | $67.95 | $149,602 | |
| Log change | 5% | 3% | 55% | 63% | |
| TABLE 3 | |||||
|---|---|---|---|---|---|
| Gender Gap Decompositions by Quintile, 1975-2018 | |||||
| Explained By: | |||||
| Closure of Women/Men Gap, Log Points | Share Working | Annual Hours | Hourly Wage | ||
| Q1 | 64% | 25% | 20% | 20% | |
| Q3 | 88% | 30% | 23% | 35% | |
| Q5 | 55% | 16% | 12% | 26% | |
Conclusion
Our findings and those of other researchers, in tandem with extensive recent anecdotes from the media regarding new opportunities for left-behind workers, show that the labor supply of low-income workers, especially women and Black people, is highly elastic to labor market conditions, while that of high-income workers is much less so. In the high-pressure labor market of the latter 1990s, real annual earnings grew by almost one-third for all first-quintile workers (including “zeros”) and by 72 percent for African American people. The increase in the share working explained about a third and one-half these gains, respectively.
The policy implications of these findings invoke both macro and micro policies. At the macro level, as we stressed in our earlier paper, running the labor market hotter-for-longer returns economically significant benefits to those who need them the most. From the perspective of the Federal Reserve’s monetary policy, the additional fact that inflation has proven to be quite insensitive to low unemployment seals the deal: as long as inflation remains “well-anchored,” for vulnerable workers to get ahead, we can and should pursue full employment.
At the micro level, our findings speak strongly against the notion that receipt of anti-poverty benefits should be conditional on the work requirements that have recently surfaced in various states, for example, through federal waivers to the Medicaid program. Low-income workers have already been highly responsive to job opportunities; the problem is that those opportunities either don’t exist in slack labor markets, or they face internal (skill deficits) or external (discrimination) barriers to getting into the job market. Hassling them off the benefit rolls by making them jump through administrative hoops is unlikely to ensure they work more, but it will surely diminish their income and their health.[21]
Appendix
End Notes
[1] We thank Jesse Rothstein for comments and Kathleen Bryant for technical assistance. Any mistakes are our own. Bernstein is a senior fellow at CBPP; Bentele is an associate research professor at the University of Arizona.
[2] Jared Bernstein and Keith Bentele, “The Increasing Benefits and Diminished Costs of Running a High-Pressure Labor Market,” Center on Budget and Policy Priorities: Full Employment Project, May 15, 2019, https://www.cbpp.org/research/full-employment/the-increasing-benefits-and-diminished-costs-of-running-a-high-pressure.
[3] Arthur M. Okun, “Upward Mobility in a High-pressure Economy,” Brookings Papers on Economic Activity, No. 1, 1973, https://www.brookings.edu/wp-content/uploads/1973/01/1973a_bpea_okun_fellner_greenspan.pdf.
[4] Robert Cherry and William M. Rodgers III (eds.), Prosperity for All? The Economic Boom and African Americans, New York: Russell Sage Foundation, 2000.
[5] Valerie Wilson, “The Impact of Full Employment on African American Employment and Wages,” Economic Policy Institute, March 30, 2015, https://www.epi.org/publication/the-impact-of-full-employment-on-african-american-employment-and-wages/.
[6] Lawrence Katz and Alan Krueger, “The High-Pressure U.S. Labor Market of the 1990s,” Brookings Papers on Economic Activity, No. 1, 1999, https://www.brookings.edu/bpea-articles/upward-mobility-in-a-high-pressure-economy/.
[7] Paul Jargowsky, “Stunning Progress, Hidden Problems: The Dramatic Decline of Concentrated Poverty in the 1990s,” The Brookings Institution, May 1, 2003, https://www.brookings.edu/research/stunning-progress-hidden-problems-the-dramatic-decline-of-concentrated-poverty-in-the-1990s/.
[8] William Julius Wilson, “The Political and Economic Forces Shaping Concentrated Poverty,” Political Science Quarterly, Vol. 123, No. 4, Winter 2008-09, https://www.jstor.org/stable/25655565?seq=1#page_scan_tab_contents.
[9] Hilary Hoynes, “The Employment and Earnings of Less Skilled Workers Over the Business Cycle,” in Finding Jobs: Work and Welfare Reform, edited by Rebecca Blank and David Card. New York: Russell Sage Foundation, 2000.
[10] Philip N. Jefferson, “Educational Attainment and the Cyclical Sensitivity of Employment,” Journal of Business and Economic Statistics, Vol. 26, No. 4, October 2008, https://www.jstor.org/stable/27639009?seq=1#page_scan_tab_contents.
[11] Stephanie R. Aaronson et al., “Okun Revisited: Who Benefits Most From a Strong Economy?” Brookings Papers on Economic Activity: BPEA Conference Drafts, March 7-8, 2019, https://www.brookings.edu/wp-content/uploads/2019/03/Okun-Revisited-Who-Benefits-Most-From-a-Strong-Economy.pdf.
[12] Ibid.; Keith G. Bentele, “Evaluating the Performance of the U.S. Social Safety Net in the Great Recession,” Center for Social Policy Publications, Paper 62, April 30, 2012, http://scholarworks.umb.edu/cgi/viewcontent.cgi?article=1061&context=csp_pubs; Tomaz Cajner et al.,“Racial Gaps in Labor Market Outcomes in the Last Four Decades and over the Business Cycle,” Finance and Economics Discussion Series 2017-071, Washington, D.C.: Federal Reserve Board, 2017, https://www.federalreserve.gov/econres/feds/files/2017071pap.pdf; Madeline Zavodny and Tao Zha, “Monetary Policy and Racial Unemployment Rates,” Federal Reserve Bank of Atlanta Economic Review, Vol. 85, No. 4, 2000, https://www.frbatlanta.org/research/publications/economic-review/2000/q4/vol85no4_monetary-policy-and-racial-unemployment-rates.aspx.
[13] Lane Kenworthy, Progress for the Poor, New York: Oxford University Press, 2011.
[14] Julie L. Hotchkiss and Robert Elijah Moore, “Some Like it Hot: Assessing Longer-Term Labor Market Benefits from a High-Pressure Economy,” Andrew Young School of Policy Studies Research Paper Series, No. 18, March 15, 2018, https://papers.ssrn.com/sol3/papers.cfm?abstract_id=3140774.
[15] This approach accounts for scale economies for families of different sizes.
[16] Note that this is a somewhat different metric than the oft-cited prime-age employment rate from BLS. The measure asks if people are working in the reference week of the month; this one asks if people had any positive work hours over the course of the prior year. The latter tends to have a higher level, but the trends are roughly similar.
[17] We use CBO’s estimate of the natural rate.
[18] “Dynamic” in this context means the lagged dependent variable is predicted (versus plugging in the actual value) for each observation in the predicted series.
[19] Annual earnings for all prime-age persons in the quintile (assigning zeros to non-workers) is the product of the share working*annual hours*hourly wage. Taking log changes facilitates the decomposition.
[20] The decomposition is based on the fact that: [ln(share wrk_w) – ln(share wrk_m)] + [ln(annual hrs_w) – ln(share hrs_m)] + [ln(real wg_w) – ln(real wg_m)] = ln(real earnings_w) – ln(real earnings_m), where w and m represent values for women and men. We do these calculations for each quintile and Table 3 records the changes from 1975-2018.
[21] Hannah Katch, Jennifer Wagner, and Aviva Aron-Dine, “Taking Medicaid Coverage Away From People Not Meeting Work Requirements Will Reduce Low-Income Families’ Access to Care and Worsen Health Outcomes,” Center on Budget and Policy Priorities, updated August 13, 2018, https://www.cbpp.org/research/health/taking-medicaid-coverage-away-from-people-not-meeting-work-requirements-will-reduce.
More from the Authors


Bentele is an associate research professor at the University of Arizona.