
The Impact of the COVID19 Recession on the Jobs and Incomes of Persons of Color
Views expressed within the report do not necessarily reflect the views of the Center.
The health response to the coronavirus has unquestionably caused one of the deepest economic downturns in our history. This current recession began with alarming speed in March of this year, as measures to contain the virus required the shutting down of huge swaths of commerce, both here and abroad. In just six weeks, the number of layoffs, proxied by the increase in claims filed for Unemployment Insurance, spiked by over 30 million. For context, consider that over the full Great Recession, payrolls declined by 9 million. The most recent national jobs report, as of this writing, revealed a magnitude of payroll job losses — over 20 million in April alone — for which there exists no historical parallel.
Though the April 2020 jobs report showed huge losses for all workers, regardless of race or ethnicity, history is clear that different groups experience downturns with significantly differing intensities.[2] By design, certain groups of workers and their communities are more exposed to the economic pain of recession in general, as their jobs and incomes are inherently less secure and they’re less likely to have the necessary savings to fall back on. In this unique recession, wherein conditions have deteriorated so quickly, this absence of insulation is particularly threatening the well-being of economically vulnerable households and communities.
Who are these highly exposed populations? Certainly, race and ethnicity are key determinants. Our research is clear that on every indicator of economic wellbeing, racial and ethnic minorities have larger-than-average responses to overall indicators; this means that indicators of labor-market slack (like unemployment or employment rates) deteriorate faster and further for people of color and, depending on the strength of the recovery, can take longer to make up lost ground. But we want to emphasize that the groups on which we focus in this report have long faced high inequality, diminished mobility, and persistently slack labor markets, well before COVID-19 arrived here. Structural racism has amplified the health and economic consequences of the current crisis on persons of color, but all those pressures predate the virus.
Though the recently ended expansion began quite weakly in terms of job and wage growth, the labor market eventually tightened up considerably, and before the crisis, it was closing in on full employment. As various papers by Bernstein et al. and others have shown, persistently tight labor markets were lifting helping less advantaged workers, boosting the pay of lower-paid workers and pulling non-workers — disproportionately persons of color — in from the sidelines.[3] Now, as near-full-employment conditions quickly unwind, these workers face a very steep risk of losing any gains they’ve made and potentially being relegated back to the sidelines of the labor market.
In fact, this is precisely what is predicted by forecasts we share below. Our key findings are based on the historical relationships between overall slack measures (mostly unemployment) and those of workers by race and ethnicity. We find:
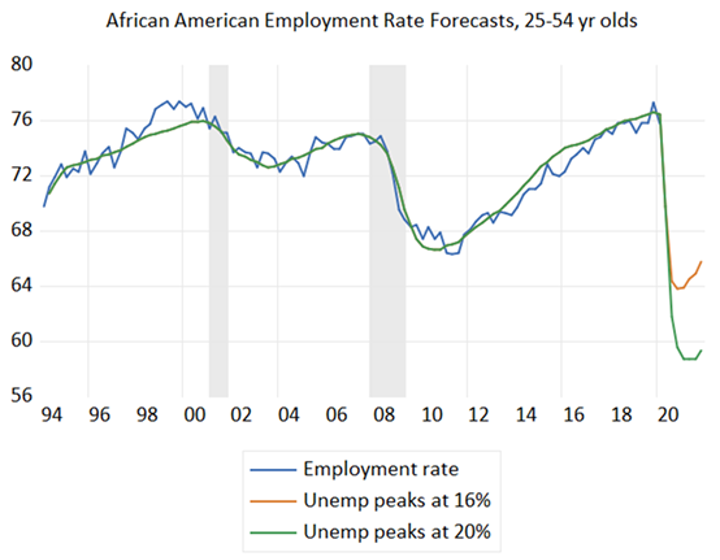
- It took 10 years for the African American employment rate for “prime-age” workers (25-54) to climb 10 points, from 66 to 76 percent. Our forecast is that these gains will fully evaporate this year.[4]
- We expect Black unemployment to peak at about 30 percent and Black underemployment at about 42 percent. The comparable rates for Hispanic workers are 22 and 41 percent.
- Because of their amplified response to the ups and downs in the business cycle, racial gaps in labor market variables narrow and widen in expansions and recessions. We expect the gaps caused by the current recession to be the largest on record.
- Real incomes fall more quickly for low- relative to higher-income workers in downturns, and the declines are steepest for low-income workers of color.
- In the past downturns we examined, the real earnings of low-income African Americans fell twice as fast as all low-income workers, driven mostly by the decline in their share working.
- Our simulation of the change in low-income Black earnings predicts that their annual earnings will fall at least 35 percent relative their actual 2018 level, almost fully reversing the gains that group made over the last expansion.
These forecasted losses must be avoided though targeted monetary and fiscal policies. Providing relief to those hurt most deeply and quickly by the recession will not only provide them and their families with essential material comforts; it also will help the near- and longer-term recovery. In the near term, relief to income-constrained families has high “multiplier effects” as these recipients spend the extra money, generating more economic activity than would otherwise occur. In the longer term, helping displaced workers quickly get back into the job market pushes back on potential “hysteresis” or scarring effects, meaning a lasting deterioration in their marketable skills that takes them out of the nation’s labor supply, reducing the potential growth rate.
This report proceeds by looking at the extent to which vulnerable groups have been disproportionately hurt in past downturns, and uses that information to make at least rough predictions, given the uncertainty associated with the virus and its containment, as to what to expect in the next few quarters and years. We then turn to the implied policy agenda, focusing on monetary and fiscal policies designed to offset the damage we see coming. Finally, we build out this agenda not just to address the challenges posed by the virus and the current downturn, but to ensure that the groups that are the focus of our analysis have a much better chance of achieving lasting economic justice on the other side of the crisis. The goal is to build a policy architecture that provides long term economic stability and is far more robust than the current one to market failures, racial injustices, weak demand, and climate degradation, as well as pandemics.
Groups with High-Beta Response Rates
A recent paper by Aaronson et al. (2019) examined “high-beta responses” by various groups to changes in economic conditions.[5] That is, it is a regularity in many economic statistics that ups and downs in the business cycle are amplified for some groups over others. As Sam Fullwood III wrote in 2015: “There’s an old saying in some African American communities that is often applied to the broad-stroke disparity of nation’s economy: when white folks catch a cold, Black folks get pneumonia.” [6]
The table below shows some simple examples of such correlations. The entries in the table represent the coefficient (called “beta” in statistical jargon) on an overall economic indicator, with different racial and ethnic indicators as the dependent variable. For example, the 1.8 coefficient for African Americans means that a one-percentage-point increase in the overall unemployment rate is associated with a 1.8 point increase for Black people. For Hispanic workers, the comparable coefficient is 1.4. But for white people, the coefficient is 0.9, a “low-beta” (i.e., less than 1) response.[7]
| TABLE 1 | |||
|---|---|---|---|
| Responses to 1 Percentage-Point Change in Overall Unemployment Rate | |||
| Unemployment | Black people | Hispanic People | White People |
| All | 1.81 | 1.40 | 0.91 |
| HS* | 1.61 | 1.28 | 1.04 |
| College* | 0.83 | 0.63 | 0.45 |
| Underemployment | 1.31 | 1.39 | 0.85 |
| Employment rate, 25-54 | 1.34 | 0.60 | 0.93 |
The rest of the table looks at variations of these relationships for different subgroups. It is sometimes argued that Black people are more buffeted by labor market cycles because they have less education, on average, than white people. The implication is that education is an insulator against the ups and downs of the macroeconomy. But the table reveals that among high-school graduates (no college), the response rate is 1.6 for Black workers, compared to 1.3 for Hispanic workers and 1 for white workers. A college education does not eradicate this difference. While both Black and white coefficients for college-educated workers are less than 1, meaning unemployment rises less for these groups than it does overall in a downturn, the coefficient is considerably lower for white people (0.45) than for Black people (0.83).
Underemployment is a broader concept of labor market slack than unemployment, as it includes part-time workers who want, but are unable to find, full-time work. Both Black and Hispanic underemployment responses — 1.3 and 1.4 points, respectively — are significantly higher than the white rate of 0.85. The differences for prime-age (25-54) employment rates contain an anomalous result for Hispanic employment, a response rate well below 1 (0.6) and below that of white people, but this is due to the relatively low employment rate for Hispanic women. The employment rate of both Black and Hispanic prime-age men is more cyclical than that of prime-age women.[8]
Decades of policy choices have ensured “high betas” for Black workers on most economic measures, including unemployment, underemployment, and income. Conservative trickle-down economics has eroded unions, created more low-quality jobs, and crippled workers’ decision-making power on the job — removing key guardrails that rebalance power and would have provided stability for workers and families in moments like these. This is especially true of workers of color, who — due to structural inequities — are less likely to earn decent wages, to be able to work from home, or to have access to health care.
The differences in outcomes between white people and people of color cannot be explained away by marital status, education, age, or location.[9] Instead, ongoing discrimination, compounded by the long-term structures that have disempowered most middle- and low-income workers — like the decline in unionization rates, deregulation of industries, and eroded worker protections — explain poor economic returns for Black workers. Economic structures meant to thwart, exclude, or exploit certain groups are worse for the economy overall. Exclusionary and discriminatory practices have contributed to skyrocketing inequality, which is directly correlated to slower economic growth, stagnant wage growth, and decreased labor market mobility.[10]
The Impact of the Shutdown on High-Beta Groups
We can use the coefficients above, along with forecasts of increases in labor market slack variables, to predict these measures for groups with high response rates. The extremely sharp, unprecedented decline in jobs and hours worked due to the virus-induced shutdown has led to equally sharp predictions of rising un- and underemployment. The table below provides forecasts of un- and underemployment by Goldman Sachs Macro Research Group (GS), a team with a relatively good track record in terms of low forecast errors, and of unemployment by the Congressional Budget Office (CBO).[11]
Both GS and CBO expect the unemployment rate to peak in the third quarter of this year at 15.1 and 16 percent, respectively, and the underemployment rate to peak at 29.2 percent. Because these forecasts were made before some of the most recent reports showing faster labor market deterioration than many expected, they may be optimistic, so we simulate a peak overall jobless rate of 20 percent as well. Applying the coefficients above (along with intercepts not shown in the table), Black unemployment peaks at almost 28 percent using the GS forecast, just under 30 percent for the CBO forecast, and 37 percent based on our 20 percent peak. The Bureau of Labor Statistics has tracked Black unemployment since 1972, and its highest peak heretofore was 20.5 percent. Based on the size of the African American labor force in March of this year, a 28 percent jobless rate translates into almost 6 million unemployed. The peak rates for Latinx and white workers are also historical records.
| TABLE 2 | |||
|---|---|---|---|
| Un- and Underemployment Forecasts for 2020 Q3 | |||
| Rate/Source | Black people | Hispanic people | White people |
| Unemployment: 15.1% (GS) | 27.8 | 21.1 | 13.6 |
| Unemployment: 16% (CBO) | 29.5 | 22.4 | 14.4 |
| Unemployment: 20% | 36.7 | 28.0 | 18.0 |
| Underemployment: 29.2% (GS) | 41.5 | 40.9 | 24.4 |
Underemployment rates are, of course, even higher as they include both the unemployed and other workers beset by slack conditions, most notably part-time workers who want to work full-time. For Black people and Hispanic workers, two-fifths are expected to be underemployed by the third quarter of this year.
One thing we expect to occur in coming months and years is for job losers to drop out of the labor force as economic activity remains depressed in the interest of virus control. In fact, the CBO forecast noted above predicts 8 million people will leave the labor force in 2020Q3, driving the overall employment rate down by 10 percent points.[12] As we discuss in our policy section, this is a serious problem requiring an aggressive policy response: some of these workers were just recently pulled into the job market, and they are at risk for long-term unemployment.
Figure 1 below uses the historical relationship between overall unemployment and the African American employment rate to forecast the forthcoming drop. The simple model fits the data well.[13] We plug in two forecasts for unemployment: the CBO forecast of 16 percent in 2020Q3 and our more pessimistic guess of 20 percent. In both cases, the forecast leads the Black employment rate to figuratively fall off a cliff, a combination of both huge job losses facing less-advantaged workers and labor force exits. The forecasts have unemployment falling by the end of this year, which generates the partial bounce-back in the figure, but even with that uptick, Black workers will have lost all their employment-rate gains in the previous expansion, a very steep loss given how much ground they clawed back. If these forecasts are correct, as the BLS’s April jobs report suggests to be the case, Black workers lost in a few months what it took them ten years to gain.
High-Beta Responses and Relative Gaps
Because people of color have higher beta responses to the business cycle than white people, racial gaps in labor-market variables tend to be “countercyclical,” i.e., they shrink in the boom and expand in the bust. Figure 2 below shows three time-series for African American, Hispanic, and white unemployment with recessionary shading and arrows to highlight the changing gaps between the rates. Note that the long expansion preceding the current recession ended up with the narrowest racial gaps on record, an example of the equalizing benefits of a persistently tight labor market.
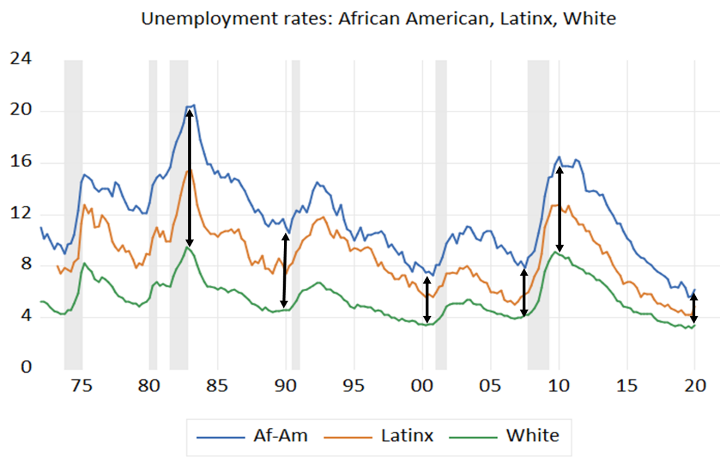
This was one of the central findings of Aaronson et al. (2019) as they documented the high-beta dynamics for people of color relative to white people. Cajner et al. (2018) present similar findings, adding that the heightened cyclicality of labor market variables for people of color, particularly for Black people, is largely unexplained by “observable” characteristics such as education or age, which we believe implicates labor-market discrimination as a contributing factor.[14] The table below summarizes these outcomes by showing the width of the gaps in percentage points at various points in the figure above. By regressing the gaps on the overall unemployment rate, we can then plug in estimates of where unemployment is heading (using the CBO forecast) and predict how much the gap will reopen in the current downturn. The last line in the table shows that these predicted gaps are the highest on record.[15]
| TABLE 3 | ||
|---|---|---|
| Unemployment Rate Gaps | ||
| Gap high | Black – white gap | Hispanic - white gap |
| Early 80s | 11.7 | 6.3 |
| Great Recession | 8.3 | 3.9 |
| Gap low | ||
| Late 90s | 3.8 | 2.1 |
| 2020 Q1 | 2.8 | 1.5 |
| Forecast 2020 Q3 | 15.1 | 8.0 |
Turning to employment rates, Figure 3 uses the Aaronson et al. data to plot the percentage-point difference between the rates for white persons and for Black and Hispanic persons, age 25-64, by gender. The trends reveal both structural and cyclical variation but in recent decades, they show the predicted high-beta response: gaps that narrow in booms but reopen in busts. Black women began the period with higher employment rates than white women, but the gap declined and went negative (higher employment rates for white women) steadily up until the full-employment pressures of the latter 1990s led to the high-beta response we’ve documented throughout, and the gap began to close.
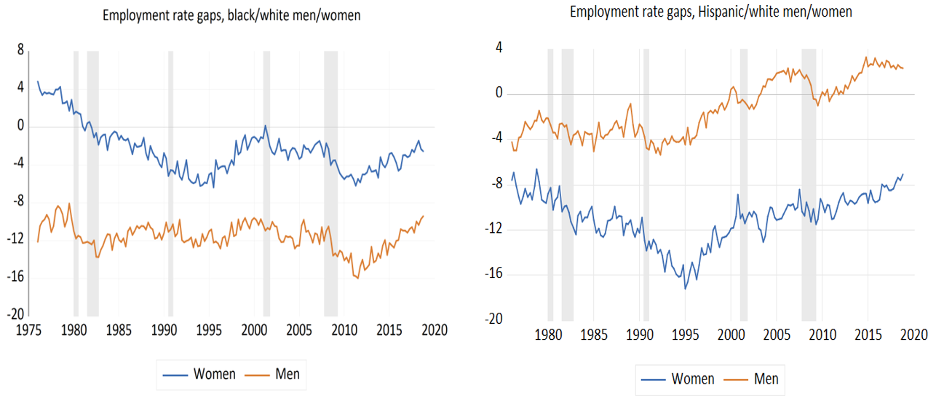
The employment-rate gap between Hispanic and white men reveal some cyclicality in the latter part of the series, for example, Hispanic men’s relative losses in the last recession followed by strong relative employment-rate growth. The series for Hispanic women does not appear particularly cyclical, though they have been closing the gap with white women since the mid-1990s.
For a slightly more rigorous test of these dynamics, we use the same approach in Aaronson, regressing these gaps on labor market slack, proxied by the difference between the unemployment rate and CBO’s estimate of the “natural rate” (labeled u-u* in the table). Statistically significant gaps are evident for Black men but less so for Black women and not for Hispanic persons of either gender. One percentage point less slack, for example, implies a 0.7 point small Black-white employment gap for men. Using the significant coefficient for the Black-white gap for men and the CBO unemployment rate forecast, we predict a 19-point negative gap in 2020Q3, the largest on record.
| TABLE 4 | |||
|---|---|---|---|
| Slack and Relative Employment Rates | |||
| Black people | U-U* | T-Statistic | |
| Men | -0.71 | -7.56 | |
| Women | -0.42 | -2.07 | |
| Hispanic people | |||
| Men | -0.22 | -0.98 | |
| Women | 0.10 | 0.66 | |
This has important policy implications to our work that we return to below, as it partially results from the willingness of the Federal Reserve to rightfully doubt the accuracy of upwardly biased estimates of the lowest unemployment rate consistent with stable prices. That is, given the high-beta evidence shown above, had the Fed raised interest rates as the overall unemployment rate fell below its estimates of the natural rate, the racial gaps shown in the figure, especially for African Americans, would not have had a chance to narrow as much as they did.
Annual Income and Earnings
We next turn from slack measures to cyclical impacts on incomes and earnings, as well as employment, by income class and race. Figure 4 uses Census Bureau data on real household income to examine the impact of four recessions over varying depth and length by income class and race/ethnicity. The four graphs show the change in income for low (quintile 1, or Q1), middle (Q3), and high (Q5) incomes for all, white, African American, and Hispanic households, with each figure plotting one of the four time periods. In each period, we examine the change in incomes from the peak year of the cycle (the year a recession started) to four years later.
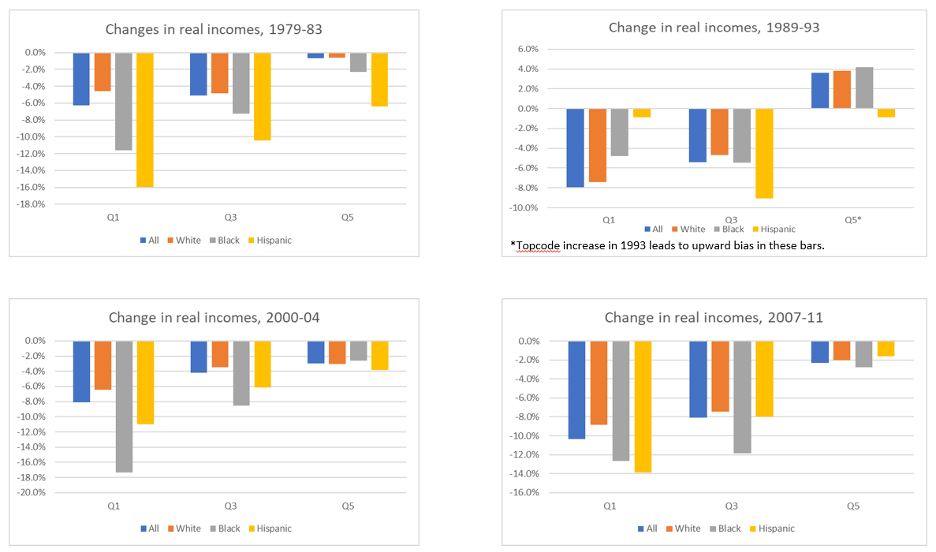
Broadly speaking, the figures show, as is well understood, that lower-income households, regardless of race, are disproportionately hurt by recessions; they also do less well early in recoveries (which, in recent cycles, have started slowly in terms of job and wage growth). Breadwinners in such households tend to work in jobs that are more exposed to the business cycle, such as a restaurant worker who is laid off when customer demand falters versus a doctor or lawyer whose practice stays busy in boom and bust periods alike. Another reason for these patterns is that higher unemployment reduces pay more for low- and middle-wage workers than for high-wage earners, a point we return to below.[16]
Looking at the racial results within the quintiles reveals that in three of the four time periods (1989-93 is the exception), low- and middle-income Black and Hispanic incomes took the biggest hits. In the relatively mild recession and initially weak recovery of 2000-04, real incomes among low-income people fell 8 percent overall, 6 for white people, and 17 and 11 percent for Black and Hispanic people, respectively. Similarly, in the 2007-11 period, real incomes among low-income people fell 9 percent for white people versus 13 and 14 percent for Black and Hispanic people, respectively. The middle set of bars in each figure shows roughly similar patterns for middle-income (Q3) households. In 2000-04, for example, incomes fell about twice as fast among Black middle-income people as white middle-income people (-9 versus -4 percent).
Using data from a set of papers by Bernstein and Bentele, we can go deeper into these cyclical dynamics by decomposing the loss of annual earnings (as opposed to income, which can reflect offsetting measures like Unemployment Compensation as well as non-labor income like Social Security) for various income classes of working-age persons, by race.[17] Annual earnings’ losses in recessions result from a combination of factors, including labor force exit, reduced hours, and reduced hourly wages. The analysis below shows the importance of the “extensive margin,” i.e., labor force exits, especially for African American workers, a fact that informs our policy recommendations. A key policy insight is that these macroeconomic dynamics are symmetric: persistently tight labor markets pull vulnerable workers into the labor force and vice versa. Thus, the policy goal must be to preserve these gains, a goal that will disproportionately benefit persons of color and their communities, as well as the broader economy.
The sample is prime-age persons (25-54) to avoid confounding this labor market analysis with retirees. Importantly, we include those with zero earnings to capture the impact of people going in and out of the job market (for more details on sample and methods, see Bernstein, Bentele papers). The analysis is driven by the fact that annual earnings are the product of the share of the group working, times annual hours, times the hourly wage. Using natural logs, we can then decompose the contribution of each factor.
The first table shows these results for prime-age workers in the first income fifth, i.e., low-wage workers in low-income households. The last column shows how real annual earnings fell 23 percent (proxied by log points, to take advantage of additive properties) between 1979 and 1983, a relatively deep recessionary period. In this case, the real earnings loss was roughly equally divided between the share working, which fell 8 percent, annual hours of workers, down 6 percent, and the fall in the real hourly wage, down 9 percent. In the 2007-11 period, the earnings decline happened to be of the same magnitude, 23 percent, but the 11 percent decline in share working dominated, explaining almost half of the earnings loss (11/23 or 46 percent). It is by no means incidental that real earnings (in 2018 dollars) were lower for these prime-wage workers in 2011 than in 1983. For much of the past four decades, earnings stagnation, driven in part by slack labor markets over much of this period, has been particularly harsh for low-income, working-age households.
| TABLE 5 | ||||
|---|---|---|---|---|
| Earnings Losses in Downturns | ||||
| All, Quintile 1 | ||||
| Share Working | Annual Hours | Hourly Wage | All Earnings | |
| 1979 | 65% | 1,579 | $13.30 | $13,714 |
| 1983 | 60% | 1,488 | $12.11 | $10,854 |
| Log change | -8% | -6% | -9% | -23% |
| Share Working | Annual Hours | Hourly Wage | All Earnings | |
| 2007 | 67% | 1,739 | $12.91 | $15,141 |
| 2011 | 61% | 1,608 | $12.33 | $12,005 |
| Log change | -11% | -8% | -5% | -23% |
| Black People, Quintile 1 | ||||
| Share Working | Annual Hours | Hourly Wage | All Earnings | |
| 1979 | 59% | 1,354 | $10.01 | $8,032 |
| 1983 | 44% | 1,262 | $9.42 | $5,228 |
| Log change | -30% | -7% | -6% | -43% |
| Share Working | Annual Hours | Hourly Wage | All Earnings | |
| 2007 | 65% | 1,621 | $10.82 | $11,454 |
| 2011 | 50% | 1,435 | $10.15 | $7,219 |
| Log change | -28% | -12% | -6% | -46% |
This is especially the case for African American quintile 1 households, as shown in the next panel. In both periods, annual earnings fell by more than 40 percent, and well over half of the earnings loss was due to declines in the share working. This key variable is highly cyclical for low earners, creating a strong linkage between the business cycle and annual earnings for this economically vulnerable population. Figure 5 shows the share of prime-age persons with positive work, by income quintile. There appears to be no discernable cyclicality in the top fifth share, a slight bit in the middle-fifth share, and quite clear cyclicality in the bottom fifth.
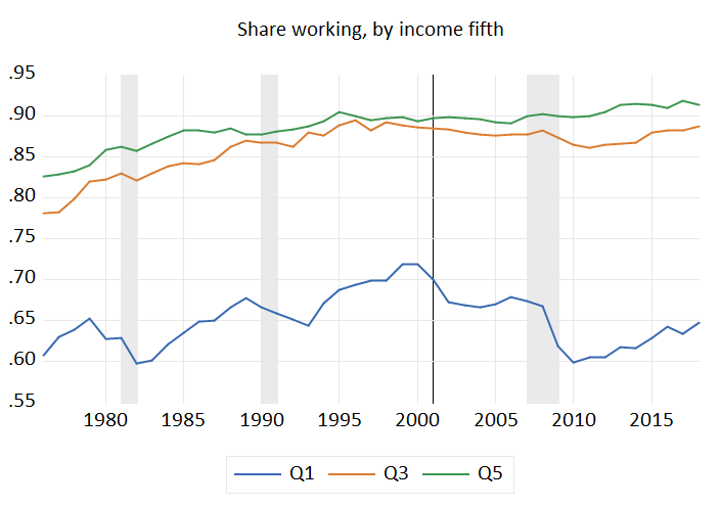
This appearance is confirmed by simple regressions of the time series above on the unemployment rate and the lagged dependent variable. For the lowest fifth, a 1 percentage-point increase in the unemployment rate reduces the share working by 0.8, with a significant t-statistic of 5.85. The middle fifth coefficient is one-fourth that of the bottom fifth and still significant. The top fifth coefficient is essentially zero. For low-income African Americans, the elasticity is especially large: 2.1 points, a value that is both economically and statistically significant. Clearly, and despite long-held prejudicial myths, these workers respond strongly to opportunity.
| TABLE 6 | ||
|---|---|---|
| Unemployment Coefficient and T-Statistics, Share Working by Income Fifth | ||
| Coefficients | T-Statistics | |
| Quintile 1 | -0.81 | -5.85 |
| Quintile 3 | -0.20 | -3.17 |
| Quintile 5 | 0.01 | 0.27 |
| Quintile 1 (Black) | -2.11 | -5.71 |
Using this same simple model and the CBO unemployment forecasts for this year and next, we can forecast 2020-21 results for the share working of prime-age African Americans in the first quintile, a group that, as shown in the table above, is particularly vulnerable to negative economic shocks. Figure 6 shows the actual and predicted values. Given the simplicity of the model, the fit is decent, broadly picking up cyclical ups and downs.
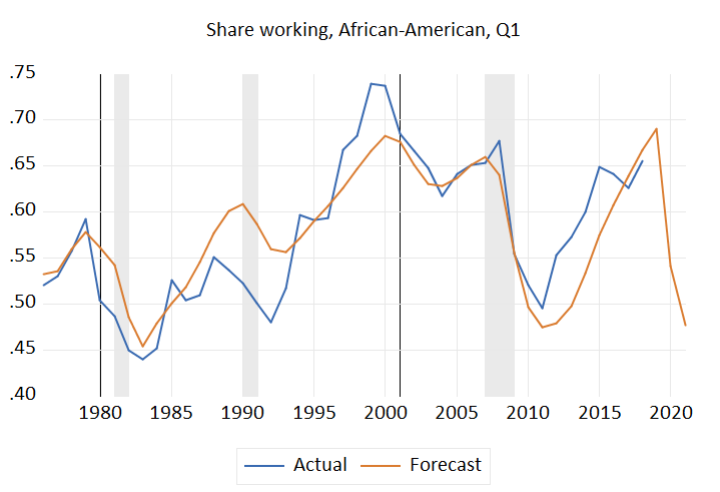
Much as in Figure 1 (though this is a subsample of that group), the forecast suggests that low-income Black workers will give up all their gains made in the long expansion ended by our response to the virus as their employment rate falls about 20 points. To better understand the earnings cost of that loss, the next table shows how much this group gained in the last expansion, once the benefits of the tight labor market began to reach low-income Black workers.
| TABLE 7 | ||||
|---|---|---|---|---|
| Earnings Gains and Losses, Low-Income Black People | ||||
| Share Working | Annual Hours | Hourly Wage | All Earnings | |
| 2011 | 50% | 1,435 | $10.15 | $7,219 |
| 2018 | 66% | 1,606 | $10.74 | $11,305 |
| Log change | 28% | 11% | 6% | 45% |
| 2018 Simulation 1 | 48% | 1,606 | $10.74 | $8,230 |
| 2018 Simulation 2 | 48% | 1,426 | $10.74 | $7,305 |
From 2011 to 2018, the share of first quintile, prime-age African Americans who worked grew from 50 to 66 percent, a 28 log point gain. That highly elastic labor market response to demand was the dominant factor in their strong, real earnings gains of 45 percent — over 6 percent per year. Increased hours and a slight increase in the real wage contributed 11 and 6 percent, respectively. Of course, their earnings levels were still extremely low, but this group has long experienced systemic racism, which has created steep barriers to labor market opportunity. The long expansion and tight job market pushed with some vigor against that long, dark, historical tide.
But the forecast reveals how quickly such gains can be reversed. Because annual earnings are the product of the three components, we can simulate the impact on earnings if the share working falls as it does in the forecast, shown in the bottom line of the table. This change alone — holding hours and wages at their near-peak 2018 levels[18] — causes the simulated annual earnings to fall about 30 percent below the actual 2018 level. The next line uses the CBO unemployment forecast to predict the decline in hours worked by those who manage to keep their jobs. This takes the real earnings loss down to about 40 percent and wipes out virtually all the gains made by this group over the expansion, with most of that loss (70 percent) from the forecasted labor market exits.
Policy Response: Addressing the Cyclical and the Structural
Our empirical analysis of the impact of the expected sharp spike in labor market slack reveals extremely concerning results for what Aaronson et al. call “high-beta” responders, i.e., those whose slack measure responds disproportionately to changes in overall measures. As is well known, this is clearly the case for many persons of color. We predict, for example, based on outside forecasts, that Black unemployment will peak just below 30 percent and Black underemployment will peak around 40 percent. For Hispanic people, predicted peaks for un- and underemployment are 20 and 40 percent. For white people, who have lower-beta responses (their rates rise or fall less than 1-for-1 with overall rates), the respective predictions are 14 and 24 percent.
It is particularly important in such racial analysis to go beyond un- and even underemployment measures to look at a key determinant of labor market outcomes for low-income persons of color: attachment to the labor force. We find, for example, particularly large elasticities with respect to slack for low-income African American workers. Forecasts suggest that these workers will quickly lose the gains they made in the high-pressure labor market of the last few years, at great expense to their earnings and income. It is essential to also recognize in this context that minorities, even those with mid-level incomes, have very little wealth or savings on which to fall back.[19] Job losers in these groups often live paycheck-to-paycheck, such that losing work quickly challenges their ability to meet basic needs, including nutrition and housing.
These insights must inform our policy response — a response that is, of course, well underway. As of this writing, the fiscal response has amounted to about $3 trillion, or 15 percent of GDP, a historically high magnitude for such interventions but one that is scaled to the size of the shock. In fact, it is clear more help will be needed and is likely to be forthcoming.
Our question is: has this help been sensitive to the needs of those most vulnerable to the downturn? We know that structural inequalities and racial, gender, anti-immigrant biases that predated the downturn are playing out in ways that are as clear as they are disturbing.[20] One dimension of this “structure-in-the-cycle” problem is the extent to which the virus preys on existing co-morbidities within Black communities in dense geographical areas, leading to disproportionate infections and deaths (see box). This dynamic is exacerbated by the fact that Black workers are overrepresented among frontline, or essential, workers, while immigrant workers are overrepresented in occupations including grocery workers, warehousing, farmworkers, home health aides, and janitors.[21]
Health Inequities in Black Communities
The early evidence shows Black communities are becoming infected with the coronavirus and dying at higher rates than white communities.[22] This is only the latest reminder of America’s deep and systemic racial inequality. Existing inequities like residential segregation, which exposes communities of color to air pollution at higher rates, and structural income and wealth inequality have led to worse overall health outcomes. And the COVID-19 outbreak has amplified these vulnerabilities for Black and brown communities, who were the first affected and will be the last to recover. For decades, policy choices have led to skyrocketing racial inequality, most notably in wealth, housing, and health outcomes, and lower quality health conditions for Black communities, setting the stage for them to be disproportionately susceptible to higher rates of layoffs, debt, infection, and even death.
To date, 14 states have still not adopted the Medicaid expansion, meaning that millions of uninsured or poor people in these states will not qualify for free or low-cost comprehensive coverage — potentially barring them from receiving the testing and treatment they need.[23] The virus may not discriminate, but policy does. When Black families have less access to health care, are discriminated against in the health care system, and have greater rates of preexisting conditions brought on by poverty, inequality, housing discrimination, and environmental racism, the result is inevitable and devastating. Inaction to address racial disparities in diagnosis, care, and treatment or act on other badly needed structural economic changes will make this crisis unnecessarily longer and more painful for Black communities. The economy does not exist separately from people. The health of the public is the health of the economy, and endangering one endangers the other.
The policy response must thus embody both cyclical and structural measures, ones that embody a racial perspective that has heretofore been absent.
In terms of the cyclical policy response, the shock to incomes that we expect based on our analysis requires fast help for job losers. The already implemented expansion of the Unemployment Insurance system, most notably the addition of $600 per week to all UI claimants, is a welcome development in this regard, but this expansion expires at the end of this July. While some forecasts predict partial recovery in the macroeconomy later this year, there is a lag between the GDP recovery and that of the job market, particularly for those groups with tenuous labor-market connections. Thus, Congress will need to continue to expand UI benefits past July.
Other important cyclical measures for those hit hardest by the crisis include checks to households and increase support for basic needs, including SNAP (nutritional support), housing (for both mortgage holders and renters), and for those who are working or seeking work, child care. Health coverage is also a critical support during the pandemic, and notable gaps persist affecting persons of color and low-income populations, especially in states that have not taken up the Affordable Care Act Medicaid expansion.[24] Such gaps are particularly troubling considering the disproportionate impact of the virus on communities of color. Forthcoming phases of relief legislation should thus target minority areas, cover the cost of testing and treatment for infected patients, expand access to coverage through expanding Medicaid, and increase the tax credits applied to premium costs in the ACA exchanges.
These measures can help meet the immediate needs of those facing extreme economic insecurity, but they will not put victims of historical, systemic racism on an upwardly mobile path. For that we need interventions that are more structural than cyclical in nature. One idea worth considering in this space is some form of direct job creation. The problem facing many with high-beta responses is “last hired, first fired.” They were relatively recently pulled into the job market as it closed in on full employment, but as joblessness rose at a historically unprecedented rate, our forecasts show these workers experiencing sharp losses. The risk is that they quickly lose whatever gains they made.
Job-creation programs targeting workers at risk of long-term unemployment (or labor market detachment) exist on a continuum between the direct creation of open-ended public sector jobs and short-term subsidies that cover part of a private- or public-sector worker’s earnings for a limited time. Paul, Darity, and Hamilton et al. describe an ambitious “universal job coverage for all adult Americans” that would “eliminate involuntary unemployment.”[25] Less interventionist proposals would subsidize pay for a targeted group of workers such as those out of work for 90 days or stuck in low-wage jobs.[26] Other proposals combine targeted subsidies with supports to overcome barriers to work, including “transportation, childcare, job readiness training, substance abuse treatment, or assistance finding a permanent job – and training programs that build skills to sustain permanent employment.”[27]
Jobs programs are “micro-policies,” targeted at individuals and groups that need such help. Equally important are macro fiscal and monetary policies that give much heavier weight to racial disparities. Beginning with monetary policy, Federal Reserve interest rate policy has, in recent years, helpfully become more data driven, meaning less dependent on unreliable estimates of how low unemployment can go without trigging spiraling inflation. Recognizing this asymmetry between the heretofore underweighted risk of weak demand and the over-weighted risk of inflationary pressure has the potential to diminish the long periods of labor market slack that have dominated U.S. labor markets in recent years.
But to push even further in this direction, the Fed should consider targeting not the overall unemployment rate, but the Black rate. Consider the high-beta coefficient of 1.8 in Table 1 for African Americans. It implies that whatever full employment rate the Fed targets, the Black rate will always be almost twice as high, a fact that empirical history supports. While we do not at all discount the Fed’s dual mandate and its role in setting and “anchoring” inflationary expectations, we do not accept that this role must consign people of color to permanently slack labor markets.
Fiscal policies must evolve in a similar manner. As we write, our highly partisan Congress has been fairly united in attacking the sharp demand contraction with aggressive stimulus. Presumably, its motivation is that market failures require such a response. But for persons and communities of color, markets fail all the time. Job quantity and especially quality is often limited even in good times, neighborhoods suffer from stark underinvestment, and upward mobility is constantly thwarted by racial barriers.
Thus, a truly race-conscious, responsible fiscal policy would provide ongoing support wherever it is needed, regardless of the state of the national economy. It could develop new measures for the success of the economy, where success is defined by the economic benefits reaped by the most marginalized communities. Moreover, such an anti-racist policy agenda would go beyond our labor market focus, and would include housing, education, voting rights, and criminal justice reforms.
Pandemics occur in a context, one greatly impacted by cultural, economic, and racial norms. One important aspect of this context is the all-too-reliable historical relationship between economic downturns and their disproportionate impact on persons and communities of color. In that regard, our hope is that the analysis in this paper serves as a warning to policymakers to “get ahead of the curve.” Although many of the numbers are necessarily preliminary — such data come with lags — both the economic and health outcomes of the coronavirus crisis will be, as is so much else in America, racially determined. Our policy response must recognize this reality and intervene aggressively, in both cyclical and structural terms, on behalf of those most exposed to economic hardship, illness, and even death.
End Notes
[1] Jared Bernstein is a Senior Fellow at the Center on Budget and Policy Priorities; the views in this report do not necessary reflect those of the Center. Janelle Jones is the Managing Director of Policy and Research at Groundwork Collaborative. We thank Kathleen Bryant for data, analysis, editing, and formatting help.
[2] Jared Bernstein, “The US job market catches the virus and crashes,” On the Economy: Jared Bernstein Blog, May 8th, 2020, http://jaredbernsteinblog.com/the-us-job-market-catches-the-virus-and-crashes/.
[3] Jared Bernstein and Keith Bentele, “Got Work? The Highly Responsive Labor Supply of Low-Income, Prime-Age Workers,” Center on Budget and Policy Priorities, updated December 13, 2019, https://www.cbpp.org/research/full-employment/got-work-the-highly-responsive-labor-supply-of-low-income-prime-age-workers.
[4] We mostly analyze quarterly data through 2020Q1, so we do not capture April’s historically awful jobs report, but our forecast appears to have been born out in the report.
[5] Stephanie R. Aaronson et al., “Okun Revisited: Who Benefits Most from a Strong Economy?” Brookings Papers on Economic Activity, Spring 2019, https://www.brookings.edu/wp-content/uploads/2019/03/Aaronson_web.pdf.
[6] Sam Fulwood III, “When White Folks Catch a Cold, Black Folks Get Pneumonia,” Center for American Progress, January 28, 2015, https://www.americanprogress.org/issues/race/news/2015/01/28/105551/when-whites-folks-catch-a-cold-Black-folks-get-pneumonia/.
[7] “Latino” generally refers to people whose origins are geographically located in Latin America, while “Hispanic” is not tied to geography but rather refers to those who have Spanish-speaking origins. In the Current Population Survey, the Bureau of Labor Statistics asks respondents to self-identify as “Hispanic, Latino, or Spanish” (this is asked in a single question).
[8] The response rate is 0.93 for Latinx men but 0.31 for Latinx women. Similarly, the rate is 1.7 for Black men and 1.0 for Black women.
[9] Jhacova Williams and Valerie Wilson, “Black workers endure persistent racial disparities in employment outcomes,” Economic Policy Institute, August 27, 2019, https://www.epi.org/publication/labor-day-2019-racial-disparities-in-employment/.
[10] Mike Konczal, Katy Milani, and Ariel Evans, “The Empirical Failures of Neoliberalism,” Roosevelt Institute, January 2020, https://rooseveltinstitute.org/wp-content/uploads/2020/01/RI_The-Empirical-Failures-of-Neoliberalism_brief-202001.pdf; Organisation for Economic Co-operation and Development, “Inequality hurts economic growth, finds OECD Research,” September 12, 2014, https://www.oecd.org/newsroom/inequality-hurts-economic-growth.htm; Josh Biven, “Inequality is slowing US economic growth,” Economic Policy Institute, https://www.epi.org/publication/secular-stagnation/.
[11] Phill Swagel, “CBO’s Current Projections of Output, Employment, and Interest Rates and a Preliminary Look at Federal Deficits for 2020 and 2021,” Congressional Budget Office, April 24, 2020, https://www.cbo.gov/publication/56335; Sinead Carew, “Goldman Sachs slashes U.S. GDP estimate further,” Reuters, March 31, 2020, https://www.reuters.com/article/us-health-coronavirus-goldman/goldman-sachs-slashes-us-gdp-estimate-further-idUSKBN21I235.
[12] In fact, according to BLS, the labor force fell 8 million from February to March 2020.
[13] The model regresses the male employment rate on the unemployment rate and a lag of the dependent variable and uses CBO’s unemployment forecast for 2020-21.
[14] Tomaz Cajner et al., “Racial Gaps in Labor Market Outcomes in the Last Four Decades and over the Business Cycle,” Board of Governors of the Federal Reserve System, Finance and Economics Discussion Series 2017-071, https://www.federalreserve.gov/econres/feds/files/2017071pap.pdf.
[15] We note that, as in both the Cajner et al. and Aaronson et al. papers, we are using the difference between racial rates versus the ratio. The latter has been shown to be less cyclical.
[16] Jared Bernstein, “The Importance of Strong Labor Demand,” Hamilton Project, February 27, 2018, https://www.hamiltonproject.org/papers/the_importance_of_strong_labor_demand.
[17] Bernstein and Bentele, op. cit.; Jared Bernstein and Keith Bentele, “The Increasing Benefits and Diminished Costs of Running a High-Pressure Labor Market,” Center on Budget and Policy Priorities, May 15, 2019, https://www.cbpp.org/research/full-employment/the-increasing-benefits-and-diminished-costs-of-running-a-high-pressure.
[18] We expect 2019 data, not currently available, to be the peak year for these variables.
[19] Angela Hanks, Danyelle Solomon, and Christian E. Weller, “Systematic Inequality,” Center for American Progress, February 12, 2018, https://www.americanprogress.org/issues/race/reports/2018/02/21/447051/systematic-inequality/.
[20] Jim Tankersley, “Job or Health? Restarting the Economy Threatens to Worsen Economic Inequality,” New York Times, April 27, 2020, https://www.nytimes.com/2020/04/27/business/economy/coronavirus-economic-inequality.html.
[21] Hye Jin Rho, Hayley Brown, and Shawn Fremstad, “A Basic Demographic Profile of Workers in Frontline Industries,” Center for Economic and Policy Research, April 2020, https://cepr.net/wp-content/uploads/2020/04/2020-04-Frontline-Workers.pdf.
[22] Ibram X. Kendi, “What the Racial Data Show,” The Atlantic, April 6, 2020, https://www.theatlantic.com/ideas/archive/2020/04/coronavirus-exposing-our-racial-divides/609526/.
[23] Kaiser Foundation, “Status of State Medicaid Expansion Decisions: Interactive Map,” April 27, 2020, https://www.kff.org/medicaid/issue-brief/status-of-state-medicaid-expansion-decisions-interactive-map/.
[24] Jared Bernstein, “The jobs crisis reveals our health system’s fatal flaws – and why we need reform,” Washington Post, April 13, 2020, https://www.washingtonpost.com/outlook/2020/04/13/jobs-crisis-reveals-our-health-systems-fatal-flaws-why-we-need-reform/.
[25] Mark Paul, William Darity, Jr., and Darrick Hamilton, “The Federal Job Guarantee – A Policy to Achieve Permanent Full Employment,” Center on Budget and Policy Priorities, March 9, 2018, https://www.cbpp.org/research/full-employment/the-federal-job-guarantee-a-policy-to-achieve-permanent-full-employment.
[26] Gideon Resnick, “House Democrats to Introduce Federal Jobs Guarantee Bill,” Daily Beast, July 24, 2018, https://www.thedailybeast.com/house-democrats-to-introduce-federal-jobs-guarantee-bill.
[27] Senator Chris Van Hollen, “Van Hollen, Wyden Introduce the Long-Term Unemployment Elimination Act,” June 20, 2019, https://www.vanhollen.senate.gov/news/press-releases/van-hollen-wyden-introduce-the-long-term-unemployment-elimination-act.
More from the Authors


Janelle Jones is the Managing Director of Policy and Research at Groundwork Collaborative.