Lessons from TANF: Initial Unequal State Block-Grant Funding Formula Grew More Unequal Over Time
The Temporary Assistance for Needy Families’ (TANF) block grant offers valuable lessons for why the House Republicans’ proposal to convert Medicaid into a block grant or per capita cap poses considerable risks for states. The TANF experience shows that block grants are a bad deal for states, particularly those that are poor or experiencing disproportionate population growth or change. In addition, efforts in TANF to address population change and hard economic times within the constraints of the funding formula have been found to be inadequate and unsustainable over time.
The TANF experience shows that block grants are a bad deal for states.To understand the block grant relative to the needy population, this paper looks at TANF funding across states on a per-poor-child basis; this measure divides a state’s block grant by the number of poor children in the state. Under this measure, TANF funding has declined relative to need in every single state since its establishment; the declines have been uneven across states and detached from changes in need. When considered on the basis of the number of poor children in a state, the TANF block grant’s formula for allocating funds to states was inequitable from the outset, reflecting differences in historic state spending on cash assistance for poor families, and block grants have grown more unequal over time. The declines in aid have been most dramatic in those states that were poorest at TANF’s start and in which poverty has increased most over time.
These facts reflect the low spending in some states under Aid to Families with Dependent Children (AFDC), TANF’s predecessor; general lack of funding support that block grants have typically received over time;[1] and the design of the TANF block grant itself, which enshrined an unequal distribution of federal funds with poorer states receiving fewer federal funds per poor child than richer states. Policymakers have tried at points to address some of these inequities, but they could not solve the inherent flaws of block grant structures and formulas, and, in some cases, replicated existing inequities.
Meanwhile, two key low-income programs, Medicaid and SNAP (formerly food stamps), have been able to change and respond to population shifts and economic fluctuations thanks to their state-federal partnerships and entitlement structures, in which anyone who is eligible for benefits or services can receive them and funding increases automatically and immediately to respond to increased need. In stark contrast, block grants like TANF and proposals to convert programs to similar fixed funding streams ignore the country’s dynamic nature.
Policymakers seeking to ensure that low-income programs, including Medicaid and SNAP, continue to be accessible and valuable to poor families should not look to a block grant or similar approach. The TANF block grant offers several lessons in how fixed or capped allocations pose risks for states.
- A block grant is a bad deal for all states, but it is especially bad for states that experience population growth or a change in the composition of their population. The TANF block grant has been fixed for the last 20 years, losing 34 percent of its value over that period. However, when considered on a per-poor-child basis, half of the states have fared even worse. On a per-poor-child basis, between 1997 and 2015, the TANF block grant declined by 50 percent or more in five states — Arizona, Indiana, Nebraska, Nevada, and North Carolina.
Poorer states have the most to lose under a block grant based on historic spending. Under AFDC, some states spent less on a per-poor-child basis. The TANF funding formula enshrined that low spending and did not adjust for future changes in population or child poverty. The five states that fared worst under the TANF block grant on a per-poor-child basis over the last 20 years were all poorer states that provided lower benefits to families in need before the block grant was created. The number of children living in poverty rose in each of these states over the last 20 years. - Adjusting a block grant for inflation will not necessarily target limited resources where they are needed. If the TANF block grant had been adjusted for inflation, it would have provided additional resources to states. However, it would not have been allocated according to increases in need, continuing the inequity among states. Poorer states’ allocations on a per-child basis would still be significantly lower than the national average.
Efforts to address the shortcomings of a block grant are likely to be inadequate and unstainable over time. Some potential problems with the TANF block grant structure and formula were anticipated, but congressional attempts to address the problems were unsuccessful and short-lived. At the time the block grant was created, Congress attempted to address inequity among the initial block grant amounts and changes in population by providing supplemental resources to select states for a number of years, but the funds were insufficient to adequately address the problem and proved politically unsustainable over time. Congress twice provided additional resources to states facing recession or high need — the Contingency Fund and the TANF Emergency Fund — but neither was adequately funded. The Contingency Fund has not been adequately funded since 2010 and the Emergency Fund ended in 2010.
Block Grant Allocations Were Unequal at the Outset
When TANF was created, the federal government allocated block grant funds to states based on historical federal spending in TANF’s predecessors, AFDC and related programs. These allocations were highly unequal among states on a per-poor-child basis — and that basic formula has remained, with total state allocations fixed since TANF’s inception.
In 1997, the federal TANF block grant allocation averaged $1,168 per poor child nationwide (in 1997 dollars). The actual block grant amount per poor child that states received ranged from a low of $332 in Arkansas to more than $2,000 in five states (Alaska, Connecticut, New York, Rhode Island, and Vermont).[2] Per poor child, the lowest state’s block grant was just 14 percent of the highest state’s. Based on their historic spending, 30 states received block grant allocations that fell below the nationwide average per poor child. (See Figure 1 and Appendix Table 1.)
As a condition of receiving its full federal TANF block grant, a state must continue to spend 80 percent of its historic state spending, known as the state maintenance of effort (MOE) requirement. When factoring in this required state spending, the inequity in total TANF spending per poor child among the states in 1997 was even greater, ranging from $462 in Arkansas to $3,860 in Connecticut.
This funding inequity was driven mainly by differences among states in the amount of AFDC cash benefits provided and the extent to which poor families received assistance (which eligibility levels influenced greatly). While the federal AFDC law set many eligibility policies that states were required to follow, it allowed states some key choices, most notably setting benefit and eligibility levels for cash aid.
Many poor states chose to set very low cash assistance benefit levels. For example, for a handful of states, AFDC benefits in 1996 (the year TANF was enacted) for a family of three with no other income were less than $200 per month. Other states set higher (but still inadequate) AFDC benefit levels; in 1996, AFDC benefits for a family of three exceeded $500 a month in only 12 states.
The extent to which poor families received cash assistance also varied widely. In 1995, the AFDC/TANF-to-Poverty Ratio (TPR) — the number of families receiving cash assistance for every 100 families in poverty — ranged from a low of 32 in Idaho to 128 in Alaska.[3] And, AFDC’s reach varied even among states with similar benefit levels. For example, in 1995, Georgia had a benefit level of $280 and a TPR of 98; Indiana had a benefit level of $288, but a TPR of 52.
States with lower cash benefit and eligibility levels received far less in federal AFDC resources on a per-poor-child basis than states that set higher benefit and eligibility levels. This disparity occurred even though poorer states received a higher federal match for each AFDC dollar spent than wealthier states. The AFDC program was funded as a federal-state partnership. To determine its match rate, AFDC used the Federal Medical Assistance Percentage (FMAP), which is based on a state’s average per capita income. For each dollar that the state provided to a family in AFDC benefits, the federal government covered half or more of the cost. In more affluent states, the FMAP rate was 50 percent, with the state and the federal government sharing the cost of benefits equally. In poorer states, the federal government matched a higher share, which in 1996 was as high as 78 percent in Mississippi. (Medicaid is funded using the same structure.)
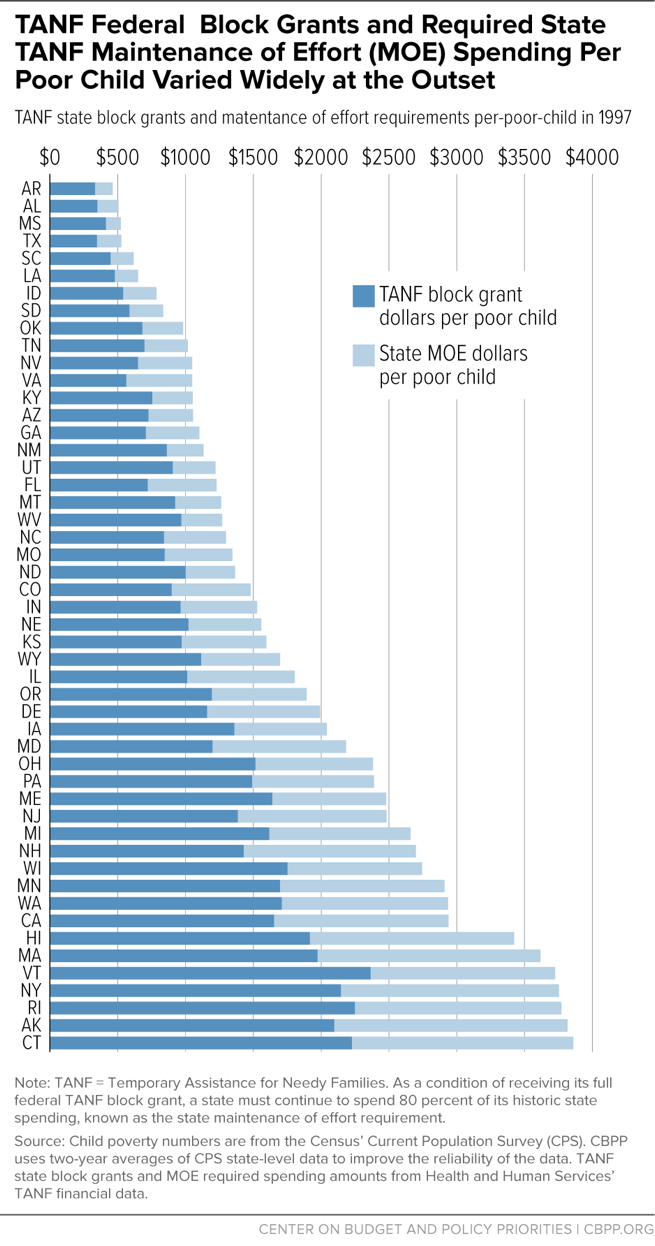
The federal TANF law also used historic state spending as the basis for each state’s MOE obligation. Since poorer states got a higher federal match, their state contribution to the program was lower. TANF’s MOE requirement thus also locked in lower state spending obligations for those states, creating a greater overall disparity in total TANF funding available per poor child among the states.
Over Time, Fixed Funding Left Some States Worse Off
The TANF block grant was not adjusted for inflation, leading to an erosion of more than a third of its value nationwide. It also did not adjust for national or state-by-state changes in child poverty over time, leaving some states substantially worse off than others on a per-poor-child basis.
Every state receives the same amount (in nominal dollars) today that it received in 1997 even though child poverty has increased in some states and declined in others. Between 1997 and 2015, the number of children in poverty nationally grew by 3 percent, primarily reflecting an increase in the overall child population; the child poverty rate was almost identical in the two years at about 20 percent. Between 1997 and 2011, the year in which child poverty was at a high point during this period, the number of children in poverty grew by 14 percent. In 2011, child poverty was about 22 percent. The increase in the number of poor children nationwide reduced the average amount of the TANF block grant per poor child, and inflation eroded it further; between 1997 and 2015, the national block grant amount per-poor-child fell 34 percent in real terms.
The impact of a fixed block grant has fallen especially hard on states where the number of children in poverty increased substantially. Between 1997 and 2015, in Nevada — the state that was hit hardest, as the number of poor children more than doubled — the inflation-adjusted block grant amount per poor child fell by 68 percent, twice the national average. In contrast, in Missouri — the state impacted the least, where the number of poor children fell by 27 percent over the period — the inflation-adjusted average block grant amount per poor child declined by just 7 percent. (See Figure 2.)
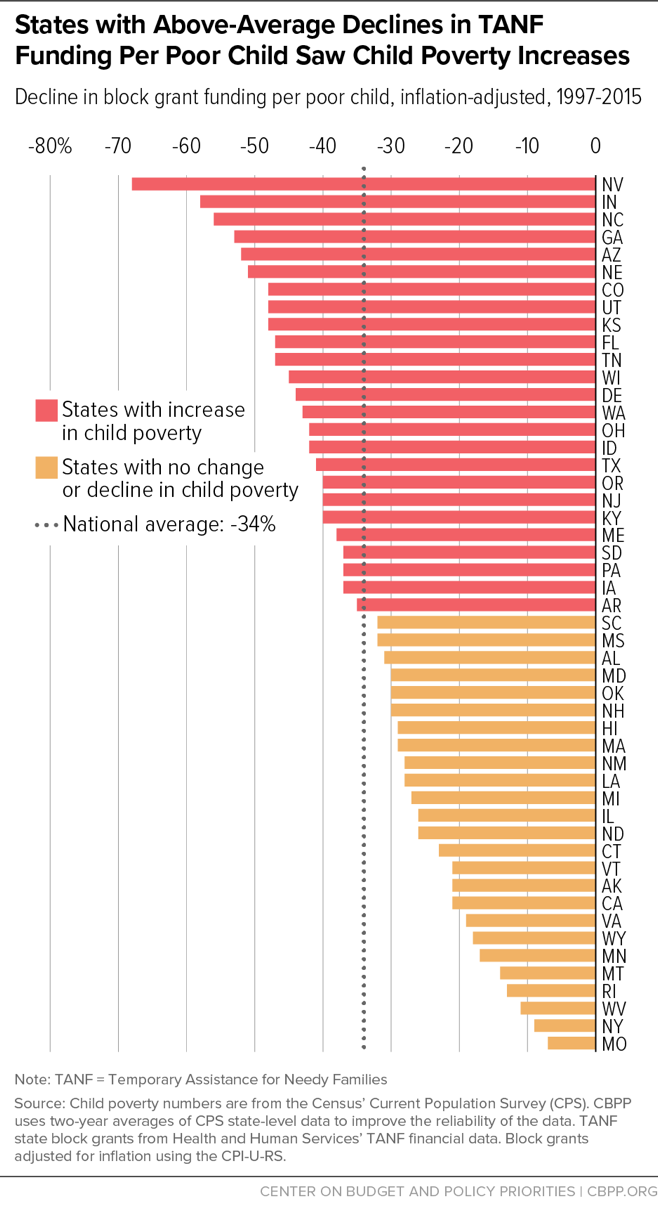
Variations in growth among states in the number of poor children and child poverty deepened the fixed block grant allocations’ unequal impact over time. Ten states with some of the greatest increases in the number of children in poverty between 1997 and 2015 had initial block grants per poor child below the national average. The ten states with the greatest decreases in the number of children in poverty were mostly, but not all, states with initial block grants per poor child above the national average. States like Nevada and Indiana that started with lower initial block grants per poor child and experienced substantial increases in the number of children in poverty fared much worse than states like Rhode Island and New York with higher initial block grants per poor child and subsequent child poverty declines. The opposing demographic trends between states with initial low block grants on a per-poor-child basis and states with initial high per-poor-child block grants further widened the inequity among states. (See Figure 3.)
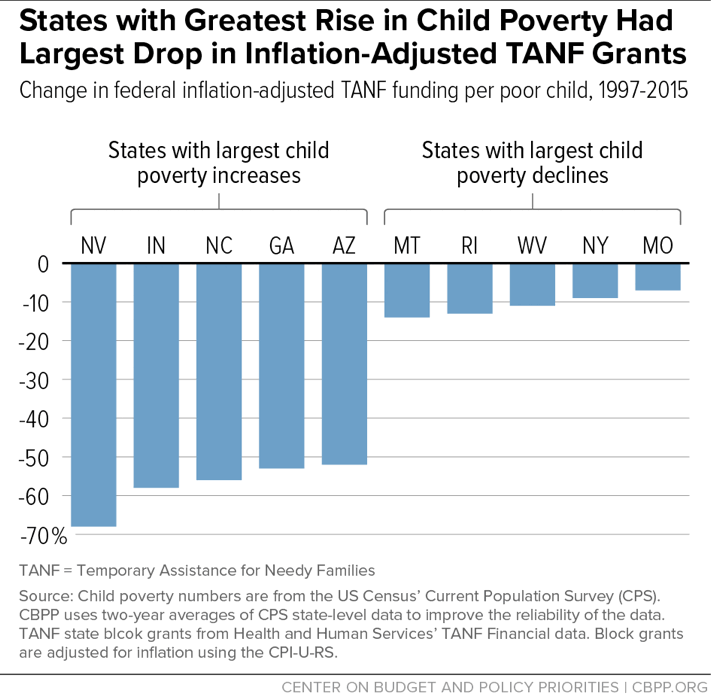
While policymakers did anticipate some of these changes (e.g., Nevada’s population had begun growing rapidly in the 1990s, before TANF’s inception), most would have been impossible to predict. Between 1997 and 2015, Nevada’s overall population increased by two-thirds (66 percent), the number of children increased by 43 percent, and the number of children in poverty increased by 111 percent. [4] (See Appendix Table 2.) As a result, the block grant per poor child dropped 68 percent after adjusting for inflation. There were more than twice as many poor children in the state in 2015 as in 1997, but the state received no additional federal TANF block grant funds to respond to the increased need.
Indiana’s population change would have been hard to predict. Its poverty rate was lower than the national average in 1997. Over the next two decades, the state’s total population and child population both grew modestly, but the number of children in poverty increased by 60 percent. As a result, its inflation-adjusted average block grant amount per-poor-child fell by 58 percent.
Unlike Nevada and Indiana, New York’s inflation-adjusted block grant per-poor-child declined by just 9 percent. The state’s child population dropped, even though its overall population grew. The state had 25 percent fewer children in poverty in 2015 than in 1997, but it nevertheless continued to receive the same federal block grant amount as it received in 1997.
If the TANF block grant had been adjusted for inflation, it would have been funded at $24 billion in 2015 — or 48 percent more than its value in 2015. However, keeping the block grant adjusted for inflation would not have erased the inequity among states. The inflation adjustment would have provided all states with additional resources, but they would not have been targeted to the states with greatest need. Any fixed funding scheme assumes that population growth and economic fluctuations are identical across all states, but as the state examples above show, this is not true.
Efforts to Address Initial Inequities and Poverty Increases Were Inadequate
Policymakers have tried three times to address some of the issues inherent in providing states a fixed block grant for TANF. Supplemental Grants and the TANF Contingency Fund were included in the original legislation and the TANF Emergency Fund was created as a part of the American Recovery and Reinvestment Act (ARRA) to provide states with extra resources during the Great Recession.
Lawmakers created the Supplemental Grants to address state concerns about the block grant formula’s initial inequity. Anticipating economic changes over time, policymakers created the Contingency Fund to provide additional federal funds to states during hard economic times and created the TANF Emergency Fund to further support states during the Great Recession. While these special funds did provide extra resources to states, they were too small to make much of a difference. In addition, they were based on the original inequitable block grant distribution, which limited their ability to help states experiencing the greatest increases in child poverty respond adequately to increased need.
Supplemental Grants
During the 1990s welfare reform negotiations, there were discussions on how to allocate the TANF block grant funds more equally across the states. The governors from the states receiving lower block grants on a per-poor-child basis were not satisfied with plans to allocate funds based on historical spending, which the House eventually agreed upon. When the legislation reached the Senate, there was concern that the legislation would not pass without a way to address the inequity. As a result, Congress added to the legislation “Supplemental Grants” of almost $800 million to be allocated to poor states and states with fast-growing populations over a four-year period.[5] Ron Haskins, one of the authors of the welfare reform law, recounts that these grants “rescue[d] [lawmakers] from the formula bog.”[6] While the Supplemental Grants may have played a key role in getting agreement on the block grant formula, they played a trivial role in reducing the inequity of the allocations to states. (See Figure 4.)
The Supplemental Grants were provided to 17 states disadvantaged under the block grant formula because they had fast-growing populations, historically low spending under AFDC and related programs, or both.[7] Each of the states that received Supplemental Grants (other than Alaska[8]) also had a below-average block grant amount on a per-poor-child basis in 1997.[9]
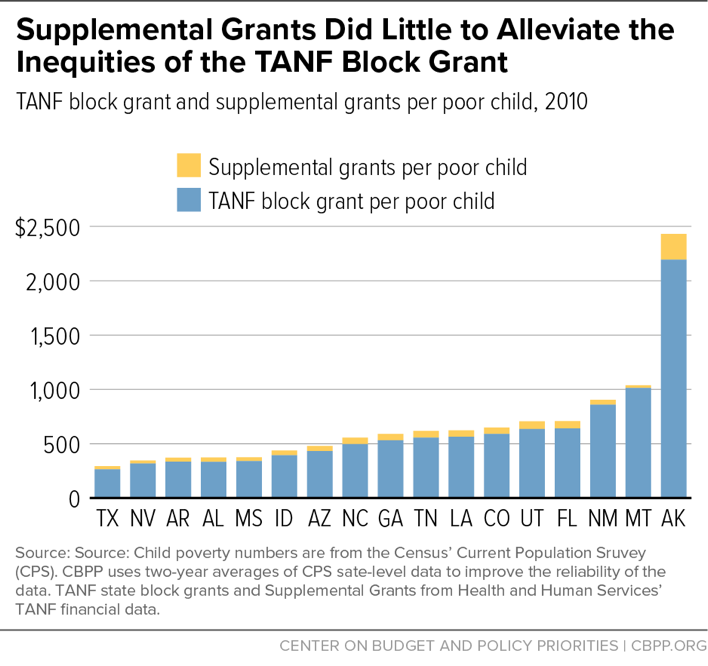
In most cases, the Supplemental Grants added a few extra dollars per poor child and did not come close to closing the gap between these poorer states and the national per-poor-child average block grant. For example, in 2010, the last year Supplemental Grants were funded at their maximum level, 16 states received between $25 and $72 in additional supplemental grant funds per poor child. (Alaska’s Supplemental Grant totaled $237 per-poor-child, increasing it further above the national average.) Despite their inadequacy, the Supplemental Grants did provide additional funds to some of the poorest states in the country. However, even at their low levels, they were not sustainable over time. Congress and President Bush extended the grants in 2001, but they ended in 2011 when Congress would not agree to extend them.
Contingency Fund and the TANF Emergency Fund

The Contingency Fund was initially funded at $2 billion; this initial funding was reduced to about $600 million per year beginning in 2010. The TANF Emergency Fund provided states with an extra $5 billion over 2009 and 2010 to respond to increased need during the Great Recession. But the Emergency Fund ended in 2010 before unemployment and poverty fell to pre-recession levels in most states.
In 2009-2010, states could access an amount equal to up to 50 percent of one year’s block grant allocation in combined Contingency and TANF Emergency Funds. Since these maximum state amounts were based on the original block grant allocations, this extra help replicated the block grant’s initial inequity. For example, in 2009-2010, the two years in which both Contingency and the TANF Emergency Funds were available, Nevada and New York both drew down their total combined Contingency and TANF Emergency funds. Before receiving those funds, Nevada and New York’s block grants per poor child were $319 and $2,230, respectively (in 2010 dollars). Nevada received $159 in additional help per poor child while New York got $1,115. Thus, the Contingency and ARRA funds substantially widened the gap between Nevada and New York on a per-poor-child basis. (See Figure 5.)
The Contingency Fund and the TANF Emergency Fund were inadequate to fulfill their purposes. Moreover, because of complex administrative requirements, all the states that qualify for Contingency Funds based on economic need do not receive them; only 20 states received Contingency Funds in 2015 even though all states met the economic hardship requirements. However, some states, like New York, are more successful than others in navigating the complex requirements other than economic hardship than other states which may have greater need.[10]
Conclusion
Twenty years of the TANF block grant offer important lessons to lawmakers who may propose to radically restructure Medicaid and other entitlement programs under the guise of improving them. TANF’s block grant structure and funding formula was fundamentally flawed from the outset. It was initially inequitable and economic and demographic changes have widened the inequities over time. Two decades of inflation have eroded its value, and every state’s block grant lost value on a per-poor-child basis. While policymakers did anticipate some problems with the TANF block grant, the solutions were inadequate and short-lived. In short, a block grant or any fixed funding stream based on historic state spending is a bad deal for states.
Medicaid and other entitlement programs work to meet the needs of low-income families and individuals as the economy and populations change. Lawmakers seeking to improve these programs should focus on expanding access and services for families rather than changing the programs’ fundamental structures.
Appendix
| TABLE 1 | |||||||||
|---|---|---|---|---|---|---|---|---|---|
| TANF Block Grant’s Value Per Poor Child Has Dropped by a Third Since 1997 | |||||||||
| 1997 Block Grant Allocation | 1997 Block Grant Per Poor Child | Percent Change in Block Grant Per Poor Child, adjusted for inflation, 1997-2015 | |||||||
| United States | $16,488,667,235 | $1,168 | -34% | ||||||
| Alabama | $93,315,207 | $349 | -31% | ||||||
| Alaska | $63,609,072 | $2,097 | -21% | ||||||
| Arizona | $222,419,988 | $725 | -52% | ||||||
| Arkansas | $56,732,858 | $332 | -35% | ||||||
| California | $3,733,817,784 | $1,653 | -21% | ||||||
| Colorado | $136,056,690 | $897 | -48% | ||||||
| Connecticut | $266,788,107 | $2,227 | -23% | ||||||
| Delaware | $32,290,981 | $1,159 | -44% | ||||||
| Florida | $562,340,120 | $721 | -47% | ||||||
| Georgia | $330,741,739 | $707 | -53% | ||||||
| Hawaii | $98,904,788 | $1,916 | -29% | ||||||
| Idaho | $31,938,052 | $540 | -42% | ||||||
| Illinois | $585,056,960 | $1,012 | -26% | ||||||
| Indiana | $206,799,109 | $963 | -58% | ||||||
| Iowa | $131,524,959 | $1,359 | -37% | ||||||
| Kansas | $101,931,061 | $970 | -48% | ||||||
| Kentucky | $181,287,669 | $754 | -40% | ||||||
| Louisiana | $163,971,985 | $478 | -28% | ||||||
| Maine | $78,120,889 | $1,640 | -38% | ||||||
| Maryland | $229,098,032 | $1,198 | -30% | ||||||
| Massachusetts | $459,371,116 | $1,973 | -29% | ||||||
| Michigan | $775,352,858 | $1,617 | -27% | ||||||
| Minnesota | $267,984,886 | $1,696 | -17% | ||||||
| Mississippi | $86,767,578 | $412 | -32% | ||||||
| Missouri | $217,051,740 | $846 | -7% | ||||||
| Montana | $45,534,006 | $922 | -14% | ||||||
| Nebraska | $58,028,579 | $1,021 | -51% | ||||||
| Nevada | $43,976,750 | $648 | -68% | ||||||
| New Hampshire | $38,521,261 | $1,428 | -30% | ||||||
| New Jersey | $404,034,823 | $1,385 | -40% | ||||||
| New Mexico | $126,103,156 | $861 | -28% | ||||||
| New York | $2,442,930,602 | $2,145 | -9% | ||||||
| North Carolina | $302,239,599 | $841 | -56% | ||||||
| North Dakota | $26,399,809 | $999 | -26% | ||||||
| Ohio | $727,968,260 | $1,515 | -42% | ||||||
| Oklahoma | $148,013,558 | $681 | -30% | ||||||
| Oregon | $167,924,513 | $1,194 | -40% | ||||||
| Pennsylvania | $719,499,305 | $1,490 | -37% | ||||||
| Rhode Island | $95,021,587 | $2,248 | -13% | ||||||
| South Carolina | $99,967,824 | $447 | -32% | ||||||
| South Dakota | $21,893,519 | $585 | -37% | ||||||
| Tennessee | $191,523,797 | $696 | -47% | ||||||
| Texas | $486,256,752 | $347 | -41% | ||||||
| Utah | $76,829,219 | $904 | -48% | ||||||
| Vermont | $47,353,181 | $2,364 | -21% | ||||||
| Virginia | $158,285,172 | $563 | -19% | ||||||
| Washington | $404,331,754 | $1,709 | -43% | ||||||
| West Virginia | $110,176,310 | $968 | -11% | ||||||
| Wisconsin | $318,188,410 | $1,752 | -45% | ||||||
| Wyoming | $21,781,446 | $1,115 | -18% | ||||||
| TABLE 2 | |||||||||
|---|---|---|---|---|---|---|---|---|---|
| Changes in the Number of Children in Poverty Over Time Have Varied Widely Among States | |||||||||
| Children in Poverty, 1997 | Children in Poverty, 2015 | Percent Change in Number of Poor Children | |||||||
| United States | 14,288,274 | 15,024,196 | 5%* | ||||||
| Alabama | 267,313 | 263,047 | -2% | ||||||
| Alaska | 30,338 | 26,034 | -14% | ||||||
| Arizona | 306,667 | 435,665 | 42%* | ||||||
| Arkansas | 170,805 | 178,777 | 5% | ||||||
| California | 2,259,458 | 1,936,094 | -14%* | ||||||
| Colorado | 151,698 | 199,290 | 31%* | ||||||
| Connecticut | 119,808 | 105,970 | -12% | ||||||
| Delaware | 27,868 | 32,990 | 18% | ||||||
| Florida | 780,200 | 1,007,698 | 29%* | ||||||
| Georgia | 467,987 | 669,104 | 43%* | ||||||
| Hawaii | 51,628 | 49,424 | -4% | ||||||
| Idaho | 59,178 | 69,042 | 17% | ||||||
| Illinois | 578,212 | 530,614 | -8% | ||||||
| Indiana | 214,703 | 343,664 | 60%* | ||||||
| Iowa | 96,777 | 103,639 | 7% | ||||||
| Kansas | 105,109 | 136,121 | 30%* | ||||||
| Kentucky | 240,570 | 271,798 | 13% | ||||||
| Louisiana | 343,123 | 323,142 | -6% | ||||||
| Maine | 47,646 | 52,209 | 10% | ||||||
| Maryland | 191,281 | 185,746 | -3% | ||||||
| Massachusetts | 232,828 | 222,787 | -4% | ||||||
| Michigan | 479,626 | 448,373 | -7% | ||||||
| Minnesota | 158,017 | 129,367 | -18% | ||||||
| Mississippi | 210,410 | 210,164 | 0% | ||||||
| Missouri | 256,703 | 186,581 | -27%* | ||||||
| Montana | 49,361 | 39,166 | -21%* | ||||||
| Nebraska | 56,846 | 77,959 | 37%* | ||||||
| Nevada | 67,852 | 143,407 | 111%* | ||||||
| New Hampshire | 26,968 | 26,160 | -3% | ||||||
| New Jersey | 291,719 | 329,596 | 13% | ||||||
| New Mexico | 146,524 | 138,317 | -6% | ||||||
| New York | 1,139,070 | 849,751 | -25%* | ||||||
| North Carolina | 359,443 | 552,188 | 54%* | ||||||
| North Dakota | 26,414 | 24,126 | -9% | ||||||
| Ohio | 480,511 | 560,945 | 17%* | ||||||
| Oklahoma | 217,321 | 210,967 | -3% | ||||||
| Oregon | 140,685 | 159,406 | 13% | ||||||
| Pennsylvania | 482,805 | 517,324 | 7% | ||||||
| Rhode Island | 42,264 | 33,096 | -22%* | ||||||
| South Carolina | 223,884 | 224,186 | 0% | ||||||
| South Dakota | 37,423 | 40,196 | 7% | ||||||
| Tennessee | 275,217 | 354,018 | 29%* | ||||||
| Texas | 1,402,051 | 1,618,384 | 15%* | ||||||
| Utah | 84,969 | 110,613 | 30%* | ||||||
| Vermont | 20,028 | 17,303 | -14% | ||||||
| Virginia | 281,167 | 234,603 | -17% | ||||||
| Washington | 236,612 | 282,767 | 20%* | ||||||
| West Virginia | 113,834 | 86,841 | -24%* | ||||||
| Wisconsin | 181,642 | 225,701 | 24%* | ||||||
| Wyoming | 19,540 | 16,196 | -17% | ||||||
End Notes
[1] David Reich et al., “Block-Granting Low-Income Programs Leads to Large Funding Declines Over Time, History Shows,” Center on Budget and Policy Priorities, February 22, 2017, https://www.cbpp.org/research/federal-budget/block-granting-low-income-programs-leads-to-large-funding-declines-over-time.
[2] The per-poor-child block grant amount that the District of Columbia received also exceeded $2,000 but, because it is a city and not a state, we have excluded it from this analysis.
[3] The TANF-to-poverty ratio is calculated by dividing the number of TANF cash assistance cases by the number of families with children in poverty from the Census Bureau’s Current Population Survey. We use two-year averages for our state-level calculations to improve the reliability of the data. For more information, see our paper, “TANF Reaching Few Poor Families,” https://www.cbpp.org/research/family-income-support/tanf-reaching-few-poor-families.
[4] Poverty changes cited here are statistically significant.
[5] The supplemental grants were extended each year after that until 2011.
[6] Ron Haskins, Work over Welfare: The Inside Story of the 1996 Welfare Reform Law, (Washington, DC: Brookings Institution Press, 2006), p. 204.
[7] The 17 states were Alabama, Alaska, Arizona, Arkansas, Colorado, Florida, Georgia, Idaho, Louisiana, Mississippi, Montana, Nevada, New Mexico, North Carolina, Tennessee, Texas, and Utah.
[8] When considering which states would receive additional funding, Congress considered states with historically high levels of poverty and states with the fastest-growing populations. Alaska was identified as being a state with a fast-growing population. Under AFDC (and TANF), Alaska had very high benefits for families because it is such an expensive place to live. Therefore, at the start of TANF Alaska’s block grant per poor child was relatively high compared to the national average. Despite being identified as a fast-growing state, the number of children in poverty did not grow with the population, so Alaska’s block grant per poor child remained above the national average.
[9] The Supplemental Grants began in 1998 with about $79 million in nominal dollars going to the 17 states. The grants increased in most of the 17 states each year until about 2001 when they remained at $319 million in nominal dollars until 2010. In 2011, Congress reduced its allocation of Supplemental Grants to $211 million in nominal dollars.
[10] For more details on what states must do to access the Contingency Fund, see page 4 of our paper “Redesigning the TANF Contingency Fund to Make It More Effective,” at https://www.cbpp.org/sites/default/files/atoms/files/6-13-11tanf.pdf.
More from the Authors

Areas of Expertise

Areas of Expertise