The Right Target: Stabilize the Federal Debt
Long-Term Budget Outlook Is Bleak; Requires Major Changes to Programs, Revenues, and Health Care
Summary
Deficits and debt will rise to unprecedented levels in coming decades without major changes in federal budget policies, so policymakers should set a goal of stabilizing the debt as a share of gross domestic product over the next decade.
This report presents new Center on Budget and Policy Priorities projections of federal spending, revenues, deficits, and debt through 2050. These projections — like previous projections that we have issued and analyses by other institutions such as the Congressional Budget Office (CBO), the Government Accountability Office, and the Office of Management and Budget — show that without changes in current policies, federal deficits and debt will grow in coming decades to unprecedented levels that threaten serious harm to the economy.
Reducing deficits in the short term, however, would undercut the fragile economic recovery. Policymakers should tolerate large deficits over the next several years in order to maintain strong aggregate demand until the economy is back on its feet. Moreover, they can take comfort in the fact that temporary measures intended to aid recovery add very little to the long-term deficit problem. The increase in deficits for several years pales in comparison to the size of the economy over the long run.
As the economy recovers, however, policymakers will need to demonstrate to the public and the lenders who finance our borrowing needs that they are prepared to move the budget toward a sustainable long-run path. President Obama’s initial budget proposal and the health reform packages that the House and Senate have passed represent first steps toward putting the federal budget on a sounder footing. (Health reform is crucial because rising spending for health care is the major force driving the projected future growth in federal deficits and debt.) They are, however, only first steps. Much will need to be done to address the full scope of the long-term budget problem.
It would be advisable for policymakers to act sooner rather than later on a package of credible deficit reductions, while delaying the effective date of some provisions by several years until the economy is in much stronger shape. Policymakers should also expect to return to long-term deficit reduction multiple times over coming decades; the problem is far too large to address in a single legislative package. For one thing, political limitations on the amount of pain that can be delivered in a single dose would make it unlikely that a single package large enough to put the budget on a sustainable long-term path in one fell swoop could be enacted. Just as importantly, uncertainty about key factors — notably about the economy’s path and the future growth of health care costs — mean that we cannot judge now the best way to solve the long-run problem once and for all. Nevertheless, policymakers should start soon to work on major policy changes.
The large temporary deficits created by the economic downturn, and the policies enacted in response, have focused welcome attention on the nation’s short- and long-term fiscal situation. Policymakers face hard choices about how to address growing deficits and debt. This paper lays out the main drivers of our long-term fiscal problem and discusses a reasonable goal for attaining fiscal sustainability — stabilization of the nation’s debt.
The report’s principal findings are:
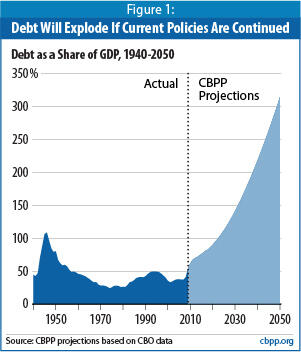
- Deficits and debt are headed for dangerously high levels. If we continue current policies, the federal debt will skyrocket from 53 percent of the gross domestic product (GDP) at the end of fiscal year 2009 to more than 300 percent of GDP in 2050. That would be almost three times the existing record (which was set when the debt reached 110 percent of GDP at the end of World War II) and would threaten significant harm to the economy. (See Figure 1.) In addition, under current policies, the annual budget deficit is projected to exceed 20 percent of GDP by 2050.Image
Deficits and debt are projected to grow this much because expenditures — largely driven by rising health care costs — will grow more quickly than revenues as a share of GDP between now and 2050. Without policy changes, we project that program expenditures (i.e., expenditures for everything other than interest payments on the national debt) will increase from 19.2 percent of GDP in 2008 to 24.5 percent in 2050. [1] We project that revenues will be at 18.2 percent of GDP in 2050, which is below their average of 18.4 percent of GDP over the 30 years through 2008, a level that was insufficient to cover expenditures during most of that period. The federal budget was balanced only four times in those 30 years, and in all four of those years, revenues stood at 20 percent to 21 percent of GDP. - A stable debt-to-GDP ratio should be the goal for achieving fiscal sustainability. The “fiscal gap” — defined here as the average amount of program reductions or revenue increases that would be needed every year over the next four decades to stabilize the debt at its 2010 level as a share of the economy — equals 4.9 percent of projected GDP. That is a very large amount. To eliminate that gap would require a 28 percent increase in tax revenues or a 22 percent reduction in program (non-interest) expenditures over the entire 40-year period from now to 2050 (or, more realistically, a combination of tax increases and spending cuts).
It is, of course, both unrealistic and unnecessary to solve the next four decades’ problem all at once. But policymakers should act soon to start stabilizing the debt as a share of the economy in the medium term (i.e., over the next decade). The longer they wait after the economy has recovered, the more painful and severe the budget and tax policy changes ultimately will need to be.
Practically speaking, this will entail trimming deficits by about half — to about 3 percent of GDP — over the coming decade; at that level, the debt will no longer be rising faster than the economy. Shrinking the deficit to 3 percent of GDP at the same time that the baby boom generation — the huge cohort born between 1946 and 1964 — will begin to retire in large numbers and swell the Social Security and Medicare rolls will be no easy task. - Rising health care costs are the single largest cause of rapidly rising expenditures, and ongoing reform of the health care system is absolutely fundamental to any solution. The two main sources of rising federal expenditures over the long run are rising per-person costs throughout the U.S. health care system (both public and private) and the aging of the population. Together, these factors will drive up spending for the “big three” domestic programs: Medicare, Medicaid, and Social Security. Growth in those programs accounts for all of the increase in federal spending as a share of GDP over the next 40 years (and beyond).
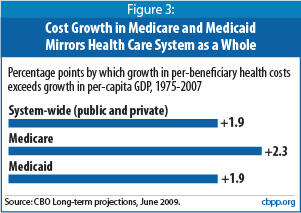
Health care costs are by far the biggest single factor. For the past 30 years, costs per person throughout the health care system have been growing approximately two percentage points faster per year than per-capita GDP. Our baseline projections assume this pattern will continue through 2050. Over time, the fiscal consequences of this rate of growth in health costs are massive.[2]
Rising costs throughout the health care system exacerbate the long-term budget problem in two ways. As is well known, they increase federal spending directly by raising the cost per beneficiary of providing health care through Medicare and Medicaid. Less well understood is that rising health costs raise deficits even further by eroding the tax base. Because of tax preferences for employer-sponsored health coverage and certain other health care spending, when health care costs grow faster than the economy, the share of income that is exempt from taxation increases and the revenue base shrinks.
Our knowledge about ways to constrain health cost growth while improving the quality of care system-wide is limited. As discussed further below, both the House- and Senate-passed health care bills take essential steps to begin addressing this problem, in part by funding demonstration projects that will expand our understanding of what works. As we learn more, policymakers will need to revisit the issue — almost certainly more than once — to act on the findings. - Upcoming tax policy decisions will have a major impact on the size of the problem. If policymakers were to allow all of the 2001 and 2003 tax cuts to expire as scheduled at the end of 2010 — or fully offset the cost of extending those tax cuts they choose to extend — this alone would shrink the fiscal gap by almost two-fifths, from 4.9 percent of GDP to 3.0 percent. The effect is this substantial because the budgetary benefits would start almost immediately (in 2011), and those benefits would reduce projected interest payments by a growing amount with each passing decade. But even if Congress were to allow all of the tax cuts to expire or to offset the full cost of extending them (which is extremely unlikely), the budget would still remain on an unsustainable long-run path.
- The recession and programs enacted to spur economic recovery are not an important factor with regard to the long-term fiscal problem. CBO forecasts that the economy will return to its potential by 2013. As a result, the deep recession that the nation is now experiencing is not responsible for a significant portion of the long-run budget gap. Nor are the policies that Congress enacted in response to the recession; the American Recovery and Reinvestment Act enacted in February 2009 has added only very slightly to the long-run gap, because its provisions are strictly temporary. Likewise, additional expenditures to support economic recovery of the magnitude that is now being considered would have only a tiny effect on the long-term picture. (See the box below)
- Federal spending for programs other than the “big three” is not responsible for the long-term imbalance. Total spending for all federal programs other than Medicare, Medicaid, and Social Security — which includes federal entitlement programs other than these “big three” — is projected to shrink as a share of the economy in coming decades. These programs will consume a smaller share of the nation’s resources in 2050 than they do today. As a result, they are not part of the cause of the long-term fiscal problem. Statements that we face a general “entitlement crisis” thus are mistaken.
The bottom line is that, as the economy recovers, policymakers should begin to implement a balanced approach to addressing the nation’s long-term fiscal problem, through a combination of sustained reforms of the U.S. health care system, reductions in federal expenditures, and increases in federal tax revenues.
Current Budget Policies Are Unsustainable
This report reconfirms what earlier reports by the Center on Budget and Policy Priorities and others have found: the nation’s budget policies are unsustainable.[3] Our projections show that the deficit will rise from 3 percent of GDP in 2008 to 22 percent of GDP in 2050 if current budget policies continue and health care costs continue to rise at the rates they have risen in the past. (While the recession swelled the deficit to 10 percent of GDP in 2009, the deficit is expected to shrink in coming years as the economic recovery takes hold, before beginning to grow again.) These projections assume that policymakers will extend a number of provisions that are scheduled to expire under current law — the 2001 and 2003 tax cuts, various other temporary tax provisions, relief from the Alternative Minimum Tax (AMT), and relief from scheduled reductions in the fees that Medicare pays to physicians — without offsetting their costs.
Under these assumptions, large deficits will markedly increase the debt as a share of the economy (i.e., the debt-to-GDP ratio), which, in turn, will cause interest payments to balloon, feeding a vicious fiscal cycle. We project that the national debt will climb from 53 percent of GDP in 2009 to 314 percent of GDP by 2050, or more than three times the size of the U.S. economy.[4] (See Figure 1. The appendix at the end of this paper explains in detail the assumptions that underlie these projections.)
Debt-to-GDP ratios of this size are unprecedented in U.S. history, even after major wars. (The debt peaked at roughly 110 percent of GDP at the end of World War II.) While budget projections, especially those that extend 40 years or more, necessarily involve a high degree of uncertainty, the conclusion that current policies are unsustainable over the long term seems inescapable.
Deficits and debt of this magnitude are widely recognized to be damaging to the economy over time. Persistently high levels of deficits and debt will ultimately push interest rates up and crowd out productive investment, reducing economic growth and, thereby, people’s incomes. To the extent that foreign investors lend us money and so ameliorate the upward pressure on interest rates, those lenders — rather than U.S. investors — will collect the interest payments, thereby siphoning some of the income generated by our economic output. Americans would feel the impact of this process gradually over a long period of time.[5]
Recession and Recovery Efforts Have Little Impact on Long-Term Projections
Although the recession has led to enormous revenue losses and large increases in expenditures for unemployment compensation, nutrition assistance, and other “automatic stabilizers” that are designed to expand temporarily when the economy weakens, its long-term budgetary effects are minimal. Policies enacted in response to the recession also worsen the long-term picture only slightly. For example, because the provisions in the American Recovery and Reinvestment Act (ARRA) enacted in February 2009 are temporary, they contribute little to the long-term budget problem.
We do not quantify ARRA’s impact on the long-term fiscal imbalance here, for a technical reason: ARRA’s budgetary effects chiefly appear between 2009 and 2011, whereas we are measuring the fiscal gap from 2011 through 2050. Nevertheless, CBPP previously estimated that an economic recovery bill costing $825 billion — modestly larger than that ultimately enacted — would account for about 3 percent of the long-run budget gap, when measured through 2050.*
Temporary costs such as ARRA, even if large in the short run, are much less significant than permanent costs such as making some or all of the 2001 and 2003 tax cuts permanent or enacting the 2003 Medicare prescription drug benefit.
The long-term fiscal gap that we project is overwhelmingly the result of budgetary policies and other factors that predated the recession — the increased expenditures and lost revenues resulting from rapid growth in health care costs, the aging of the population, and the expensive tax cuts enacted in 2001 and 2003.
* See Kris Cox and Paul Van de Water, “Economic Recovery Bill Would Add Little to Long-Run Fiscal Problem,” Center on Budget and Policy Priorities, January 16, 2009.
Alternatively, the negative impact of large, sustained deficits of the type we describe in this paper could be more sudden. Former Treasury Secretary Robert Rubin, current Office of Management and Budget Director Peter Orszag, and Wall Street economist Allen Sinai warned several years ago that, at some future point before debt reaches the very high levels we project for coming decades, “ongoing deficits [of very large magnitude] may severely and adversely affect expectations and confidence, which in turn can generate a self-reinforcing negative cycle among the underlying fiscal deficit, financial markets, and the real economy.”[6]
If nothing is done to address the nation’s long-term budget problems, the specter of excessive and rising U.S. debt levels for decades to come could lead foreign investors to lose confidence in U.S. government securities, a development that would have troubling implications for the U.S. and world economies. Policymakers must, at a minimum, demonstrate their intention to set the federal budget on a sustainable path as the economy recovers.
Policymakers Should Stabilize Debt as a Share of the Economy
A common way for economists to express the size of the fiscal problem is to quantify the long-term fiscal gap, which is the average amount of program reductions or revenue increases that would be needed annually over some future period to ensure that the debt is no larger as a share of the economy at the end of that period than it will be at the end of 2010. Under our projections, the fiscal gap equals 4.9 percent of projected GDP through 2050.[7]
To appreciate the size of the fiscal gap, 4.9 percent of GDP will equal more than $700 billion just in fiscal year 2010. This means that to close the fiscal gap evenly over the next 40 years, starting right away, would require budget cuts and/or tax increases totaling over $700 billion per year in today’s terms. This would represent deficit reduction on a scale that far exceeds anything ever achieved, or even contemplated, in the past.
Instituting deficit reduction of that magnitude immediately would be very unwise; it would be devastating to the weak economy. Even after the economy recovers, achieving deficit reduction of this magnitude in one fell swoop would be highly unrealistic. Moreover, large-scale deficit reduction almost certainly will entail some changes that need to be phased in gradually over time so that affected individuals and firms can adjust to them.
This raises the question of what would be a sensible and ambitious — but not wholly unrealistic — goal for the medium term (the coming decade) for policymakers to pursue to put the budget on a stable footing. The logical answer is to set a goal of stabilizing the debt-to-GDP ratio — that is, of reducing the deficit to the point where the debt (and hence, interest payments on it) no longer are rising faster than the economy. Doing this should both greatly reassure the nation’s creditors, who otherwise may eventually question the United States’ ability to service its debt, and keep interest costs under control.
Maintaining a stable debt-to-GDP ratio is perfectly compatible with running modest deficits. This is because economic growth raises GDP. If deficits are sufficiently modest that they do not cause the debt to rise at a faster rate than GDP, then the debt will not increase as a share of the economy. As a rule of thumb, the United States could stabilize its debt-to-GDP ratio (after the economy has recovered from the current downturn) with deficits of slightly less than 3 percent of GDP.[8]
Reducing the deficit to 3 percent of GDP over the coming decade may not sound like a difficult task — but it is. The most recent ten-year economic and budget projections (issued by CBO in August 2009) assume that GDP will have returned to its potential by 2013, although the unemployment rate — typically a lagging indicator — will be above CBO’s estimate of the “natural rate” until 2014. Our projections indicate that under current policies, the deficit will be 5.3 percent of GDP in 2013 and will rise to 6.4 percent of GDP by 2019. Thus, to reduce the deficit to 3 percent of GDP or less by 2019 (or preferably earlier) would require cutting the projected deficit more than in half between 2013 and 2019, at the same time that the baby boomers are retiring in large numbers and health care costs are continuing to grow faster than the economy.
Reducing the deficit to 3 percent of GDP by 2019 or before — and thereby stabilizing the debt as a share of GDP — would be a major accomplishment and would set in motion a virtuous cycle of debt-service savings. (Reducing the deficit trims the amount that the government needs to borrow. This reduction in debt lowers the government’s interest costs, which further reduces deficits and debt, and so on.) Achieving this goal would stabilize the debt at just over 70 percent of GDP, and net interest costs at about 3.5 percent of GDP. But much more would still remain to be done. Given rising health care costs and demographic pressures, further major rounds of deficit reduction are likely to be needed just to keep the deficit from rising above 3 percent of GDP in the decades after 2019. Furthermore, if the debt-to-GDP ratio could subsequently be lowered somewhat — which would require running deficits below 3 percent of GDP — then interest payments would cost less, leaving more room in future budgets for needed investments.
Getting the Deficit to 3% of GDP in the Years Ahead Is Ambitious but Achievable
Reducing the deficit to 3 percent of GDP by no later than 2019 (and preferably earlier) will require actions substantially larger than the biggest deficit-reduction efforts of the past — the Tax Equity and Fiscal Responsibility Act of 1982, the reconciliation acts that followed the “budget summits” between the Administration and congressional leaders in 1987 and 1990, and the reconciliation act of 1993. The largest of these trimmed deficits by about 2 percent of GDP.[9] Over the 2013-2019 period, we will need savings about one-and-a-half to two times as large.
Congress could take initial action in coming months by keeping the estate tax at its 2009 parameters and letting the 2001 and 2003 tax cuts expire for upper-income households, as President Obama proposed in his first budget. Those two policies would shave roughly half a percentage point of GDP from future deficits. Measures that generate further increases in revenues, savings in Social Security, and further savings in major health care programs (beyond those achieved by the health reform Congress is considering, which our projections do not reflect), will need to be on the table, as well.
There are practical limits, however, to how much deficit reduction can be achieved over the coming decade in Social Security and further changes to health care programs (see discussion below). Changes affecting these programs’ beneficiaries generally will need to be phased in gradually to give people time to adjust. In addition, health care reform legislation will include most of the measures we know enough to institute now to slow health care cost growth. It will be difficult to achieve large additional savings here in the years immediately ahead; it will take time for the important demonstration and research projects in the health reform legislation to yield information on how to achieve additional, substantial, health care savings without sacrificing health care quality.
One impact of these realities is that further substantial revenue increases, as well as savings in low-priority spending programs, will have to be on the table to have any chance of shaving deficits to 3 percent of GDP by 2019.
We would note that policymakers should not be swayed by arguments that preserving the estate tax and letting the upper-income tax cuts expire would derail the economic recovery. Any resulting drop in consumption by upper-income people would be modest, as research shows that a large share of the tax cuts that go to people at the top of the income scale are saved rather than quickly spent.
Moreover, the early proceeds from such measures could be used to help finance temporary policies to stimulate the economy. For example, additional funds to support state and local governments are needed to forestall unprecedented state and local budget cuts in the next year or two that would place a strong drag on the economy and could jeopardize the recovery. A continuation of extended unemployment benefits and other targeted, carefully designed measures also would boost aggregate demand and thereby help preserve or create jobs. Shifting resources from high-income tax cuts to such measures would strengthen the economy and create jobs in the short run. And once the economy recovered and the temporary economic-stimulus measure expired, the proceeds from the tax-policy changes would go to deficit reduction.
Pew-Peterson Commission Endorses Sound Ideas but Overly Ambitious Target
A commission on budget reform funded by the Pew Charitable Trust and the Peter G. Peterson Foundation recently released a report calling for Congress to enact a deficit-reduction package this year that would take effect in earnest after 2012, when the economy is expected to be on a sounder footing. [10] The Commission called for policymakers to reduce the deficit enough to stabilize the debt-to-GDP ratio at 60 percent by 2018. (The Commission says it would like to see the ratio further reduced in subsequent years — perhaps to as low as the pre-recession level of about 40 percent of GDP — but did not want to set a goal that was too ambitious.)
We agree with the Commission that the federal budget is on an unsustainable path and Congress and the President must make major changes in current policies to prevent deficits and debt from skyrocketing to dangerous levels. The call for action sooner rather than later, but with savings not taking effect until the economy is back on a sound footing, also makes sense (although we think that the economic recovery is likely to still be too fragile to begin implementing major savings as early as 2012, as the Commission recommends). Taking action soon that demonstrates our commitment to putting the nation’s finances in order will help reassure financial markets and thereby reduce the likelihood of a sudden spike in the interest rates the United States must pay on its debt; an interest-rate spike would further increase our deficits and could trigger another severe financial and economic crisis. We also agree with the Commission’s conclusion that everything — revenues and spending — must “be on the table” if this problem is to be solved.
But the Commission’s goal of ensuring that debt does not exceed 60 percent of GDP in 2018 is both overly ambitious and unnecessary. Under current policies, we project that debt will be about 70 percent of GDP at the end of 2012 and that deficits in 2013 through 2018 will average about $1 trillion a year, or 6 percent of GDP. For debt to equal 60 percent of GDP at the end of 2018, the deficits in 2013 through 2018 would have to be cut by an average of about $800 billion a year (or 4 percent of GDP a year). This is an extremely ambitious goal. As noted above, the largest deficit reduction efforts in the last three decades trimmed deficits by about 2 percent of GDP.
More importantly, while it is necessary to stabilize the debt-to-GDP ratio, it is not necessary to adopt a target of 60 percent. There is no evidence that a debt-to-GDP ratio of 60 percent represents a threshold above which the potential harm to the economy rises to an unacceptable level (and some evidence that that threshold is somewhat higher).[11]
The Commission cites the fact that the Maastricht Treaty set a debt-to-GDP ratio of 60 percent as a criterion for membership in the European Monetary Union. It does not cite evidence or economic analysis that supported the EMU’s choice of that target, and it discusses neither the role of European politics in the choice of the target nor the criticism of the target in the economics literature as being arbitrary. [12] Nor does it present any arguments to show why a criterion that was deemed appropriate as a condition for entry into the EMU in 1991 should be applied in the United States in the decades after 2010. The report also does not address whether, even if that target might have been appropriate in 1991, it would still be appropriate today in light of the dramatic increases in government debt resulting from what has in many ways been the worst financial and economic crisis since the Great Depression.
The Commission correctly notes that the International Monetary Fund also has used a 60 percent debt-to-GDP ratio target in its analyses of fiscal sustainability, but IMF staff have been clear that the criterion is arbitrary[13] and, in fact, have suggested that in light of recent increases in debt, the date for achieving the target should be relaxed — allowing advanced countries that exceed the target in 2014 to gradually reduce the ratio over 15 years, reaching 60 percent by 2029. [14]
We believe Congress and the President should focus on bringing deficits down to about 3 percent of GDP in the years ahead and then keeping deficits no higher than that level. That would achieve the necessary condition for budget sustainability of stabilizing the debt-to-GDP ratio (even though the level of debt would exceed the 60 percent of GDP target that the Pew-Peterson Commission adopted). Aiming to go further may actually have the unintended effect of making it harder to enact needed deficit-reduction legislation by making the standard for success one that requires budget cuts and tax increases of such severity that they are unacceptable politically. (It also would increase the likelihood that deficit-reduction efforts — if successful — would seriously undercut programs that provide crucial services and benefits to millions of Americans, in which case the savings likely would not endure.)
If deficits are stabilized in the coming decade, Congress and the President can later consider whether the benefits of further reducing the debt-to-GDP ratio to 60 percent (or less) would more than offset any harm that the additional budget cuts and/or tax increases needed to achieve that reduction might involve. But it does not make sense to set a target today that is not necessary to achieve budget sustainability and is sufficiently difficult to achieve politically that it would make continued inaction more likely than would an ambitious and sufficiently strong, but somewhat less daunting (and excruciating), target.
As noted above, policymakers will almost certainly need to enact multiple deficit-reduction packages over coming decades. Each such effort would increasingly use the power of compound interest to bring down deficits and stabilize the debt.
Main Causes of Rising Expenditures Are Health Care Costs and Demographic Changes
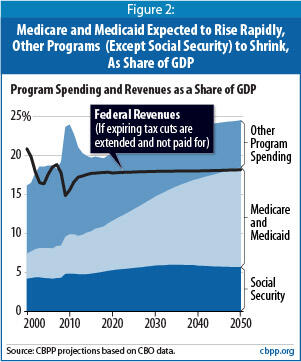
Social Security expenditures will grow rapidly over the next two decades with the aging of the baby boomer population, but then will level off as demographic shifts stabilize. Social Security costs are projected to be about one-fifth larger in 2050 than they are today, rising from 4.8 percent of GDP to 6 percent of GDP in the mid-2030s before subsiding slightly to 5.7 percent in 2050.
In contrast, Medicare and Medicaid expenditures combined are projected to more than double over the same period, rising from 5 percent of the economy today to over 10 percent in the mid-2030s and almost 13 percent in 2050. While the aging of the population contributes to higher Medicaid and Medicare spending levels — especially as the baby boomers join the ranks of the “oldest old,” who tend to incur the heaviest medical bills — the bulk of the growth in these programs stems from rising per-person health costs.
In short, Social Security costs will largely stop growing as a share of GDP after 2035, while Medicare and Medicaid costs will continue rising as a share of GDP for as far as the eye can see because health care costs are projected to continue growing faster than GDP.
Total spending for all other programs is projected to grow more slowly than the economy in coming decades. This includes all entitlement programs other than Medicare, Medicaid, and Social Security; defense spending; and non-defense discretionary spending. Since aggregate spending for all entitlement programs outside of the “big three” is projected to grow more slowly than the economy, common pronouncements that the nation’s fiscal problems result from a general “entitlement crisis” are imprecise and mistaken.
Savings in Medicare, Medicaid, and Social Security Alone Cannot Solve the Long-Term Problem
While Social Security, Medicare, and Medicaid account for all of the projected increase in program (i.e., non-interest) spending relative to the size of the economy over the next four decades, it is neither realistic nor desirable to expect that savings in those programs alone can solve the problem. To be sure, substantial savings in these programs, particularly in Medicare and Medicaid, will be necessary. But there are good reasons why those savings will not and should not be so large by themselves to achieve a sustainable budget.
Most experts agree that we cannot hold the growth of Medicare and Medicaid costs over time below the growth of private-sector health costs. Since the public and private sectors use the same health providers and the same treatments, holding growth in the public sector to a much lower rate than growth in the private sector would lead either to rationing of health care by income or, more likely, to a substantial shift of costs to the private sector as providers raise prices for privately insured patients to compensate for lower public-sector reimbursements.
Efforts to reduce the growth of health care spending system-wide (both public and private) are the key to reducing Medicare and Medicaid costs in a sensible, compassionate, and sustainable manner. Provisions included in health reform bills passed by the House and Senate — including steps to begin changing Medicare reimbursement policies in ways that could serve as a blueprint for private-sector changes that would improve the efficiency of the health care system as a whole — represent a crucial first step in the effort to slow system-wide cost growth. But, because the increases in health care costs are due to a substantial degree to advances in medical technology — many of which improve health and prolong life — it almost certainly will not be possible (or desirable) to slow the growth of health care costs so much that it is no greater than the rate of economic growth.
Similarly, while there are sensible and compassionate ways to achieve savings in Social Security, there are limits to how large those savings can be without undercutting the crucial role of Social Security in reducing poverty and ensuring a better life for people who are elderly or have disabilities. Social Security benefits under current policies are not as generous as some people assume. Social Security checks now replace about 39 percent of an average worker’s pre-retirement wages, less than similar programs in other Western countries. And because of the currently scheduled increase in the “normal retirement age” (which operates as an across-the-board benefit reduction) and the projected growth in Medicare premiums (which are deducted from Social Security checks), that figure will gradually fall from 39 percent to about 32 percent over the next two decades under current law.[15] In addition, recent losses in 401(k) and other retirement plans that supplement Social Security make it all the more important to ensure that Social Security benefits are maintained at an adequate level.
Tax Policy Choices Will Have a Major Impact on the Long-Term Problem
Tax policy decisions that Congress will make in the near future will have important implications for the size of the long-term fiscal problem. Allowing all of the 2001 and 2003 tax cuts to expire as scheduled — or fully offsetting the costs of those tax cuts that are made permanent — would increase revenues by nearly 2 percent of GDP each year. That action would reduce the fiscal gap through 2050 by almost two-fifths — from 4.9 percent of GDP to 3.0 percent.
The reason that these tax policy decisions would have such a pronounced long-term fiscal impact is that they would occur very soon. Even allowing only a minority of the 2001 and 2003 tax cuts to expire (such as those for high-income households) and paying for a fraction of the tax cuts that Congress elects to extend would begin to reduce projected deficits, debt, and interest payments immediately and significantly, because the savings from these changes would compound over time.
Some observers have sought to downplay the importance of these tax cuts, arguing that the long-term growth projected in the cost of federal health care programs is vastly more significant. To be sure, the tax cuts cost about 2 percent of GDP, while the growth of Medicare and Medicaid is projected to add more than 8 percent of GDP to federal program costs by 2050. But this growth in health care costs will occur gradually over 40 years. By contrast, letting some of the 2001 and 2003 tax cuts expire and/or paying for some of the tax cuts that are extended would start to improve the budget outlook almost immediately and have a powerful compounding effect on debt and interest payments every year in the future.
Of course, there is virtually no chance that policymakers will agree to pay for all of the tax cuts they extend. And even if they did, this would fall well short of what will be needed to place the nation on a sustainable long-term fiscal path. If all of the tax cuts enacted in 2001 and 2003 either expired or were fully offset, debt in 2050 would still exceed 200 percent of GDP and continue to rise after that.
Tough Choices Will Be Needed on Both Revenues and Expenditures
These projections indicate that sooner or later, difficult choices will simply have to be made. Such choices are inescapable.
It would be both politically implausible and inadvisable on policy grounds to try to eliminate the fiscal gap solely by raising taxes or solely by cutting programs. Eliminating a fiscal gap of 4.9 percent of GDP would require a 28 percent increase in tax revenues or a 22 percent reduction in all programs — including Social Security, Medicare, defense and anti-terrorism activities, education, veterans’ benefits, law enforcement, border security, environmental protection, and assistance to the poor — every year over the entire 2011-2050 period. Thus, it is crucial that both sides of the budget — revenues and expenditures — be on the table when serious conversations about deficit reduction begin.
Current Revenue Levels Inadequate to Meet Future Needs
Revenues proved inadequate to finance government programs and pay interest on the debt in recent years even before the drastic decline in revenues caused by the recession. Revenue levels under current policies will be even less adequate over the next 40 years. As health care costs rise and the population ages in coming decades, the need for more federal revenues will grow. This will be true even if health care reform reduces future cost growth.
The alternative — financing the government in future decades at current revenue levels — would require budget cuts so massive and draconian that they almost certainly would be politically unachievable. Cuts of that magnitude also would be undesirable from a policy standpoint.
Continued Reform of the Health Care System Crucial
Second, rising private-sector health care costs depress federal revenues. A substantial portion of health care spending is non-taxable: employer-provided health benefits are excluded from taxable income, and various other provisions of the tax code allow individuals to pay some health care costs from pre-tax income. As a result, when health care costs grow faster than the economy, the share of total income that is exempt from taxation rises, and revenues fall below what they would otherwise be.
Slowing cost growth in the entire health care system thus will have the double benefit of decreasing federal health care spending and limiting the erosion of federal revenues caused by rising private-sector health costs.
The health reform bills that Congress is considering take important initial steps toward reducing health cost growth by changing incentives for health care financing and delivery. By taxing high-cost employer-provided health insurance plans, the Senate bill discourages employers from providing, and insurers from offering, high-cost plans.[16] Both bills also modify Medicare payment policies to reward quality care and reduce compensation for care that unnecessarily exacerbates health problems or raises the cost of care. In addition, the Medicare delivery system reforms in the bills may serve as a model for some private-sector efforts to link quality and cost.
Our knowledge of how to slow health care cost growth beyond the reforms included in the health care bills is, unfortunately, quite limited at the present time. The health reform bills fund a number of demonstration and research projects intended to expand our understanding of effective ways to reduce costs.[17] As we gain a keener understand of what works, Congress will need to continually revisit health care policy to revamp and refine incentives to foster the practice of cost-effective, high-quality health care. [18]
Even with major health reforms, it is likely that Americans will choose to pay for innovations in medical care in coming decades in order to avail themselves of continued medical advances. Although the U.S. health care system contains significant inefficiencies that raise its costs, medical breakthroughs that tend to improve health and lengthen lifespans also contribute substantially to health care cost growth — and citizens will not want to forgo them.
As ongoing economic growth raises real (inflation-adjusted) incomes in coming decades, Americans may want to invest a steadily increasing share of their incomes in securing better health and longer lives. And if, as seems likely, Americans conclude that care intended to produce better health and longer lives is worth a somewhat larger share of their incomes in the future, it will be necessary to pay for these added costs rather than simply to pile up ever-mounting levels of debt. For the federal budget, this means that policymakers will have to finance any increases in federal health care costs as a share of GDP through increased revenues (perhaps including new sources of revenues), reductions in projected expenditures for other programs, or a combination of the two.
In short, solving the nation’s long-term budget problems will require that political leaders enact program reductions and revenue increases plus continued major reforms of the health care system.
Appendix
Our Projections
We base our estimates on CBO’s ten-year baseline budget projections published in August 2009, and CBO’s most recent long-term projections, published in June 2009.[19] For the first ten years, we adjust the CBO baseline to reflect current tax and spending policies more realistically, as explained below. We then project spending and revenues for subsequent years using growth rates from CBO’s long-term analysis.
Budget projections necessarily reflect a great deal of uncertainty. We therefore find it inadvisable to place much confidence in estimates that project well beyond 40 years. We outline below the assumptions that underlie our projections and discuss the outcomes that would result from different assumptions. Our assumptions about health care cost growth largely drive our results. Needless to say, the future trajectory of health care costs is highly uncertain — surely more so than the trajectory of other federal expenditures. Nevertheless, our projections provide a guideline for understanding the long-term fiscal implications of the major choices that policymakers will face in coming years.
Projections Through 2019
As noted, we base our expenditure and revenue projections through 2019 on CBO’s August 2009 baseline budget projections, adjusted by CBO’s projections of alternative policy scenarios. CBO follows budget baseline rules that call for assuming that current laws will remain unchanged — an assumption that is sometimes unrealistic. In many respects, current laws differ from current policies. For this reason, we and many other budget-watchers regularly adjust the CBO baseline.
Specifically, we assume that Congress will continue all of the 2001 and 2003 tax cuts that are scheduled to expire at the end of 2010 under current law and other expiring tax provisions (the so-called tax “extenders”), except for temporary tax cuts contained in the American Recovery and Reinvestment Act of 2009.[20] We also assume that Congress will continue relief from the Alternative Minimum Tax by extending the current AMT exemption, indexed for inflation.
In addition, we assume that Congress will continue to defer scheduled cuts in Medicare physician payments, as it routinely has in recent years, and instead provide doctors with a payment increase based on the Medicare Economic Index. (CBO’s baseline assumes that deep cuts in Medicare payments to doctors will go into effect.) We also adjust projected war expenditures to reflect a CBO scenario that assumes a reduction in total troop levels in Iraq and Afghanistan to 75,000 by 2014, and we include an allowance for expenses related to future natural disasters. (See Table 1.)
Expenditure Projections After 2019
| TABLE 1: | ||||||||||||
| 2009 | 2010 | 2011 | 2012 | 2013 | 2014 | 2015 | 2016 | 2017 | 2019 | 2019 | 2010-2019 | |
| CBO baseline | 1,587 | 1,381 | 921 | 590 | 538 | 558 | 558 | 620 | 626 | 622 | 722 | 7,137 |
| Do not extend emergenciesa | 0 | -79 | -139 | -171 | -194 | -213 | -231 | -250 | -267 | -286 | -307 | -2,136 |
| Tax law extensionsb | 0 | 11 | 146 | 248 | 281 | 299 | 314 | 326 | 339 | 351 | 364 | 2,680 |
| AMT relief | 0 | 7 | 82 | 75 | 82 | 90 | 100 | 110 | 123 | 138 | 154 | 961 |
| Iraq & Afghanistanc | 0 | 68 | 109 | 110 | 89 | 70 | 59 | 55 | 55 | 52 | 52 | 720 |
| Cancel Medicare physician fee cuts | 0 | 8 | 14 | 18 | 25 | 31 | 38 | 46 | 51 | 55 | 60 | 345 |
| Disaster relief | 0 | 11 | 16 | 18 | 20 | 23 | 25 | 26 | 27 | 29 | 30 | 226 |
| Adjust budgetary treatment of Fannie & Freddied | -199 | -1 | -4 | -8 | -13 | -5 | -4 | -3 | -3 | -3 | -3 | -247 |
| Adjust for actual 2009 deficit | 29 | 0 | 0 | 0 | 0 | 0 | 0 | 0 | 0 | 0 | 0 | 29 |
| Debt service | 0 | 1 | 6 | 19 | 43 | 74 | 107 | 143 | 184 | 230 | 279 | 1,087 |
| CBPP adjusted baseline deficit | 1,418 | 1,406 | 1,151 | 899 | 873 | 927 | 965 | 1,075 | 1,135 | 1,188 | 1,352 | 12,389 |
| Outlays, Revenues, and Deficits as a Share Of GDP Under CBPP Projections | ||||||||||||
| Outlays | 24.9% | 25.3% | 24.3% | 22.9% | 22.6% | 22.9% | 23.0% | 23.5% | 23.6% | 23.7% | 24.2% | 23.6% |
| Revenues | 14.9% | 15.6% | 16.6% | 17.2% | 17.4% | 17.5% | 17.7% | 17.7% | 17.8% | 17.8% | 17.8% | 17.4% |
| Deficits | 10.0% | 9.7% | 7.7% | 5.7% | 5.3% | 5.4% | 5.4% | 5.7% | 5.8% | 5.9% | 6.4% | 6.2% |
| Source: CBPP calculations based on data from the Congressional Budget Office and the Joint Committee on Taxation. | ||||||||||||
Our long-term projections use the 2019 levels of spending and revenues described above. We then apply what we believe are appropriate growth rates to the various categories of spending and revenues..[21]
For instance, we project the growth of Social Security costs after 2019 in accordance with CBO’s long-term budget projections. [22] We project that both Medicare and Medicaid will grow at the same rate as CBO’s long-term projections show for the combined costs of the two programs.[23] (Because we use a composite growth rate, our projections for Medicare cost growth are slightly lower than CBO’s and our projections for Medicaid are slightly higher, but our net federal health care growth rate exactly matches CBO’s.)
We also assume that overall spending for defense and non-defense programs other than Social Security, Medicare, and Medicaid will increase after 2019 at the rate of inflation plus population growth. This approach essentially assumes that these programs will continue providing the same real level of per-person services in the future as they do in 2019.
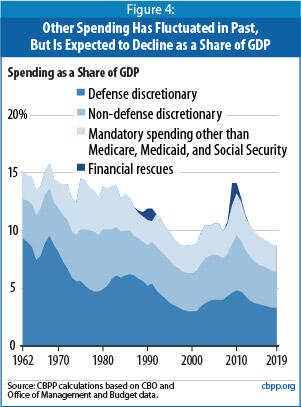
Keeping this category constant as a share of GDP, however, would contradict the general historical trend. Except during recessions, wars, or unusual circumstances like a financial crisis, such spending has drifted down over time as a share of GDP. (See Figure 4.)
For purposes of long-run current-policy projections, it thus seems reasonable to assume that this category, as a whole, will grow by more than inflation but less than GDP. A combination of inflation plus population growth fits that bill. Congress and the President may well decide that the nation should spend more in real (inflation-adjusted) per-person terms on these programs, but that would represent a change in current policy. [24]
Revenue Projections After 2019
We assume that policymakers will permanently extend the recent tax cuts, certain other temporary tax provisions, and relief from the AMT, and we base growth rates after 2019 on CBO’s alternative fiscal scenario. Our revenue projections therefore reflect the consequences of maintaining most of the policies currently in effect, rather than maintaining current law, with its scheduled expiration of many tax provisions.
Our projections — like CBO’s — also assume a decrease in revenues due to increased private-sector health care spending. As health care costs rise, employees are likely to receive a greater share of their compensation in the form of health benefits. Since such benefits are excluded from taxation, higher private-sector health care costs reduce the amount collected in income and payroll taxes. Increases in tax-deductible premium costs result in a further reduction in tax revenues.
We do not adopt CBO’s assumption that the growth rate of private-sector health care spending will slow substantially on its own while federal policies remain unchanged. While it is likely that the private sector (and to a lesser degree, state governments) will take steps to reduce the rate of growth of health care spending per beneficiary even if no changes are made in federal policies, it is extremely unlikely that federal policies will remain unchanged for decades. We believe that it is more useful, therefore, to assume that changes in private sector and state health policies will occur in concert with (and, at least in part, as a result of) changes in federal health policies.
Thus, our current-policy projections assume similar growth rates in all three major sectors — Medicare, Medicaid, and private health spending. This is also consistent with historical data that show that health care costs system-wide tend to rise at similar rates. As a result of this assumption, we project a larger decrease in tax revenues due to the growth in private health care spending than CBO does.
Projection Results
We project that once the economy recovers, deficits will be in the range of 5 percent to 6 percent of GDP over the next decade and will begin to grow rapidly not long after that, reaching 22 percent of GDP in 2050. Between now and 2050, expenditures will rise faster than revenues as a share of GDP.
Total non-interest expenditures are projected to reach 24.5 percent of GDP in 2050, compared with 19.2 percent of GDP in 2008. (See Table 2.) Between 2008 and 2050, expenditures for Social Security, Medicare, and Medicaid are expected to grow by 10.0 percent of GDP. All other non-interest expenditures are projected to shrink by 4.7 percent of GDP, because their costs will rise at a somewhat slower rate than GDP does.
| TABLE 2: | |||||||||
| Social Security | Medicare | Medicaid | Other Program Outlays | Total Program Outlays | Revenues | Interest | Surplus (+) / Deficits (-) | Debt Held by the Public (End of Year) | |
| 2000 | 4.2% | 2.0% | 1.2% | 8.7% | 16.1% | 20.9% | 2.3% | +2.4% | 35% |
| 2010 | 4.8% | 3.1% | 2.0% | 14.1% | 23.9% | 15.6% | 1.4% | -9.7% | 62% |
| 2019 | 5.2% | 4.1% | 2.0% | 8.7% | 20.0% | 17.8% | 4.3% | -6.4% | 86% |
| 2030 | 5.9% | 6.2% | 2.6% | 7.8% | 22.5% | 18.0% | 7.0% | -11.5% | 141% |
| 2040 | 5.9% | 7.8% | 3.3% | 6.9% | 23.8% | 18.0% | 10.8% | -16.6% | 218% |
| 2050 | 5.7% | 8.9% | 3.9% | 6.0% | 24.5% | 18.2% | 15.6% | -21.9% | 314% |
| Source: CBPP calculations based on CBO data. | |||||||||
At the same time, revenues will be somewhat lower in 2050 than they were in 2007, before the recession hit. Revenues, which stood at 20.9 percent of GDP in 2000 (a year of budget surplus), 18.8 percent of GDP in 2007, and 14.9 percent of GDP in 2009, are projected to recover gradually and be at 18.2 percent of GDP in 2050.
Budget surpluses have occurred in only four of the past 30 years, in 1998 through 2001. In each of these years, progressive tax policies (and a strong economy) helped to generate federal revenue collections of around 20 or 21 percent of GDP.
End Notes
[1] Automatic stabilizers — safety net programs whose outlays rise during recessions — along with temporary expenditures needed to stabilize the financial system and provide additional stimulus to the economy caused program expenditures to surge to 24.9 percent of GDP in 2009. Expenditures are projected to remain elevated for several years while the economy recovers. Thus, we use 2008, a more normal year, as the benchmark here.
[2] CBO judges that the health reform bills would reduce the deficit in the current decade and in subsequent decades, but it is difficult to quantify the resulting change in health care cost growth over the long run with much certainty. Historical trends strongly suggest that, even with reform, substantial additional steps to slow the rise of health care costs will be necessary in coming decades.
[3] See Congressional Budget Office, “The Long-Term Budget Outlook,” June 2009; Alan J. Auerbach and William G. Gale, “The Economic Crisis and the Fiscal Crisis: 2009 and Beyond: An Update,” September 2009; Government Accountability Office, “The Federal Government’s Long-Term Fiscal Outlook: Fall 2009 Update,” October 2009.
[4] In this analysis we, like most other fiscal policy analysts, use the “debt held by the public,” which includes securities sold to raise cash and excludes the special securities issued by the Treasury to federal trust funds such as Social Security (since those securities simply represent debt that one part of the government owes to another part).
[5] For more detailed discussion of how large deficits could gradually damage the economy and strain the federal budget, see Congressional Budget Office, “Long-Term Economic Effects of Chronically Large Federal Deficits,” October 13, 2005.
[6] See Robert E. Rubin, Peter R. Orszag, and Allen Sinai, “Sustained Budget Deficits: Longer-Run U.S. Economic Performance and the Risk of Financial and Fiscal Disarray,” Brookings Institution, January 5, 2004, http://www.brookings.edu/papers/2004/0105budgetdeficit_orszag.aspx.
In its most recent report, CBO computed the fiscal gap over three distinct periods — over 25 years (2009 through 2033), over 50 years (2009 through 2058), and over 75 years (2009 through 2083). Because the budget picture deteriorates over time, the longer the period, the larger the gap. See Box 1-1, “Calculating the Fiscal Gap,” in CBO, The Long-Term Budget Outlook (June 2009). As explained in the appendix, we modified certain CBO assumptions, but generally arrive at similar conclusions.
[8]] If every year the debt grows by the deficit (ignoring “other means of financing,” which are usually small), stabilizing the debt-to-GDP ratio means setting a goal whereby
Rearranging a few terms:
In CBO’s long-run projections, g (the growth rate of GDP) settles around 4 percent. After the economy has recovered from the current downturn, we estimate that the debt-to-GDP ratio will slightly exceed 70 percent. Keeping it there thus implies deficits of about 3 percent of GDP.
This rule relies solely on nominal growth in GDP, whether from real growth or inflation. While a nation may be tempted to “inflate away” its debt, that tactic works only if most of the debt is locked in for the long term at fixed interest rates. If a borrower must roll over large volumes of debt, and interest rates rise with inflation, the benefits of inflation do not last very long.
[9] See Robert Keith, “Deficit Impact of Reconciliation Legislation Enacted in 1990, 1993, and 1997,” Congressional Research Service, report RS22098, updated August 30, 2005, and Jerry Tempalski, “Revenue Effects of Major Tax Bills,” U.S. Department of Treasury, Office of Tax Analysis Working Paper 81, revised September 2006.
[10] Peterson-Pew Commission on Budget Reform, Red Ink Rising: A Call to Stem the Mounting Federal Debt, December 2009, available at www.crfb.org.
[11] It is true that an increase in the debt-to-GDP ratio above 60 percent would increase the potential for harm to the economy, but that is true for an increase in the debt-to-GDP ratio above 50 percent, 70 percent, or 80 percent. There is nothing special about an increase above 60 percent. Although there is little empirical basis for any particular debt-to-GDP target, Carmen M. Reinhart and Kenneth S. Rogoff have concluded that economic growth falters when government debt exceeds 90 percent of GDP. See Reinhart and Rogoff, “Growth in a Time of Debt,” available at http://www.aeaweb.org/aea/conference/program/retrieve.php?pdfid=416, forthcoming in American Economic Review, Vol. 100 No. 2, May 2010.
[12] For instance, Willem Buiter has written that “The Maastricht deficit and debt criteria were arbitrary and neither necessary nor sufficient for national fiscal-financial sustainability.” In “The ‘Sense and Nonsense of Maastricht’ revisited: What have we learnt about stabilization in the EMU?” http://www.nber.org/~wbuiter/sense.pdf
[13] See “Transcript of a Conference Call with IMF Senior Staffs on the Launch of The State of Public Finances: A Cross-Country Fiscal Monitor,” July 30, 2009, in which an IMF staff member responds to a question about the 60 percent criterion by stating: “On why we picked 60 percent, of course, there [is] no magic number, and that’s sort of just an illustrative number….Again, these are not targets. These are not ideal numbers. There’s no rule that says that it’s only sustainable if it’s above or below 60.” http://www.imf.org/external/np/tr/2009/tr073009a.htm
[14] See IMF, The State of Public Finances: A Cross-Country Fiscal Monitor, July 30, 2009, p. 18.
[15] Virginia P. Reno and Joni Lavery, “Fixing Social Security: Adequate Benefits, Adequate Financing,” National Academy of Social Insurance, October 2009.
[16] While this is an important step toward improving the efficiency of health care spending, even under this proposal the vast bulk of employer-provided health benefits would remain non-taxable.
[17] A number of health economists have said that most of the currently known ways to restrain the growth of health care costs are included in the current health care bills. For example, see Ron Brownstein, “A Milestone in the Health Care Journey,” Atlantic, November 21, 2009.
[18] The health reform bills passed by the House and Senate provide authority in some instances for the Secretary of Health and Human Services to implement further changes in Medicare and Medicaid without new action by Congress. For instance, both bills would establish a center for innovation within the Centers for Medicare and Medicaid Services to test and evaluate different payment structures and methods to foster patient-centered care, improve quality, and reduce the cost of care in Medicare and Medicaid. The Secretary is authorized to expand the scope and duration of the approaches being tested, including implementation on a nationwide basis, without any further congressional action, if they are found to reduce spending without reducing the quality of care.
[19] Congressional Budget Office, “The Budget and Economic Outlook: An Update,” August 2009; Congressional Budget Office, “The Long-Term Budget Outlook,” June 2009.
[20] Congress has enacted numerous tax provisions — including the corporate research and experimentation tax credit, the deduction of local and state taxes, and the deduction of expenses for classroom teachers — as “temporary measures” scheduled to expire after one or two years but Congress then regularly extends these measures.
[21] CBO’s long-term report featured two scenarios: the baseline extended and an alternative fiscal scenario. The alternative scenario resembles our assumptions in many key respects — for example, by assuming continuation of all of the 2001 and 2003 tax cuts and AMT relief, as well as modest increases in Medicare’s physician fees — and we generally use its growth rates, with adjustments as described in the text.
[22] Like CBO, we assume that Social Security and Medicare will pay benefits even after their trust funds are exhausted. (CBO assumes that the Medicare Hospital Insurance Trust Fund will be exhausted in 2017, and that the combined Old-Age, Survivors, and Disability Insurance Trust Funds — the formal name of Social Security — will be exhausted in 2043.)
[23] We derive the growth rate from CBO’s baseline extended scenario.
[24] Auerbach and Gale (September 2009), in contrast, assume that other spending will keep pace with GDP, but explicitly state that is because they assume that a richer society will want to spend more on discretionary spending, going beyond the current services provided by government.
More from the Authors

Areas of Expertise

Areas of Expertise