BEYOND THE NUMBERS
President’s Budget Would Provide More Vouchers to Help Families With Rising Housing Costs
President Biden’s 2023 budget proposes to expand and strengthen the Housing Choice Voucher program, the nation’s most important source of assistance to help people with low incomes afford safe, stable housing. The budget would provide housing vouchers to 200,000 additional households and make other improvements to enable the program to assist families more efficiently and effectively.
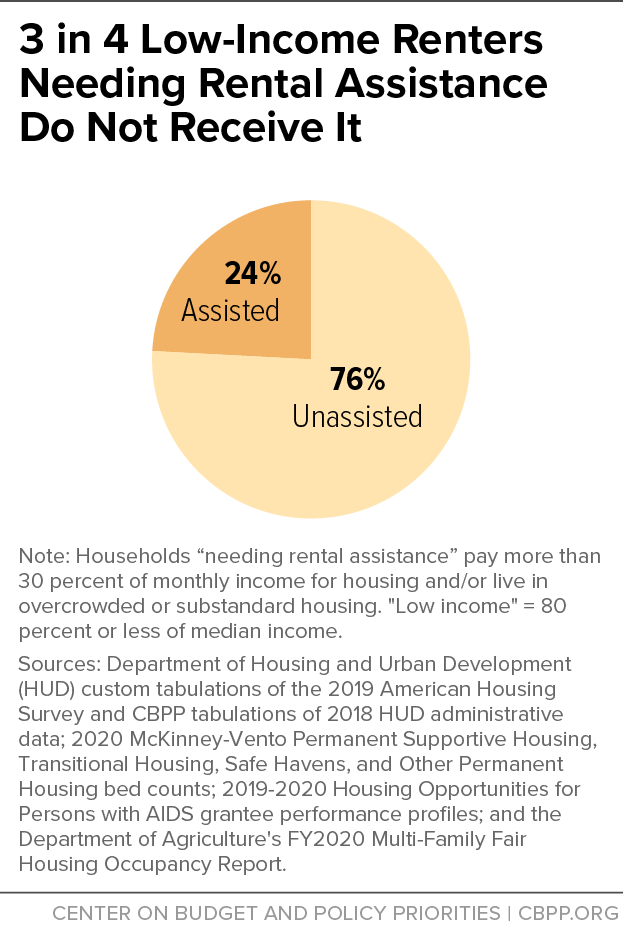
Today, vouchers help 2.3 million households cover rent and utility costs for modest housing of their choice in the private market. Research shows that vouchers are highly effective at reducing homelessness, overcrowding, and housing instability, but due to inadequate funding only 1 in 4 households eligible for a voucher receives any form of federal rental assistance (see figure).
President Biden has called for the voucher program ultimately to be extended to all eligible households both during the 2020 campaign and in 2021 as President. The 200,000 new vouchers included in his budget would take an important step toward that goal. The proposal would allow the Department of Housing and Urban Development (HUD) to institute program rules to ensure that a substantial portion of the new vouchers reach people who are experiencing or at risk of homelessness. This is an urgent goal since on a single night in January 2020 — the most recent national data available — more than 580,000 people experienced homelessness and the number of people living in tents and other unsheltered settings increased for the fifth consecutive year.
We estimate that the new vouchers would help over 430,000 people (in 200,000 households) in every state live in safe, stable housing, including 240,000 children, 76,000 people with disabilities, and 53,000 older adults. (See Table 1.) The vouchers would assist people of every race and ethnicity, with people of color accounting for 63 percent of those assisted. (See Table 2.) This reflects the fact that households of color are disproportionately likely to experience high rent burdens, overcrowding, evictions, and homelessness. The vouchers would help people in a wide range of communities: 36 percent of vouchers today are used in suburban areas and 11 percent in rural areas.
Rent and utility costs have increased sharply in recent months, and the voucher program is well-suited to deliver large-scale rental assistance to families during this period of rising costs. Emergency rental assistance funded through pandemic relief legislation has helped many renters hold on to their homes, but those funds are on pace to be largely exhausted nationally by the end of 2022 and some states and localities have already closed their programs to new applicants. The need for rental assistance, however, is likely to remain high, leaving many people at risk of eviction and homelessness. This makes it even more crucial that lawmakers provide more vouchers in 2023 and beyond.
The tight housing market has made it harder for renters — including those with vouchers — to find units they can rent. Nonetheless, state and local housing agencies have managed to put nearly all of the voucher funds they’ve received to use helping people in need — 96.2 percent on average in 2021 and 98.7 percent in early 2022, according to HUD data. (This excludes agencies participating in the Moving to Work demonstration, which allows them to shift funds from the voucher program to other purposes.) That figure has been even higher historically, averaging 99.9 percent from 2011-2020.
The President’s budget includes several proposals to help ensure that the voucher program fully uses available resources and to improve its effectiveness in other ways:
- It would provide $445 million for housing counseling, landlord outreach, and other services to help families with vouchers access a wider range of neighborhoods. Research shows that these services can be highly effective at helping families move to “high-opportunity” neighborhoods (such as those with high-performing schools) if they wish to do so, and that such moves can have strong positive effects on children’s chances of attending college and their adult earnings.
- It proposes to give HUD added authority to reallocate unused vouchers and voucher funds from housing agencies that aren’t using them to other agencies that are fully using their funds, with a preference for agencies that are located nearby. Hundreds of state and local housing agencies have used all of the voucher funding they’ve received during 2021 and early 2022 and could promptly use additional resources to help people in need.
- It would increase administrative funding for state and local voucher agencies by $603 million, a step that — together with a planned review of the formula for allocating those funds among agencies — would ensure that they have adequate funds to operate their programs effectively.
| TABLE 1 | |||||||||||||||||||||||
|---|---|---|---|---|---|---|---|---|---|---|---|---|---|---|---|---|---|---|---|---|---|---|---|
| Estimated Number of Households and People Assisted Through Housing Voucher Expansion Proposed in the President’s FY 2023 Budget, by State | |||||||||||||||||||||||
| State | Households | People | Female | Children (Under 18) | People With Disabilities | Older Adults (62 and older) | |||||||||||||||||
| Alabama | 1,800 | 3,900 | 2,300 | 1,300 | 700 | 300 | |||||||||||||||||
| Alaska | 500 | 1,100 | 600 | 400 | 200 | 100 | |||||||||||||||||
| Arizona | 3,800 | 8,300 | 4,500 | 2,800 | 1,300 | 900 | |||||||||||||||||
| Arkansas | 1,200 | 2,600 | 1,500 | 900 | 600 | 200 | |||||||||||||||||
| California | 43,700 | 94,500 | 51,400 | 30,500 | 12,800 | 11,400 | |||||||||||||||||
| Colorado | 3,300 | 7,200 | 3,900 | 2,100 | 1,200 | 800 | |||||||||||||||||
| Connecticut | 1,700 | 3,600 | 2,100 | 1,200 | 700 | 500 | |||||||||||||||||
| Delaware | 400 | 900 | 500 | 300 | 100 | 100 | |||||||||||||||||
| District of Columbia | 1,500 | 3,200 | 1,800 | 900 | 600 | 400 | |||||||||||||||||
| Florida | 11,000 | 23,800 | 13,400 | 7,500 | 3,800 | 3,300 | |||||||||||||||||
| Georgia | 4,700 | 10,200 | 5,900 | 3,700 | 1,600 | 900 | |||||||||||||||||
| Hawai’i | 1,600 | 3,400 | 1,800 | 1,100 | 500 | 500 | |||||||||||||||||
| Idaho | 800 | 1,700 | 900 | 500 | 400 | 200 | |||||||||||||||||
| Illinois | 5,700 | 12,200 | 7,000 | 3,900 | 2,000 | 1,500 | |||||||||||||||||
| Indiana | 2,700 | 5,800 | 3,300 | 1,900 | 1,200 | 600 | |||||||||||||||||
| Iowa | 1,200 | 2,600 | 1,500 | 700 | 500 | 300 | |||||||||||||||||
| Kansas | 1,100 | 2,500 | 1,400 | 700 | 600 | 300 | |||||||||||||||||
| Kentucky | 1,900 | 4,000 | 2,300 | 1,400 | 1,000 | 300 | |||||||||||||||||
| Louisiana | 2,000 | 4,200 | 2,500 | 1,600 | 700 | 400 | |||||||||||||||||
| Maine | 700 | 1,500 | 800 | 400 | 500 | 200 | |||||||||||||||||
| Maryland | 2,800 | 6,000 | 3,500 | 2,000 | 1,000 | 800 | |||||||||||||||||
| Massachusetts | 5,300 | 11,500 | 6,600 | 3,200 | 2,400 | 1,800 | |||||||||||||||||
| Michigan | 4,100 | 8,900 | 5,000 | 2,800 | 2,000 | 1,000 | |||||||||||||||||
| Minnesota | 2,800 | 6,000 | 3,400 | 1,800 | 1,400 | 1,000 | |||||||||||||||||
| Mississippi | 900 | 2,000 | 1,200 | 800 | 400 | 100 | |||||||||||||||||
| Missouri | 2,700 | 5,900 | 3,400 | 1,900 | 1,300 | 700 | |||||||||||||||||
| Montana | 500 | 1,100 | 600 | 300 | 300 | 100 | |||||||||||||||||
| Nebraska | 900 | 1,900 | 1,100 | 600 | 400 | 300 | |||||||||||||||||
| Nevada | 2,200 | 4,700 | 2,500 | 1,500 | 900 | 600 | |||||||||||||||||
| New Hampshire | 600 | 1,300 | 700 | 300 | 400 | 200 | |||||||||||||||||
| New Jersey | 4,700 | 10,100 | 5,700 | 3,300 | 1,600 | 1,500 | |||||||||||||||||
| New Mexico | 1,100 | 2,400 | 1,400 | 900 | 400 | 200 | |||||||||||||||||
| New York | 24,900 | 54,000 | 30,400 | 16,100 | 9,200 | 8,500 | |||||||||||||||||
| North Carolina | 4,400 | 9,600 | 5,500 | 3,200 | 1,800 | 1,000 | |||||||||||||||||
| North Dakota | 300 | 600 | 400 | 100 | 100 | 100 | |||||||||||||||||
| Ohio | 5,200 | 11,300 | 6,400 | 3,800 | 2,600 | 1,300 | |||||||||||||||||
| Oklahoma | 1,700 | 3,600 | 2,100 | 1,300 | 800 | 400 | |||||||||||||||||
| Oregon | 3,900 | 8,500 | 4,600 | 2,400 | 1,900 | 1,100 | |||||||||||||||||
| Pennsylvania | 5,800 | 12,600 | 7,100 | 3,800 | 3,000 | 1,700 | |||||||||||||||||
| Puerto Rico | 1,000 | N/A | N/A | N/A | N/A | N/A | |||||||||||||||||
| Rhode Island | 500 | 1,200 | 700 | 300 | 300 | 200 | |||||||||||||||||
| South Carolina | 2,000 | 4,200 | 2,500 | 1,400 | 800 | 400 | |||||||||||||||||
| South Dakota | 400 | 800 | 500 | 200 | 200 | 100 | |||||||||||||||||
| Tennessee | 3,000 | 6,500 | 3,700 | 2,300 | 1,300 | 600 | |||||||||||||||||
| Texas | 12,500 | 26,900 | 15,200 | 10,000 | 4,000 | 2,500 | |||||||||||||||||
| Utah | 1,100 | 2,400 | 1,300 | 800 | 300 | 200 | |||||||||||||||||
| Vermont | 400 | 800 | 400 | 200 | 200 | 100 | |||||||||||||||||
| Virginia | 3,200 | 7,000 | 4,000 | 2,300 | 1,200 | 700 | |||||||||||||||||
| Washington | 6,100 | 13,300 | 7,300 | 3,900 | 2,700 | 1,700 | |||||||||||||||||
| West Virginia | 600 | 1,400 | 800 | 400 | 300 | 100 | |||||||||||||||||
| Wisconsin | 2,400 | 5,200 | 2,900 | 1,400 | 1,200 | 800 | |||||||||||||||||
| Wyoming | 200 | 500 | 300 | 100 | 100 | 100 | |||||||||||||||||
| Total U.S. | 200,000 | 432,000 | 240,000 | 137,000 | 76,000 | 53,000 | |||||||||||||||||
| TABLE 2 | |||||||||||||
|---|---|---|---|---|---|---|---|---|---|---|---|---|---|
| People Assisted Through Housing Voucher Expansion Proposed in President’s FY 2023 Budget, Estimated Share by State and Race/Ethnicity | |||||||||||||
| State | American Indian/Alaska Native | Asian/Pacific Islander | Black | Latino | Multiracial | White | |||||||
| Alabama | 0% | 1% | 51% | 8% | 2% | 37% | |||||||
| Alaska | 16% | 10% | 5% | 17% | 6% | 45% | |||||||
| Arizona | 4% | 3% | 8% | 44% | 3% | 37% | |||||||
| Arkansas | 0% | 1% | 35% | 9% | 3% | 51% | |||||||
| California | 0% | 12% | 9% | 51% | 3% | 24% | |||||||
| Colorado | 1% | 4% | 8% | 34% | 4% | 49% | |||||||
| Connecticut | 0% | 4% | 20% | 39% | 3% | 34% | |||||||
| Delaware | 0% | 4% | 38% | 21% | 2% | 35% | |||||||
| District of Columbia | 1% | 3% | 70% | 12% | 1% | 13% | |||||||
| Florida | 0% | 2% | 27% | 39% | 2% | 30% | |||||||
| Georgia | 0% | 3% | 52% | 15% | 3% | 27% | |||||||
| Hawai’i | 0% | 34% | 3% | 20% | 17% | 25% | |||||||
| Idaho | 1% | 1% | 1% | 19% | 3% | 74% | |||||||
| Illinois | 0% | 5% | 36% | 21% | 3% | 34% | |||||||
| Indiana | 0% | 4% | 27% | 11% | 4% | 55% | |||||||
| Iowa | 1% | 5% | 14% | 12% | 3% | 65% | |||||||
| Kansas | 1% | 3% | 18% | 17% | 5% | 56% | |||||||
| Kentucky | 0% | 2% | 18% | 6% | 4% | 70% | |||||||
| Louisiana | 0% | 1% | 60% | 8% | 2% | 29% | |||||||
| Maine | 1% | 1% | 4% | 3% | 6% | 84% | |||||||
| Maryland | 0% | 5% | 46% | 18% | 3% | 27% | |||||||
| Massachusetts | 0% | 8% | 13% | 29% | 3% | 45% | |||||||
| Michigan | 1% | 3% | 37% | 7% | 4% | 47% | |||||||
| Minnesota | 3% | 6% | 25% | 11% | 5% | 50% | |||||||
| Mississippi | 0% | 1% | 67% | 3% | 2% | 27% | |||||||
| Missouri | 1% | 3% | 29% | 6% | 4% | 57% | |||||||
| Montana | 10% | 1% | 0% | 6% | 5% | 77% | |||||||
| Nebraska | 1% | 4% | 16% | 19% | 4% | 56% | |||||||
| Nevada | 1% | 6% | 21% | 36% | 4% | 32% | |||||||
| New Hampshire | 0% | 4% | 4% | 9% | 3% | 80% | |||||||
| New Jersey | 0% | 6% | 23% | 39% | 2% | 29% | |||||||
| New Mexico | 10% | 1% | 3% | 57% | 2% | 27% | |||||||
| New York | 0% | 10% | 22% | 35% | 2% | 30% | |||||||
| North Carolina | 1% | 2% | 41% | 14% | 3% | 39% | |||||||
| North Dakota | 11% | 2% | 6% | 7% | 3% | 71% | |||||||
| Ohio | 0% | 3% | 32% | 7% | 5% | 52% | |||||||
| Oklahoma | 8% | 2% | 19% | 13% | 10% | 48% | |||||||
| Oregon | 1% | 5% | 5% | 20% | 6% | 62% | |||||||
| Pennsylvania | 0% | 4% | 24% | 20% | 4% | 48% | |||||||
| Rhode Island | 1% | 4% | 9% | 30% | 3% | 53% | |||||||
| South Carolina | 0% | 2% | 49% | 10% | 2% | 36% | |||||||
| South Dakota | 27% | 2% | 3% | 7% | 3% | 57% | |||||||
| Tennessee | 0% | 2% | 38% | 10% | 3% | 47% | |||||||
| Texas | 0% | 4% | 23% | 46% | 2% | 24% | |||||||
| Utah | 2% | 5% | 6% | 25% | 3% | 59% | |||||||
| Vermont | 1% | 3% | 4% | 2% | 3% | 86% | |||||||
| Virginia | 0% | 5% | 34% | 17% | 4% | 39% | |||||||
| Washington | 1% | 9% | 10% | 20% | 7% | 54% | |||||||
| West Virginia | 0% | 1% | 10% | 2% | 5% | 82% | |||||||
| Wisconsin | 1% | 4% | 24% | 12% | 4% | 55% | |||||||
| Wyoming | 1% | 1% | 3% | 16% | 4% | 76% | |||||||
| Total U.S. | 1% | 6% | 24% | 29% | 3% | 37% | |||||||