BEYOND THE NUMBERS
The Census Bureau’s release next week of updated poverty figures may lead some people to compare today’s poverty rate to those of 1960s and conclude that the last half-century of federal efforts to alleviate poverty have largely failed.
But that’s simply not accurate. Comparing today’s official poverty rate with those of the 1960s yields highly distorted results because the official poverty measure captures so little of the poverty relief that today’s safety net now provides, as our new analysis explains.
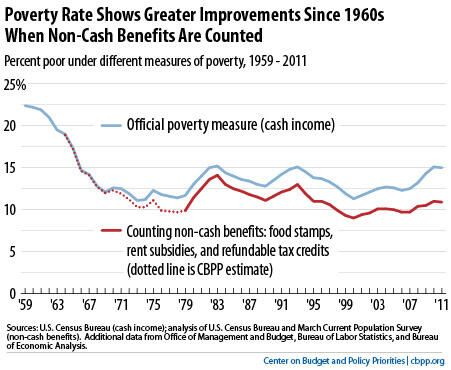
Most analysts recommend using a poverty measure that accounts for major non-cash benefits that the official poverty measure leaves out — namely, SNAP (the Supplemental Nutrition Assistance Program, formerly called food stamps), rent subsidies, and tax credits for working families. Such a measure shows that poverty is considerably lower today than it was throughout the 1960s, despite today’s weaker economy.
This expanded poverty measure also reveals the strong anti-poverty effects of non-cash benefits. Taken together, non-cash benefits and tax credits lifted 12.6 million people above the official poverty line and lowered the poverty rate for 2011 from 15.0 percent to 10.9 percent. SNAP alone lifted 3.9 million people out of poverty.
Under this expanded measure, poverty trends since the 1960s are more clearly positive than they appear under the official poverty rate (see chart).

Similarly, an analysis of average incomes of the poorest fifth of Americans that counts non-cash benefits and tax credits also shows important progress. Their average household income was more than 75 percent higher in 2011 than in 1964, when President Johnson announced the War on Poverty. (That figure is adjusted for inflation and changes in household size.)
Despite these gains, income inequality widened after the early 1970s. Income growth for households in the middle and lower parts of the scale slowed sharply, while incomes at the top continued to grow robustly. Incomes of the poorest one-fifth of households grew just 19 percent, adjusted for inflation, between 1973 and 2007 (both years in which the economy was strong).
Safety net programs — although effective over the past 50 years — continue to face the strong headwind of persistently low wages for many workers and rising inequality. Although we’ve made significant progress in fighting poverty over the last 50 years, it hasn’t been enough. There is more work to do.
