BEYOND THE NUMBERS
Farm Bill Would Impose SNAP Benefit Cliff, Taking Assistance Away from Hundreds of Thousands of Low-Income Working Households
The pending House farm bill would take away SNAP (formerly food stamps) from about 1 million people in nearly 400,000 households by restricting the “categorical eligibility” option — thus, no longer letting states raise SNAP’s gross income limit to extend benefits to more low-income households. Almost all benefits for households that qualify due to a higher limit go to working families, and restricting this state option would make it harder for them to put food on the table and get back on their feet, contradicting House Agriculture Committee Chairman Mike Conaway’s stated goal of encouraging work through the farm bill.
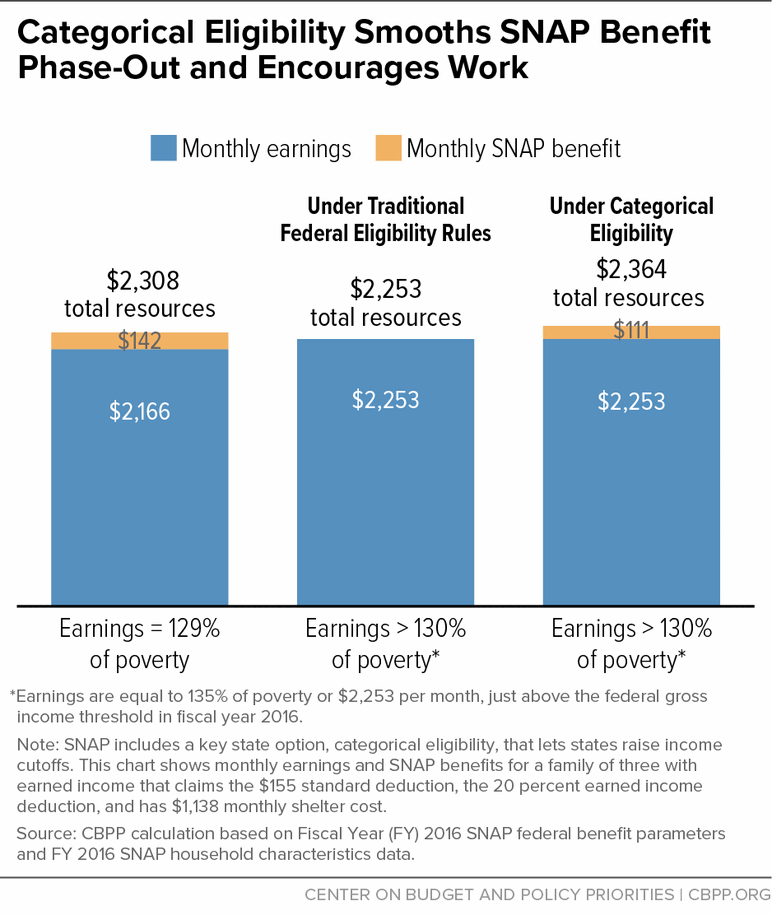
Many working families have gross income just above SNAP’s income threshold (130 percent of the federal poverty line (FPL), or $2,213 per month for a family of three in fiscal year 2018) but face significant expenses, including costly housing and child care, that can put a healthy diet out of reach. Lifting the limit helps promote work by slowly phasing out SNAP benefits as a household gains more earnings. But the farm bill would create a benefit cliff such that a household close to the income threshold that accepts a modest wage increase or more hours of work that pushes its earnings slightly above the federal threshold would lose all its SNAP benefits, which could make the family worse off than before the raise or hour increase (see chart). The typical household with children that benefits from this state option receives about $100 a month in SNAP.
Thirty-one states now use the option to provide food assistance to working-poor households as they move toward self-sufficiency. The table below shows the estimated number of households and individuals in each state that would lose SNAP benefits from states reimposing a gross income cutoff at 130 percent of poverty. These estimates are based on 2015 and 2016 data on SNAP households that states and the U.S. Agriculture Department collected as part of the SNAP quality control process.
| Estimates of Households and Individuals Losing SNAP Due to Rolling Back State Option for a Higher Gross Income Limit Under Expanded Categorical Eligibility | |||
|---|---|---|---|
| (For states that have adopted the option, based on number participating in 2015 and 2016a) | |||
| State/Territory | Gross Income Limit | Households | Individuals |
| Arizona | 185% FPL | 12,000 | 30,000 |
| California | 200% | 37,000 | 85,000 |
| Connecticut | 185% | 11,000 | 24,000 |
| Delaware | 200% | 3,000 | 6,000 |
| District of Columbiab | 200% | Less than 1,000 | 1,000 |
| Florida | 200% | 60,000 | 130,000 |
| Hawaii | 200% | 3,000 | 8,000 |
| Illinoisb | 165% | 3,000 | 7,000 |
| Iowa | 160% | 6,000 | 16,000 |
| Maine | 185% | 3,000 | 8,000 |
| Maryland | 200% | 15,000 | 37,000 |
| Massachusetts | 200% | 17,000 | 45,000 |
| Michigan | 200% | 20,000 | 45,000 |
| Minnesota | 165% | 6,000 | 20,000 |
| Montana | 200% | 2,000 | 4,000 |
| Nevada | 200% | 6,000 | 13,000 |
| New Hampshire | 185% | 2,000 | 7,000 |
| New Jersey | 185% | 12,000 | 35,000 |
| New Mexico | 165% | 4,000 | 10,000 |
| New Yorkb | 150%/200%c | 15,000 | 40,000 |
| North Carolina | 200% | 20,000 | 50,000 |
| North Dakota | 200% | 1,000 | 3,000 |
| Oregon | 200% | 15,000 | 37,000 |
| Pennsylvania | 160% | 30,000 | 65,000 |
| Rhode Island | 185% | 4,000 | 9,000 |
| Texas | 165% | 45,000 | 125,000 |
| Vermont | 185% | 3,000 | 7,000 |
| Washington | 200% | 25,000 | 60,000 |
| Wisconsin | 200% | 13,000 | 30,000 |
| Guam | 165% | 1,000 | 2,000 |
| Virgin Islandsb | 175% | Less than 1,000 | 1,000 |
| United States | 31 states have adopted | About 400,000 | About 960,000 |