State Outreach Can Get Stimulus Payments to as Many Eligible Residents as Possible
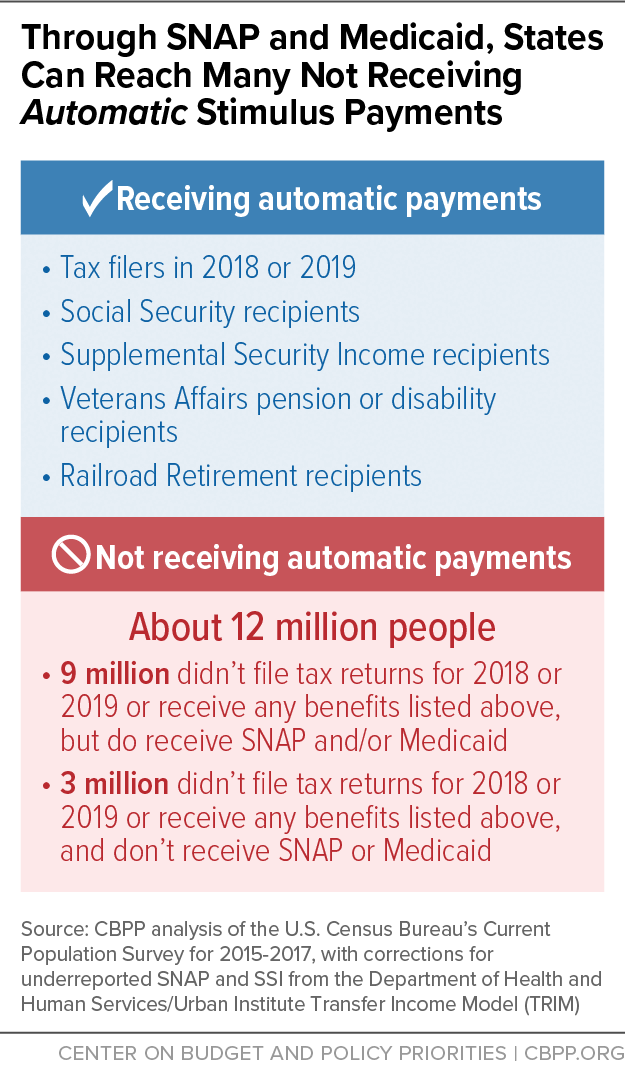
About 12 million Americans risk missing out on the CARES Act’s stimulus payments because they did not receive payments automatically from the IRS. State-led outreach efforts can help families apply for these payments,[1] which can enable them to afford the basics while also keeping an estimated $12 billion in payments flowing through state economies during the pandemic and economic crisis.
People not receiving automatic payments include families being paid too little to meet annual tax filing thresholds, people who have been disconnected from work opportunities for a long period, and many adults not raising children in the home. (See Figure 1 for more detail.) People of color are overrepresented in this group because they are likelier to have lower incomes due to historical racism and ongoing bias and discrimination. Ensuring that people of color who are paid low wages receive the stimulus payments for which they qualify is especially important given emerging evidence that the pandemic’s health and economic effects are hitting them hardest.[2]
Governors and other state officials can play a central role in reaching these 12 million people, up to 9 million of whom participate in SNAP (formerly food stamps) or Medicaid. Because states and counties administer these programs, they can notify enrolled families about the payments, and provide resources to help fill out the form for those who face barriers such as a lack of internet access. They can also partner with community-based organizations to reach the roughly 3 million people not connected to SNAP or Medicaid, such as families experiencing housing instability.
| TABLE 1 | ||||
|---|---|---|---|---|
| Estimated People Missed by Automatic Payments, by State | ||||
| State | State residents missed | Total potential payments (in millions) | Those receiving SNAP and/or Medicaid benefits | |
| Number receiving benefits | Potential payments (in millions) | |||
| United States | 12,399,000 | $12,000 | 9,270,000 | $9,000 |
| Alabama | 267,000 | $264 | 220,000 | $209 |
| Alaska | 32,000 | $31 | 26,000 | $24 |
| Arizona | 267,000 | $274 | 200,000 | $198 |
| Arkansas | 143,000 | $137 | 110,000 | $101 |
| California | 1,484,000 | $1,499 | 1,082,000 | $1,035 |
| Colorado | 152,000 | $160 | * | * |
| Connecticut | 108,000 | $109 | * | * |
| Delaware | 34,000 | $37 | 27,000 | $28 |
| District of Columbia | 46,000 | $47 | 35,000 | $35 |
| Florida | 991,000 | $1,017 | 750,000 | $742 |
| Georgia | 505,000 | $506 | 383,000 | $365 |
| Hawaii | 50,000 | $53 | 33,000 | $33 |
| Idaho | 42,000 | $44 | * | * |
| Illinois | 392,000 | $401 | 312,000 | $309 |
| Indiana | 214,000 | $206 | 162,000 | $146 |
| Iowa | 64,000 | $65 | * | * |
| Kansas | 100,000 | $103 | * | * |
| Kentucky | 209,000 | $206 | 171,000 | $162 |
| Louisiana | 303,000 | $302 | 233,000 | $ 221 |
| Maine | * | * | * | * |
| Maryland | 147,000 | $157 | * | * |
| Massachusetts | 223,000 | $232 | 159,000 | $158 |
| Michigan | 369,000 | $361 | 308,000 | $293 |
| Minnesota | 122,000 | $127 | * | * |
| Mississippi | 185,000 | $180 | 145,000 | $133 |
| Missouri | 197,000 | $202 | 143,000 | $140 |
| Montana | 25,000 | $25 | 19,000 | $18 |
| Nebraska | * | * | * | * |
| Nevada | 112,000 | $112 | 87,000 | $83 |
| New Hampshire | * | * | * | * |
| New Jersey | 276,000 | $287 | 186,000 | $182 |
| New Mexico | 124,000 | $124 | 105,000 | $101 |
| New York | 814,000 | $834 | 625,000 | $616 |
| North Carolina | 471,000 | $474 | 340,000 | $324 |
| North Dakota | 24,000 | $24 | 16,000 | $15 |
| Ohio | 489,000 | $466 | 394,000 | $358 |
| Oklahoma | 165,000 | $166 | 130,000 | $126 |
| Oregon | 158,000 | $159 | 118,000 | $113 |
| Pennsylvania | 449,000 | $438 | 363,000 | $337 |
| Rhode Island | 37,000 | $39 | 30,000 | $31 |
| South Carolina | 273,000 | $262 | 213,000 | $194 |
| South Dakota | 34,000 | $32 | 27,000 | $24 |
| Tennessee | 280,000 | $288 | 215,000 | $ 213 |
| Texas | 1,024,000 | $1,010 | 685,000 | $624 |
| Utah | 57,000 | $58 | * | * |
| Vermont | 17,000 | $16 | 14,000 | $13 |
| Virginia | 321,000 | $326 | 191,000 | $177 |
| Washington | 228,000 | $228 | 185,000 | $179 |
| West Virginia | 115,000 | $112 | 100,000 | $94 |
| Wisconsin | 140,000 | $142 | * | * |
| Wyoming | 16,000 | $16 | * | * |
| TABLE 2 | |||||
|---|---|---|---|---|---|
| Estimated People Missed by Automatic Payments Who Receive SNAP Benefits | |||||
| State | State residents missed | Those receiving SNAP benefits | Potential payments, in millions of dollars | ||
| Households | All individuals | Children (under 17 years) | |||
| United States | 12,399,000 | 3,270,000 | 6,534,000 | 3,024,000 | $5,700 |
| Alabama | 267,000 | 45,500 | 99,600 | 47,700 | $86 |
| Alaska | 32,000 | 7,900 | 17,700 | 7,700 | $16 |
| Arizona | 267,000 | 68,500 | 133,000 | 56,300 | $120 |
| Arkansas | 143,000 | 20,800 | 46,800 | 23,500 | $40 |
| California | 1,484,000 | 543,600 | 1,095,100 | 548,900 | $930 |
| Colorado | 152,000 | 35,200 | 78,700 | 42,200 | $65 |
| Connecticut | 108,000 | 39,100 | 65,400 | 22,800 | $63 |
| Delaware | 34,000 | 11,300 | 22,800 | 11,100 | $20 |
| District of Columbia | 46,000 | 13,200 | 23,500 | 9,300 | $22 |
| Florida | 991,000 | 245,800 | 437,400 | 184,000 | $396 |
| Georgia | 505,000 | 151,800 | 330,400 | 158,500 | $286 |
| Hawaii | 50,000 | 12,100 | 22,800 | 9,500 | $21 |
| Idaho | 42,000 | 7,300 | 18,800 | 10,800 | $15 |
| Illinois | 392,000 | 172,000 | 315,900 | 129,200 | $289 |
| Indiana | 214,000 | 34,600 | 79,200 | 39,900 | $67 |
| Iowa | 64,000 | 26,300 | 55,600 | 27,900 | $47 |
| Kansas | 100,000 | 9,100 | 21,600 | 11,800 | $18 |
| Kentucky | 209,000 | 49,700 | 95,900 | 36,400 | $90 |
| Louisiana | 303,000 | 48,300 | 113,300 | 60,400 | $94 |
| Maine | * | 6,900 | 14,900 | 6,900 | $13 |
| Maryland | 147,000 | 67,300 | 121,800 | 50,000 | $111 |
| Massachusetts | 223,000 | 56,100 | 108,200 | 48,200 | $96 |
| Michigan | 369,000 | 93,500 | 159,100 | 53,100 | $154 |
| Minnesota | 122,000 | 26,100 | 49,500 | 27,100 | $40 |
| Mississippi | 185,000 | 41,600 | 88,800 | 40,800 | $78 |
| Missouri | 197,000 | 38,400 | 86,300 | 45,700 | $72 |
| Montana | 25,000 | 5,100 | 11,600 | 5,400 | $10 |
| Nebraska | * | 9,600 | 20,900 | 11,000 | $17 |
| Nevada | 112,000 | 38,300 | 69,700 | 28,400 | $64 |
| New Hampshire | * | 4,400 | 9,900 | 4,900 | $8 |
| New Jersey | 276,000 | 66,800 | 139,800 | 76,800 | $114 |
| New Mexico | 124,000 | 27,000 | 56,800 | 25,200 | $51 |
| New York | 814,000 | 188,600 | 351,200 | 152,500 | $315 |
| North Carolina | 471,000 | 120,900 | 241,400 | 110,200 | $213 |
| North Dakota | 24,000 | 3,400 | 8,400 | 4,400 | $7 |
| Ohio | 489,000 | 92,900 | 179,800 | 78,100 | $161 |
| Oklahoma | 165,000 | 31,100 | 74,000 | 38,200 | $62 |
| Oregon | 158,000 | 50,600 | 92,700 | 34,400 | $87 |
| Pennsylvania | 449,000 | 105,500 | 211,700 | 95,200 | $187 |
| Rhode Island | 37,000 | 11,200 | 19,900 | 7,700 | $18 |
| South Carolina | 273,000 | 58,500 | 134,200 | 68,900 | $113 |
| South Dakota | 34,000 | 5,500 | 13,900 | 7,600 | $11 |
| Tennessee | 280,000 | 80,700 | 161,400 | 70,100 | $145 |
| Texas | 1,024,000 | 290,500 | 610,000 | 300,700 | $521 |
| Utah | 57,000 | 13,900 | 33,200 | 18,600 | $27 |
| Vermont | 17,000 | 2,500 | 5,100 | 2,300 | $4 |
| Virginia | 321,000 | 53,000 | 126,000 | 65,700 | $105 |
| Washington | 228,000 | 68,900 | 118,800 | 47,100 | $110 |
| West Virginia | 115,000 | 25,100 | 50,800 | 20,600 | $47 |
| Wisconsin | 140,000 | 34,800 | 67,800 | 28,500 | $61 |
| Wyoming | 16,000 | 1,800 | 4,700 | 2,500 | $4 |
End Notes
[1] Chuck Marr et al., “Aggressive State Outreach Can Help Reach the 12 Million Non-Filers Eligible for Stimulus Payments,” CBPP, updated June 23, 2020, https://www.cbpp.org/research/federal-tax/aggressive-state-outreach-can-help-reach-the-12-million-non-filers-eligible-for.
[2] Erica Williams and Cortney Sanders, “3 Principles for an Antiracist, Equitable State Response to COVID-19 — and a Stronger Recovery,” CBPP, May 21, 2020, https://www.cbpp.org/research/state-budget-and-tax/3-principles-for-an-anti-racist-equitable-state-response-to-covid-19.