Kansas Provides Compelling Evidence of Failure of "Supply-Side" Tax Cuts
The deep income cuts that Kansas enacted in 2012 and 2013 for many business owners and other high-income Kansans failed to achieve their goal of boosting business formation and job creation, and lawmakers substantially repealed the tax cuts earlier this year. The Kansas experience adds to the already compelling evidence that cutting taxes does not improve state economic performance.Former supporters have offered explanations for this failure to prevent the Kansas experience from discrediting “supply-side” economic strategies more broadly. But the evidence does not support these explanations. Rather, the Kansas experience adds to the already compelling evidence that cutting taxes does not improve state economic performance.
In 2012 and 2013, at the urging of Governor Sam Brownback, lawmakers cut the top rate of the state’s income tax by almost 30 percent and the tax rate on certain business profits to zero. Under “supply-side” economic theory, these deep tax cuts should have acted — as Brownback then predicted — like “a shot of adrenaline into the heart of the Kansas economy,” stimulating strong growth in economic output, job creation, and new business formation. But in reality, Kansas underperformed most neighboring states and the nation on all of those measures after the tax cuts. For example:
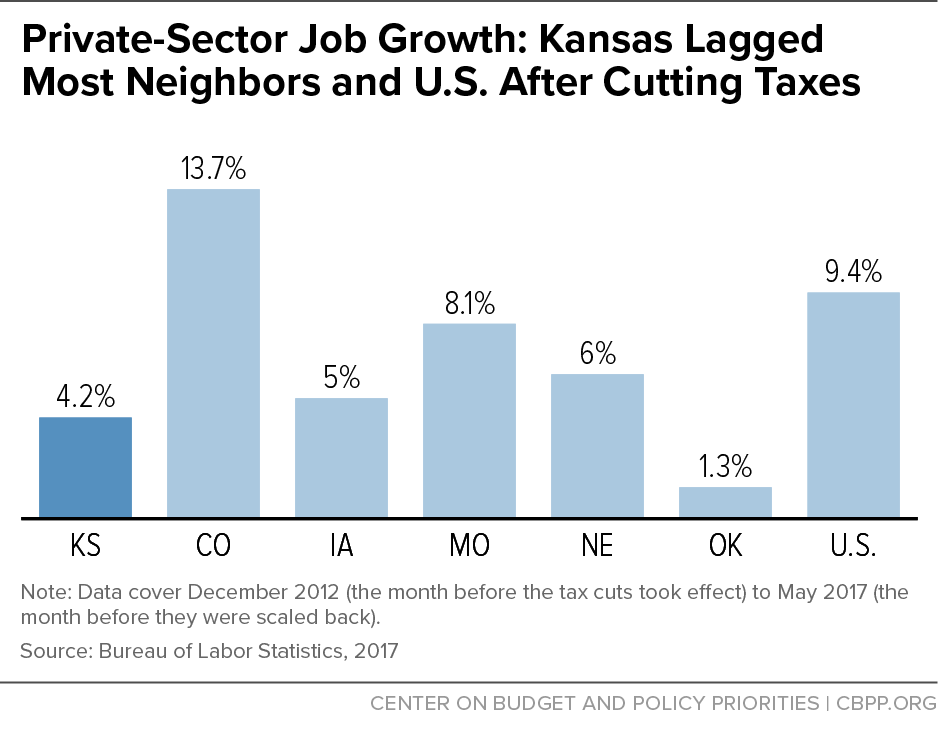
- Kansas’ 4.2 percent private-sector job growth from December 2012 (the month before the tax cuts took effect) to May 2017 (the month before they were repealed) was lower than all of its neighbors except Oklahoma and less than half of the 9.4 percent job growth in the United States.
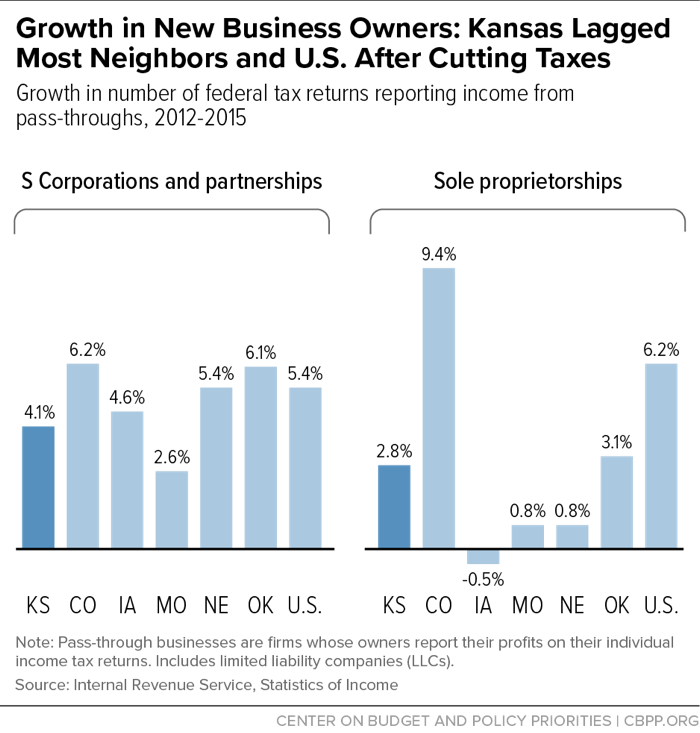
- Likewise, the number of Kansas residents reporting income on their federal tax returns from a partnership or “S corporation” (two of the main types of businesses that the tax cuts exempted from income tax) grew by 4.1 percent between 2012 and 2015, well below the 5.4 percent growth for the United States and below all of Kansas’ neighbors except Missouri.
Moreover, Kansas revenues plunged, leading to cuts to education and other vital services and downgrades in the state’s bond rating. On June 6, 2017, the legislature terminated what Brownback had termed a “real live experiment” in supply-side tax policy, repealing the business profits exemption and moving income tax rates back toward where they had started.
Some conservative analysts and organizations now claim the experiment was contaminated by the state’s failure to reduce spending, coincidental declines in some major Kansas industries, and widespread abuse of the business profits exemption (with large numbers of filers restructuring their businesses solely to benefit from the exemption rather than for any business purpose). These claims are not valid:
- State spending was sharply constrained, falling between the 2012 and 2016 budget years by 5.5 percent on a per-person basis, after adjusting for inflation. Moreover, had the state cut spending more deeply, job creation and economic growth would have slowed even more. To forestall deeper spending cuts, Kansas increased its sales tax to replace some of the lost income tax revenue — a policy choice that many of these same critics frequently claim will boost state economies but didn’t in Kansas’ case.
- Kansas has suffered from downturns in its aircraft manufacturing and energy production sectors the past several years, but these sectors are too small a share of its economy to account for much of its underperformance relative to its neighbors and the United States. And the downturn in the agriculture sector was actually less severe in Kansas than in most of its neighbors and the United States overall.
- Under supply-side theory, regardless of whether the exemption led to widespread tax avoidance, it should also have prompted the formation of many new Kansas businesses, such as by tipping their potential “bottom lines” from unprofitable to profitable and by attracting pass-through businesses from other states. Yet there’s no evidence that the exemption significantly increased the number of pass-through businesses. Moreover, the available evidence suggests that the amount of business restructuring aimed at tax avoidance that occurred was relatively modest. For example, a sophisticated statistical analysis found no evidence of artificial formation of partnerships or S corporations and only modest evidence of artificial formation of sole proprietorships. The data most widely cited to support the claim of substantial tax avoidance are now known to be erroneous.
The dismal results of the 2012-17 Kansas experiment are consistent with the majority of academic studies on the relationship between state personal income tax levels and state economic performance — and with the experience of most states that have pursued similar policies. (Indeed, three academic studies of the effects of the Brownback tax cuts have themselves concluded that they did not stimulate growth.) State policymakers seeking to boost their state’s economies and improve the well-being of their constituents should reject reckless tax cutting and instead focus on improving the quality of their education systems and infrastructure and developing targeted policies to encourage entrepreneurship, rural development, and a more diversified economic base.
Kansas Tax Cuts Among Deepest State Tax Cuts Ever Enacted
Governor Brownback took office in January 2011. Later that year, his administration contracted with economist Arthur Laffer to help develop and promote a tax cut plan aimed at stimulating economic and job growth.[1] Since 2008, Laffer has co-authored the American Legislative Exchange Council’s (ALEC) annual Rich States, Poor States report, which purports to show that the economies of the nine states without a personal income tax vastly outperform the states with relatively high income taxes.[2] The report’s principal policy goal is to encourage states to phase out personal income taxes as quickly as possible.
Brownback released his tax plan in January 2012.[3] Its key proposals were cutting the three income tax brackets to two, reducing the top rate from 6.45 percent to 4.9 percent, and eliminating taxation of profits from sole proprietorships, farms, partnerships, Subchapter S corporations, and limited liability companies (LLCs). These are types of “pass-through” businesses — that is, firms whose profits are not taxed at the business level but instead passed through to the owners and taxed at the owners’ personal income tax rates.[4]
Brownback claimed that the package was “close to revenue neutral” because it included several revenue-raising offsets: eliminating all itemized deductions (for example, mortgage interest and charitable contributions), repealing most tax credits (including the earned income tax credit for low-income workers), raising severance taxes on some oil and gas producers, and cancelling a previously scheduled reduction in the sales tax rate from 6.3 percent to 5.7 percent.[5] Finally, Brownback proposed automatically dedicating all future revenue growth over 2 percent annually to additional cuts in personal and corporate income taxes until both were eliminated. This proposal became known as the “march to zero.”
Lawmakers enacted all of the proposed tax cuts in Brownback’s package but did not repeal itemized deductions or the earned income credit or suspend the scheduled sales tax reduction. As a result, the legislation was scored as losing $4.5 billion in revenue through the 2018 fiscal year.[6] Nonetheless, in 2013 Brownback proposed further income tax cuts, including a reduction in the top rate from 4.9 percent to 3.5 percent (effective in 2017). He again recommended that lawmakers partially offset the revenue loss from both the 2012 legislation and the new rate cuts by cancelling the scheduled drop in the sales tax rate and eliminating the deductions for mortgage interest and property taxes. Finally, he again proposed that additional income tax cuts automatically take effect in the future when revenue growth exceeded a set threshold (4 percent, rather than the 2 percent he had recommended the previous year).[7]
Once again, the legislature gave Brownback most, but not all, of what he requested. The final 2013 legislation instituted a three-step cut in the top income tax rate to 3.9 percent in 2018 (rather than 3.5 percent in 2017, as Brownback had proposed) and restored the sales tax rate to 6.15 percent rather than the 6.3 percent Brownback had sought. The bill also trimmed both itemized and standard deductions and included the more aggressive “march to zero” automatic income tax rate cuts Brownback had proposed in 2012, based on 2 percent revenue growth. On net, the 2013 legislation recouped just $771 million of the $4.5 billion revenue loss from the 2012 legislation over fiscal years 2013-2018.[8] In 2015, faced with repeated revenue shortfalls, numerous rounds of mid-year budget-cutting, and a 2014 downgrade in its bond rating, the legislature froze the top income tax rate at 4.6 percent and increased the sales tax rate to 6.5 percent.[9]
In sum, the 2012 and 2013 bills together cut Kansas’ top tax rate on wages, salaries, and investment income by almost 29 percent (from 6.45 percent to 4.6 percent) and the rate on pass-through income by 100 percent (from 6.45 percent to zero). These are among the deepest personal income tax rate cuts that any state has ever implemented.
On June 6, 2017, the Kansas legislature overrode Governor Brownback’s veto of Senate Bill 30, repealing the pass-through exemption retroactively to the beginning of 2017, restoring a three-bracket income tax with a top rate of 4.9 percent in 2017 and 5.7 percent in 2018, and repealing future rate cuts based on revenue growth “triggers.”
Proponents Predicted Tax Cuts Would Boost Kansas Economy
In offering the 2012 tax cut package, Governor Brownback wrote: “We want to turn Kansas into an incubator for innovation and entrepreneurial success. Kansas should be the model for the nation in growing private sector jobs. . . . [W]hen it comes to Kansas’ tax policy, the state does not rank as high as it must compared to other states in order to be as competitive as possible in attracting new businesses and generating economic and private sector job growth.” But he provided little detail about how the tax cuts would achieve such results:
- “Lower income tax rates allow Kansas families and businesses to keep more of their hard-earned money. They know how to spend it more effectively than government does.”
- “Thanks to the innovative approach of eliminating individual state income tax on non-wage business income (e.g., from LLCs and S-corps), approximately 191,000 Kansas tax filers will have the opportunity to invest more in the growth of their small businesses. This is a unique and highly targeted strategy to make Kansas an incubator for innovation and a national center for entrepreneurship.”[10]
In other words, Brownback argued that the tax cuts would make it possible for Kansas residents and businesses to spend more money in the state by leaving more money in their bank accounts.[11]
Two additional points are worth noting. First, Brownback emphasized that the package was intended to be revenue neutral; he did not claim that Kansas needed to reduce revenue and shrink the state government’s size or activities to improve its economic performance. Second, he argued that partially replacing income tax revenue with higher sales tax revenue (by cancelling the scheduled sales tax rate reduction) would be good for the state’s economy because “sales tax rates have the least negative impact on economic growth relative to other tax types.”
Shortly after Brownback issued his proposal, Arthur Laffer offered a more detailed justification for it that focused on incentives and thus was more consistent with “supply-side” economic theory:
People do not work, invest, or engage in entrepreneurial activities in order to pay taxes. They engage in such economic activities in order to earn after-tax income. When the government increases its share of the income earned by its citizens, the incentive to engage in growth-enhancing economic activities falls; alternatively, the disincentive to these activities rises. The higher the tax on the next dollar earned (the marginal tax rate), the larger the disincentive.
By lowering the income tax rate . . . Kansas . . . will reduce the costs of work and investment compared to leisure, encouraging more work and investment. The primary benefits to the economy from phasing out . . . income tax are:
- Work effort
- Work demand (and subsequently wages)
- Savings
- Investment and, subsequently, greater capital accumulation.[12]
Laffer also argued that state tax cuts spur economic growth by attracting workers and job-creating businesses from other states with higher taxes.[13]
In sum, Kansas’ tax cuts did indeed represent a “real live experiment” in the validity of supply-side economic theory as applied to state personal income tax cuts.[14] The elimination of state income taxes on pass-through profits took almost to the limit the main mechanism by which state income tax policy, in theory, could incentivize new small business formation, capital investment, and expansion. And, in theory, the 29 percent reduction in the top personal income tax rate would incentivize greater work effort on the part of high-income wage and salary earners as well as entrepreneurs legally obligated to draw a salary from their businesses taxed as Subchapter S corporations. Under supply-side theory, the two tax cuts in combination should have generated significant, measurable increases — relative both to Kansas’ pre-tax-cut experience and to other states — in the number of people working, the number of businesses, and economic output.
Tax Cuts Failed to Boost Kansas Economy
In reality, the Kansas tax cuts did little if anything to stimulate economic growth:
-
Private-sector job creation.[15] As Figure 1 shows, Kansas’ private-sector job creation over the 53 months from December 2012 (the month before the tax cuts took effect) through May 2017 (the month before they were repealed) was lower than all neighboring states except Oklahoma and lower than all 50 states taken together.[16] In the 53-month period leading up to December 2012, a period that encompasses the Great Recession, Kansas suffered greater job losses in percentage terms than the nation as a whole and all but one neighboring state (Missouri). In other words, Kansas’ weak job creation is a longstanding problem, but its deep tax cuts failed to improve its performance relative to its neighbors and the United States as a whole.
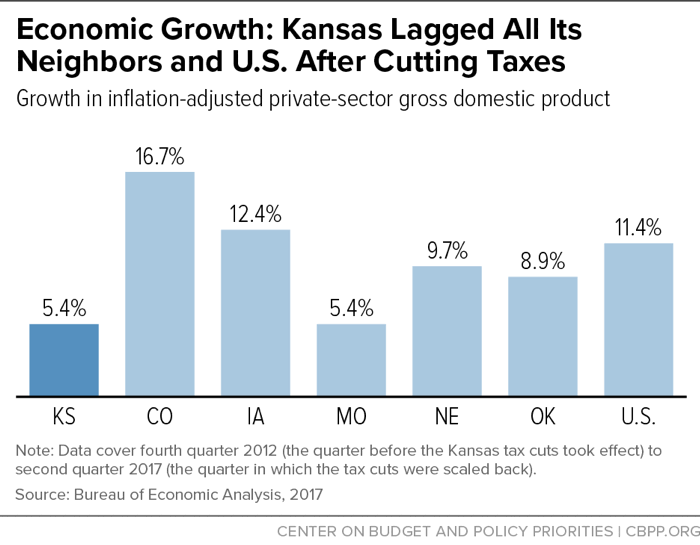
Figure 2 - Economic output (inflation-adjusted gross domestic product). As Figure 2 shows, between the fourth quarter of 2012 (the quarter immediately before the tax cuts took effect) and the second quarter of 2017 (the quarter ending at the end of June 2017, the month in which the tax cuts were substantially scaled back), Kansas’ private-sector economy grew more slowly than the United States and all of its five neighbors.[17] Kansas’ economy had grown more slowly than the United States and four of its five neighbors in the four years leading up to the tax cuts. So, again, there is no evidence that the tax cuts significantly improved the state’s relative economic performance.
-
Labor force participation. Under supply-side theory, Kansas’ steep reduction in income tax rates — especially at the top of the income scale — should have encouraged more people to work. But there is no evidence that this occurred. The labor force participation rate for Kansans age 25-64 was 80.8 percent in 2012 and 80.3 percent in 2016, but the change was not statistically significant.[18]
Figure 3 -
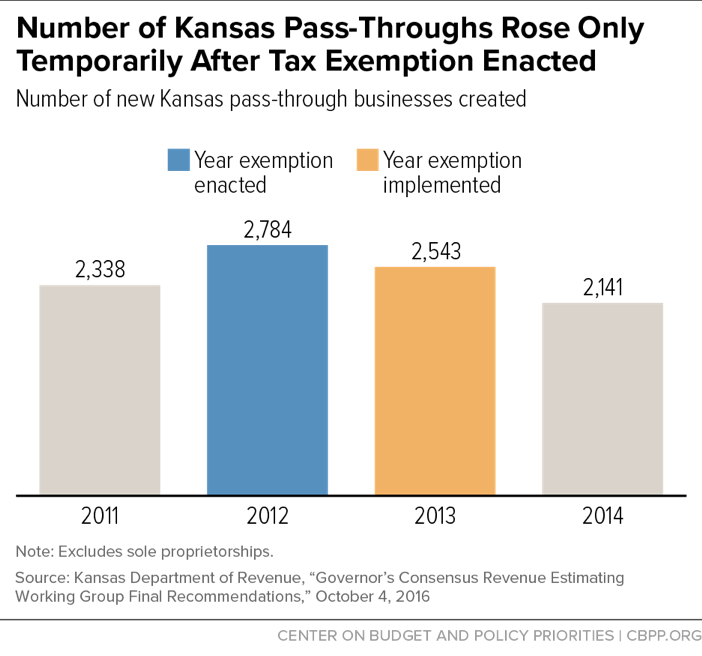
New pass-through businesses. Although this fact has received almost no attention, the Kansas Department of Revenue released data on the number of new pass-through businesses created in the state between 2010 and 2014 (not including sole proprietorships).[19] These data, shown in Figure 3, reveal that the number of new pass-through businesses created accelerated in 2012 (the year in which the exemption was enacted), but then declined in 2013 (when the exemption took effect) and 2014. In fact, fewer pass-through businesses were created in 2014, the most recent year for which data were reported, than in 2011, before the exemption was proposed. The Department of Revenue observed: “The tax policy was implemented in tax year 2013. The growth in pass-through entities after the tax policy was implemented is consistent with the growth prior to the tax policy change.” In other words, the Department acknowledged there is no evidence that the tax cuts speeded up creation of pass-through businesses.
Figure 4 - New business owners. As Figure 4 shows, the number of taxpayers reporting income from sole proprietorships (a form of pass-through business that always has a single owner) on their federal income tax returns rose more quickly in Kansas than in three of its five neighbors between 2012 and 2015. However, four of its five neighbors — and all 50 states taken together — outpaced Kansas in growth over this period in the number of taxpayers reporting income from S Corporations and partnerships, the kinds of pass-through businesses likeliest to create a significant number of jobs. Only 15 percent of sole proprietorships have any employees, while 50 percent of S Corporations do.[20] The average sole proprietorship with employees employs five people, compared to ten and 17 for S corporations and partnerships, respectively.[21]
In sum, there is overwhelming empirical evidence that Kansas’ enormous tax cuts failed to improve the state’s economic performance relative to its neighboring states and all 50 states taken together to any significant degree. This is true whether one looks at job creation, economic output, or new pass-through business formation.
Brownback’s Favored Measure of Pass-Through Business Growth Doesn’t Support His Claims
Governor Brownback, responding to federal government data demonstrating that Kansas lagged its neighbors and the United States as a whole in both job creation and economic growth, cited data that Kansas Secretary of State Kris Kobach released each year on the number of new businesses formed or, in the case of out-of-state businesses, seeking permission to do business in the state.* For example, in February 2016 Brownback wrote on Twitter, “.@KansasSOS reports a record 17,298 new KS business filings. That's the 5th record-setting year in a row!”
These data, however, have significant limitations for use in evaluating the impact of the tax cuts on business formation. First, the filing of business formation papers does not necessarily correspond to the operation of a bona fide business. There can be a long lag between the two and, indeed, a business can be incorporated in anticipation of acquiring an existing business in a deal that ultimately doesn’t go through. Moreover, the formation of a new business may not represent any new economic activity; for example, a real estate partnership may simply be transferring ownership of an existing property to a new set of owners or a law firm may simply be splitting in two.
In addition, the data do not, in fact, provide evidence that the tax cuts encouraged the creation of new businesses. Kobach and Brownback touted the topline number of new business filings but ignored the number of businesses that each year are proactively dissolved or likely failed (as evidenced by their failure to pay an annual fee and file an annual report). To get an accurate picture of business formation, those two types of business closures must be netted against the formation of new businesses and the reinstatements of businesses that had lapsed but then paid their annual fees and filed their reports. This calculation reveals that the net annual number of new businesses formed in Kansas in 2012 through 2016 has never reached the levels of the three years before the Great Recession.
In short, even Brownback’s flawed preferred measure of the impact of his tax plan that it encouraged new business formation.
*The most recent data, covering 2007 through 2016, are available at http://www.sos.ks.gov/other/news_releases/PR_2017/2016_Business_Formation_Report.pdf. Earlier reports provided data back to 2003.
Three Sophisticated Studies Find No Evidence That Tax Cuts Helped Kansas Economy
Three different groups of economists have conducted research using sophisticated statistical techniques to isolate the effects of the Kansas tax cuts on the state’s relative economic performance. All three studies have concluded that the tax cuts have had little if any positive impact:
-
Economists from the University of South Carolina, Indiana University, and the U.S. Treasury Department used 2010-2014 federal income tax filings from Kansas and its bordering states to measure the extent to which the tax cuts led to the formation of new pass-through businesses and growth in wage and pass-through income. (They first performed statistical tests to confirm that the five states’ economies were sufficiently alike for the comparison of growth rates to be valid.) They found no evidence that the pass-through tax exemption stimulated the creation of S corporations or partnerships (or limited liability companies taxed as S corporations or partnerships).[22]
With regard to sole proprietorships, the researchers found a small “2 percent increase in the probability of reporting self-employment income in the two years after the reform (2013 and 2014).” However, “essentially none” of those new sole proprietorships reported significant deductions for employee wages or new capital equipment, and some of them received income from businesses of which they had previously been employees. The authors concluded that “those who [were] induced to self-employment were likely individuals recharacterizing [preexisting wage] income for the lower tax rate rather than generating new business activity.”
-
Iowa State University and Kansas State University economists used county-level data to determine if the pass-through exemption increased employment among private businesses and the number of sole proprietors, as compared to bordering states in 2013 and 2014. The study controlled for underlying structural differences in the five states’ growth trends as well as differences in income tax rates (thus isolating the effect of the pass-through exemption). It concluded:
Our central results are that the key component of the tax law change intended to spur economic growth, the exemption of business income from personal income taxation, has not had a positive effect on private-sector employment in Kansas relative to neighboring states and controlling for a number of factors. We observe neither an increase in the number of jobs at establishments nor an increase in the number of proprietors in Kansas relative to the outcomes in neighboring states, which did not experience the law change.[23]
-
University of Oklahoma economists compared the post-tax-cut economic performance of Kansas (and Wisconsin) with a group of states statistically selected to best match the two states’ pre-tax-cut economic performance.[24] The study used ten separate measures, including total employment, total economic output, and labor force participation. It found that Kansas’ economy performed worse than that of the control group after the tax cuts on nine of the ten measures (all except median household income). The authors concluded:
[R]ather than experiencing stimulative growth effects from reductions in taxes, if anything, Wisconsin and Kansas experienced negative economic multiplier effects from reduced state government spending and increased economic uncertainty. It remains to be seen what the long-run economic effects of the experiments will be. But the economic experiments in Wisconsin and Kansas, along with those elsewhere, were advocated as a means to stimulate growth in the short run without having to reduce state government expenditures because of offsetting growth-induced revenue collections. In these two cases, the governing parties appeared to negatively affect their economies in the short run.[25]
Explanations for Tax Cuts’ Failure to Generate Growth Are Invalid
Anti-tax advocates lauded Brownback’s experiment while it was underway, but several now claim that it was tainted and offers no lessons about the validity of state-level supply-side economics:
- Before the tax cuts took effect, Arthur Laffer asserted that “cutting taxes can have a near immediate and permanent impact, which is why we have advised Oklahoma, Kansas, and other states to cut their income tax rates if they want the most effective immediate and lasting boost to their states’ economies.”[26] After their repeal, however, Laffer stated that he does not view Kansas as “a very significant test” of the validity of supply-side theory: “the tax cuts were positive, but they were positive like a hose in an ocean storm. They were not hugely material in the outcome in Kansas. . . .” States “do have bad times, and taxes are not 100 percent of everything.”[27]
- In May 2013, only a few months after the plan was implemented, Jonathan Williams, Vice President of ALEC’s Center for State Fiscal Reform, wrote that it was already having a measurable, positive impact on the state’s economy: “While the Kansas tax reform plan has received criticism from both sides of the political spectrum, the resulting economic growth in Kansas speaks for itself. The plan is not perfect, but it is a bold step toward pro-growth tax reform that will certainly continue to unlock more of Kansas’ economic potential.”[28] In February 2017, however, he wrote, “[T]he Kansas tax reform plan . . . was never fully implemented . . . making any honest judgement of the original plan’s success or failure impossible.”[29]
- In 2015, long after Kansas had begun experiencing major fiscal problems largely due to the tax cuts, Americans for Tax Reform head Grover Norquist stated: “Kansas is the future. Kansas is the model. . . . You actually have seen people move into Kansas across the border from Missouri because they specifically cut taxes on . . . pass-through small businesses. . . . [W]hat we are seeing is more and more states beginning the process of following Kansas to go to a zero income tax. And we are going to go from nine states [without an income tax], I think up to 20-25 in the next 15 years.”[30] Following the plan’s repeal, Norquist said, “Kansas is an outlier. . . . If you’re a Republican looking for a model, Kansas is not the model.”[31]
- The Cato Institute gave Brownback an “A” grade in the 2012 edition of its “Fiscal Policy Report Card on America’s Governors,” lauding him as having “signed into law one of the most impressive tax reforms of any state in recent years.”[32] The report observed: “[Kansas] exempted from tax certain nonwage income of limited liability corporations, S corporations, and sole proprietorships. That change will allow 191,000 Kansas businesses to keep more of their earnings for reinvestment and expansion.”[33] Five years later a Cato economist offered four major reasons for the failure of the Kansas experiment, including: “the specific tax package proposed went against good tax practice in one crucial regard, which even most supply-siders would denounce. By completely eliminating the income tax on pass-through businesses, the Governor significantly increased opportunities for tax avoidance for individuals working in certain types of company.”[34]
The preceding quotes allude to the principal arguments that anti-tax organizations have offered as to why the tax cuts’ failure to generate meaningful economic growth does not undermine the validity of supply-side economics: (1) Kansas failed to cut spending commensurate with the revenue loss due to the tax cuts; (2) the tax cuts stimulated economic growth, but this effect was overwhelmed by larger economic forces — falling oil and agricultural commodity prices and a sharp decline in aircraft production, a key segment of the state’s manufacturing economy; and (3) the pass-through exemption represented distortive tax policy that would inevitably stimulate abusive tax avoidance rather than new business creation.
None of these arguments are valid.
State Spending Was Sharply Constrained After Tax Cuts
The first major explanation from some conservatives for the Brownback tax cuts’ failure to stimulate meaningful economic growth is that lawmakers did not follow through with spending cuts. ALEC Vice President Jonathan Williams, for example, claimed that: “Spending reductions necessary to implement the plan were eschewed in favor of other tax increases, making any honest judgement of the original plan’s success or failure impossible.” Kansas Policy Institute President Dave Trabert said, “Don’t cut taxes and increase spending. That’s what Kansas did. That’s a bad plan, and it’s the root of all of Kansas’ problems.”[35] The Kansas state director of Americans for Prosperity went further, asserting that the state had experienced “soaring government spending.”[36]
Such claims do not withstand scrutiny:
- In pushing for his tax plan, Brownback did not claim that Kansas government needed to be downsized to boost the state’s economy. As noted above, he originally proposed offsetting the revenue loss from the tax rate cuts and pass-through exemption by raising the sales tax rate and eliminating several income tax deductions and credits. (See text box.) Thus, contrary to Williams’ statement, Brownback did not see spending reductions as “necessary to implement the plan”; in fact, the “other tax increases” Williams refers to were an integral part of the original plan.
Kansas Experience Also Belies Supply-Side Claim That Swapping Sales Taxes for Income Taxes Boosts Economy
Governor Brownback’s original proposal called for cancelling a scheduled reduction in the sales tax rate to help offset revenue losses from the income tax cuts; he argued that “sales tax rates have the least negative impact on economic growth relative to other tax types.” Lawmakers did eventually cancel the sales tax rate cut. Indeed, facing enormous budget gaps due to the income tax cuts, lawmakers raised the sales tax to 6.5 percent in 2015, its highest rate ever.
Some of the organizations that have criticized Brownback for not cutting spending more deeply have also espoused trading higher sales taxes for lower income taxes. For example, Americans for Prosperity has written: “We see repeated evidence across the country that states that shift their tax burden away from income and toward consumption routinely see higher levels of economic growth, job creation, and domestic migration.a And ALEC, which lamented that “[s]pending reductions necessary to implement the [Brownback] plan were eschewed in favor of other tax increases,” wrote in 2012:
“Kansas Gov. Sam Brownback has a . . . plan to phase out the income tax over the next decade. . . . In order to cover the costs of this plan, Gov. Brownback proposed broadening the tax base. And next door in Missouri, a voter initiative will likely be on the ballot this November. It would eliminate the state’s personal income tax entirely and replace it with an enhanced consumption tax. . . . In a 2009 case study, researchers found that replacing personal and corporate income taxes with a broad, revenue neutral 5.11 percent sales tax would cause the state economy to grow faster.”b
As Kansas’ weak economic performance since 2013 has demonstrated, the claim that substituting sales taxes for income taxes will significantly improve state economic growth is just as dubious as the claim that simply cutting income taxes will do so. The reasons, as CBPP has noted, include the following:
“In the short run, raising sales taxes would likely hurt in-state businesses by discouraging consumer purchases. And because sales tax revenue tends to grow more slowly than income tax revenue over the long run, relying more on sales taxes would impair a state’s ability to finance critical building blocks of a strong economy, like good schools, roads, and health care.”c
a “AFP Supports DC City Council Tax Reform Effort,” letter from Christine Harbin Hanson, National Issue Campaign Manager, Americans for Prosperity, to DC City Council Members, June 18, 2014, https://americansforprosperity.org/afp-supports-dc-city-council-tax-reform-effort/.
b Arthur B. Laffer, Stephen Moore, and Jonathan Williams, Rich States, Poor States, 5th Edition, 2012, p. 10.
c Michael Mazerov, “Shifting from Income to Sales Taxes Won’t Boost State Economies,” Center on Budget and Policy Priorities, April 29, 2015, https://www.cbpp.org/blog/shifting-from-income-to-sales-taxes-wont-boost-state-economies.
| TABLE 1 | ||||||
|---|---|---|---|---|---|---|
| Kansas General Fund Expenditures ($millions) | ||||||
| Actual FY 2012 |
Actual FY 2013 |
Actual FY 2014 |
Actual FY 2015 |
Actual FY 2016 |
% change FY 12-16 |
|
| Aid to K-12 + KPERS* contributions | $3,137 | $3,152 | $2,993 | $3,152 | $2,997 | -4.5% |
| Higher Education | $739 | $770 | $762 | $780 | $760 | 2.8% |
| Human Services Caseloads | $990 | $971 | $1,006 | $1,129 | $1,091 | 10.2% |
| Judiciary | $103 | $106 | $97 | $97 | $102 | -0.6% |
| All Other Expenditures | $1,129 | $1,136 | $1,126 | $1,079 | $1,166 | 3.2% |
| Total General Fund (GF) Expenditures | $6,098 | $6,135 | $5,983 | $6,237 | $6,115 | 0.3% |
| CPI-U, Seasonally Adj., Fiscal Year | 227.6 | 231.4 | 235.0 | 236.7 | 238.3 | 4.7% |
| Inflator | 1.0470 | 1.0297 | 1.0139 | 1.0067 | 1.0000 | |
| Total Inflation-adjusted GF Expenditures (FY 16) | $6,385 | $6,317 | $6,066 | $6,279 | $6,115 | -4.2% |
| Population, July 1, Beginning of Fiscal Year | 2,869,503 | 2,885,262 | 2,892,821 | 2,899,360 | 2,906,721 | 1.3% |
| Inflation-adjusted Per Capita GF Expenditures | $2,225 | $2,189 | $2,097 | $2,166 | $2,104 | -5.5% |
- State government spending was, in fact, tightly constrained following the tax cuts. As Table 1 shows, total General Fund spending rose only 0.3 percent in nominal terms between fiscal years 2012 (the last fiscal year not affected by the tax cuts) and 2016 (the most recent year for which final spending data are available). After adjusting for inflation and population growth, General Fund spending per resident fell 5.5 percent over those four years. The number of state employees fell by 4 percent in the same period.[37] Nine separate times during the period the tax cuts were in effect, Kansas enacted mid-year cuts in General Fund spending, according to the Kansas Center for Economic Growth.[38] Between the 2012 and 2017 academic years, Kansas cut higher education funding per student spending by 2 percent, after adjusting for inflation.[39] The state also transferred almost $1 billion from the Highway Fund to the General Fund (or directly to other state agencies) after the tax cuts and then postponed numerous highway projects indefinitely because of the reduced revenue.[40]
-
Had Kansas cut spending more deeply, its economic and job growth would have been even more anemic. Enacting deeper spending cuts at the outset might have enabled Kansas to avoid the repeated budget shortfalls, mid-year program cuts, and bond rating downgrades that occurred from 2013 to 2017. But sharper cuts — in addition to inflicting even greater harm on public school and state university students, Medicaid recipients, and users of the state’s roads — would also have made the state’s economic performance even worse.
The state avoided deeper program cuts by draining its financial reserves and delaying deposits into its employee pension fund. The state General Fund balance fell from $709 million at the end of fiscal year 2013 to an estimated $50 million at the end of fiscal year 2017, and a $100 million pension fund contribution scheduled for early 2016 was delayed until 2018.[41] Had Kansas cut spending on state programs by those amounts instead, even fewer private-sector jobs would have been created, as teachers, nursing home aides paid with Medicaid funds, and private road maintenance contractors compensated with Highway Fund dollars would have had that much less money to spend in local stores.
In short, those who claim that the tax cuts failed to generate economic growth because Kansas didn’t cut spending enough have it backwards: what little economic growth Kansas eked-out after the tax cuts might well have disappeared if the state had cut spending further.
Downturns in Agriculture, Energy, and Airplane Manufacturing Not Major Factors
Defenders of the tax cuts have also argued that larger economic forces overwhelmed the positive effects of the tax cuts. Brownback said in 2016, “So your three primary legs of the Kansas economy have been in great difficulty all together . . . Aviation has struggled for several years, but ag and oil were pretty good prior to that, but last year it was in tremendous difficulty.” Similarly, Heritage Foundation economist Stephen Moore, who helped design the tax cuts, wrote: “The state has underperformed on jobs and growth compared with the national average, but this is in part due to steep declines in the price of oil and gas (Kansas is an energy state) and the hit to farmers from historically low commodity prices.”[42] And a 2017 ALEC report claimed: “Like many other states, Kansas was hit hard by the 2013 drop in oil prices and had some of its aviation sector continue to perform poorly. . . . Rather than having a struggling economy with most sectors shrinking or performing poorly, Kansas has a growing economy with two unique sectors that are doing poorly for reasons unrelated to the 2012 tax reforms.”[43]
None of these excuses is valid.
-
Aircraft manufacturing is too small a component of the Kansas economy for its downturn to appreciably affect the state’s job creation record. Employment in this sector, which is concentrated in the Wichita metro area, peaked at 44,700 jobs in September 2008 and had already fallen by 12,500 by May 2012, when Brownback signed the tax cuts into law. It fell another 2,500 jobs by May 2017, the month before the cuts were repealed.[44] Total private employment in Kansas in the latter month was 1.2 million, meaning that the 2,500 lost jobs in aircraft manufacturing represented 0.2 percent of the total.
Between May 2012 and May 2017, private employment in Kansas grew by 4.6 percent. If all Wichita-area employment is subtracted from the statewide total (to account not only for the loss of aircraft manufacturing jobs but also the indirect job losses due to reduced local spending by manufacturing workers), non-Wichita jobs in Kansas rose by a similar 4.3 percent in that five-year interval.[45] In contrast, national private employment rose 10.5 percent in the same period.
In short, Kansas’ job losses in aircraft manufacturing occurred primarily before the tax cuts took effect, and the subsequent job losses in that industry are almost trivial in explaining Kansas’ poor job creation record vis-à-vis the rest of the United States.[46]
Figure 5 - Energy production is too small a component of the Kansas economy for its downturn to appreciably affect the state’s job creation record. The story is much the same with respect to Kansas’ energy industry. Kansas employment in “mining and logging” — most of which is oil and gas production — fell by 3,100 persons from the month the tax cuts were enacted to the month before they were repealed, a loss only moderately exceeding the 2,500 aerospace manufacturing jobs lost in this period.[47] Outside the mining and logging industries, private employment rose by 4.9 percent in Kansas between May 2012 and May 2017, compared to 10.5 percent nationally. Thus, problems in Kansas’ energy industry do not explain why the tax cuts failed to boost job or earnings growth in the state relative to the United States as a whole.
- Farm earnings fell less in Kansas than in most of its neighbors and nationally after the tax cuts took effect. The last five years have not been a good time for U.S. farmers, but Kansas agriculture has actually fared better than agriculture in most of its neighbors and in the United States overall. As Figure 5 shows, combined earnings of farm proprietors and employees fell by 15.8 percent in Kansas between 2012 (the year the tax cuts were enacted) and 2016 (the most recent year for which these data are available). But the declines during this period were larger in all but one of Kansas’ neighbors (Nebraska) and the United States overall.

In short, declines in employment and earnings in Kansas’ aircraft manufacturing, energy, and agriculture sectors after the Brownback tax package took effect have been a drag on the overall state economy but do not explain the tax cuts’ failure to boost Kansas’ relative economic performance. The reasons are two-fold. First, the decline in agriculture was even steeper in other states. Second, the aircraft manufacturing and energy production sectors are too small a share of the Kansas economy to create the gaps in economy-wide employment or output between Kansas and other states that existed during this period.
Even if declines in a few specific industries important to Kansas’ economy had indeed contributed significantly to its recent weak performance, this would hardly justify the tax cuts. No one disputes that a tax cut provided to a particular business might induce it to make an investment that it might not otherwise have made or lead it to locate a new planned facility in the tax-cutting state rather than another state. Nonetheless, these marginal effects are almost always less important in the real world than more fundamental economic factors — including the industrial composition of the state’s economy and the factors driving growth or decline in those industries. The fact remains that, for a number of reasons, tax cuts are a poor economic development strategy.[48]
Rather than constantly tinker with their tax systems in search of a magic economic development bullet, state policymakers should focus on designing and implementing cost-effective, targeted policies to stimulate entrepreneurship,[49] assist their important in-state industries,[50] and diversify their state economic base. Their top priority must be ensuring that the state fulfills its fundamental responsibilities to provide an excellent education system, modern and efficient roads, bridges, and other critical infrastructure, and a high quality of life with safe communities and attractive parks and recreation opportunities. This will make their states places where people want to live and businesses want to start up and expand.
Tax Avoidance Does Not Explain Supply-Side Failures
The exemption of pass-through profits from the Kansas income tax created an incentive for various kinds of artificial tax minimization strategies, as CBPP noted at the time.[51] Four principal techniques were available:
- Owners of existing S corporations, who are required by federal law to draw a taxable salary from their businesses, could (within limits) reduce those salaries and take more of their income in the form of tax-exempt dividends paid out of their companies’ profits. Similarly, if the spouse of the owner of any type of pass-through business was an employee of the same business, the spouse could reduce his taxable salary and the other spouse could draw larger dividends to offset this reduction.
- Employees of all types of organizations could resign their positions and go out on their own as self-employed (sole proprietor) contractors to their former employers, thereby exempting all their contractor income from Kansas income taxation.[52]
- In a variation of the second strategy — one that Kansas University football coach David Beaty reportedly implemented after the tax cut[53] — a highly paid employee could form a limited liability company treated as an S corporation for tax purposes, draw the minimum salary required under federal law, and receive the rest of his income in the form of untaxed dividends.
- So-called “C corporations,” which are subject to the Kansas corporate income tax, could elect to be treated as S corporations under federal and Kansas law (assuming they met the requirements), thereby ensuring that the only portion of the firm’s income that would be taxed currently would be the owners’ salaries.
However, currently available evidence suggests that taxpayers adopted these strategies only to a modest extent.
-
The most widely cited evidence in support of widespread tax avoidance was erroneous. When the pass-through exemption was enacted, the Brownback administration claimed that roughly 191,000 pass-through business owners were potential beneficiaries. Thus, when The Wichita Eagle newspaper reported three years later that almost 334,000 individual taxpayers had claimed the exemption in 2013 (the first year it was available),[54] this enormous increase over a short period of time was widely interpreted as evidence that the second, third, and fourth tax avoidance strategies listed above — all of which involve the artificial creation of “new” pass-through businesses — had widely occurred.[55]
In reality, the original 191,000 estimate was erroneous.[56] It represented the number of Kansas taxpayers reporting sole proprietorship income on their 2009 federal income tax returns. The Brownback administration acknowledged to The Wichita Eagle that the figure omitted more than 50,000 farms, which also qualified for the exemption. The figure also omitted an additional 78,000 owners of S-corporations, partnerships, and LLCs. Including all three categories of businesses would produce an estimate of 330,000 potential beneficiaries as of 2009,[57] and building in an allowance for normal anticipated growth between 2009 and 2013 would produce an even higher figure. IRS data for 2015 (the most recent available) show approximately 340,000 Kansas residents reporting income from all types of pass-through businesses combined, a modest 2.0 percent gain over the number the IRS reported for 2012, the year the exemption was enacted.[58]
In short, the IRS data for all types of pass-throughs combined provide no evidence that the exemption led to significant tax avoidance. Unfortunately, the erroneous information was widely reported and continues to be cited. In 2017, for example, the Cato Institute stated: “By completely eliminating the income tax on pass-through businesses, the Governor significantly increased opportunities for tax avoidance for individuals working in certain types of company. The take up of this provision was much, much higher than expected. . .”[59]
-
Two sophisticated statistical studies also found no evidence that the tax cuts significantly increased the number of pass-through businesses, meaning there were little if any “real” supply-side effects or artificial tax avoidance effects. As discussed above, three statistical analyses of the effects of the Kansas tax cuts covering the first few post-adoption years have been published. One of them looked exclusively at whether the pass-through exemption increased the number of sole proprietors. It concluded:
We observe neither an increase in the number of jobs at [private] establishments nor an increase in the number of [sole] proprietors in Kansas relative to the outcomes in neighboring states, which did not experience a tax law change. . . . Some workers could be leaving establishment employment in order to become self-employed . . . [but] the data are not consistent with that story: loss in an establishment job does not show up as an increase in self-employed. . . .[60]
One of the other studies found a 2 percent increase in the probability of reporting self-employment income in the two years after the exemption took effect[61] but concluded that the increase probably represented “individuals recharacterizing [preexisting wage] income for the lower tax rate rather than generating new business activity” — that is, tax avoidance rather than actual business creation. And the study found no evidence that the tax cuts had stimulated the creation of S corporations and partnerships, meaning there was neither a “real” supply-side effect nor an artificial tax avoidance effect.[62]
-
The Kansas Department of Revenue’s own data show, at most, a small and temporary uptick in the number of pass-through businesses formed and C corporations converted to S corporations that could be attributed to artificial tax avoidance. As shown in Figure 3 above, the number of new S corporations, partnerships, and LLCs jumped by about 450 in 2012, the year the exemption was enacted. It then fell the next two years. Even if that entire bump reflected tax avoidance, it would hardly constitute massive tax avoidance, given that 85,400 such firms were operating in Kansas in 2012.[63]
The Department also reported that the number of C corporations converting to S corporations — the fourth possible tax avoidance strategy listed above — jumped from an average of 347 per year in 2010, 2011, and 2012 to 575 in 2013 before falling to 369 in 2014. While the 2013 increase was large in percentage terms, it was small relative to the 27,532 C corporations operating in the state in 2013, and was a one-time occurrence.[64] Again, the Department concluded that “the number of C-Corporations that have switched to a pass-through entity after the tax policy was implemented in 2013 is consistent with the percentage switching prior to the tax policy.”
New Federal Pass-Through Tax Break Will Likely Lead to
More Tax Avoidance than Kansas’ Did
As this report explains, early reports of tax avoidance caused by Kansas’ pass-through exemption were based on incorrect estimates, and subsequent data shows effects nowhere near as large as those initial reports. Nonetheless, the pass-through tax break in the federal tax bill enacted in December 2017 could lead to considerably more taxpayer action aimed at minimizing taxes than occurred in Kansas.
By creating a 20 percent federal deduction for “qualified [pass-through] business income,” the bill opens up a 7.4 percentage-point gap between the top federal tax rate on wages and salaries and the federal rate on pass-through income. (Twenty percent of the new top rate on wages and salaries of 37 percent is 7.4 percent.) That’s more than twice the roughly 3 percentage-point gap that Kansas’ exemption for pass-through income created.a This large gap will likely encourage a higher share of S corporation owners to draw lower salaries from their businesses than occurred in Kansas. And it may well be large enough to encourage some workers to forgo health, 401(k), and other benefits of being an employee and strike out on their own as independent contractors eligible for the deduction.b
While the bill contains several “guardrails” aimed at limiting the number and types of pass-through business owners who can take the deduction, concerted efforts to circumvent these guardrails are likely given the large potential tax savings. For example, although highly paid lawyers and doctors are barred from claiming the deduction, tax experts note that if law firms and medical practice groups own the buildings in which they operate, they could form separate pass-through businesses to own the building (real estate businesses are eligible for the deduction) and maximize the tax savings by having the building charge artificially high rents to the professional service business.c As tax advisors continue probing the weaknesses of this hastily drafted legislation, they will likely identify even more opportunities for tax avoidance.
a Kansas’ pass-through exemption created a 4.6 percentage-point gap between the top wage and salary rate and the (zero) rate for pass-through income, but the effective gap was smaller given that filers could deduct their state income tax payments in calculating their federal tax liability. For someone subject to the top federal tax rate at the time — 39.6 percent — the deductibility of Kansas income taxes reduced the effective gap to about 3 percentage points.
b Lily Batchelder and David Kamin, “The GOP Tax Plan Creates One of the Largest New Loopholes in Decades,” Los Angeles Times, December 31, 2017.
c Reuven Avi-Yonah et al., “The Games They Will Play: An Update on the Conference Committee Tax Bill,” updated December 22, 2017, https://papers.ssrn.com/sol3/papers.cfm?abstract_id=3089423.
But regardless of whether the exemption led to widespread tax avoidance, under supply-side theory it should also have prompted the formation of many new Kansas pass-through businesses and the expansion of others. For example, the exemption should have been large enough to tip the predicted after-tax profitability of some new pass-through business ventures under consideration from unprofitable to profitable and thus lead to their creation. It should also have attracted some pass-through businesses to Kansas from other states whose tax rates on such businesses were suddenly relatively higher. And by increasing the after-tax rate of return on pass-through ownership, it should have attracted additional equity (ownership) investment in existing pass-throughs, which would have shown up in data on the number of Kansans reporting pass-through income on their federal tax returns. Yet none of these things occurred, as the studies cites above show. This provides compelling evidence refuting supply-side theory about the growth benefits of cutting state taxes on “job creators.”
Conclusion
The 2012-17 Kansas experiment represented as pure a test of the ability of personal income tax cuts to boost business and job creation in a slow-growing state as can be conducted in the real world. The reduction in the top income tax rate was among the deepest any state had ever enacted, and no state had ever eliminated income taxes for “small business job creators.” Yet overwhelming evidence shows that the experiment failed, and that the explanations from former tax cut proponents for this failure are invalid.
A single experiment rarely proves or disproves a scientific hypothesis, and by itself the Kansas experiment doesn’t disprove supply-side theory as applied to state tax policy. But it is far from the only evidence available. Numerous states with disappointing economic performance have enacted deep personal income tax cuts over the past 10-15 years in hopes of boosting growth, at the instigation of both Republican and Democratic governors. Most of these experiments have also failed.[65] Perhaps the best example is Ohio, which has cut its top income tax rate since 2005 even more deeply than Kansas did and has also slashed (although not repealed) its taxation of pass-through businesses. Yet, like Kansas, its economy has badly lagged that of almost all its neighbors and the United States since its tax-cutting began. Similarly, a large majority of more than 15 recent statistical studies find no meaningful relationships between state personal income tax levels and state economic performance.[66] Policymakers across the country should heed the evidence and not treat their constituents as guinea pigs in a grand ideological experiment.
End Notes
[1] Scott Rothschild, “Task Force Working in Secret on Tax Proposal,” Lawrence Journal World, October 9, 2011.
[2] This claim has been thoroughly debunked. See, for example, Carl Davis, “Trickle-Down Dries Up,” Institute on Taxation and Economic Policy, October 2017, https://itep.org/trickle-down-dries-up/. See also “ALEC’s Rich States, Poor States,” http://www.gradingstates.org/alecs-rich-states-poor-states/.
[3] “The Brownback Pro-Growth Plan: Making the State Income Tax Flatter, Fairer, and Simpler,” January 12, 2012, http://www.kslegislature.org/li_2012/b2011_12/committees/misc/ctte_s_assess_tax_1_20120112_01_other.pdf. The document included a table of “Data Compiled by Laffer Associates” comparing the recent economic performance of the non-income-tax states and the nine states with the highest top income tax rates.
[4] Pass-through income is taxable in the year in which it is earned even if it is not distributed to the owner. In other words, the income is “passed through” to the owner for tax purposes, but it may or may not be “passed through” in the form of cash.
[5] Brownback also proposed to double the standard deduction for heads of households to mitigate the increase in their tax liability resulting from his proposal to repeal the state earned income tax credit.
[6] Supplemental Note on Senate Substitute for House Bill 2117; http://kslegislature.org/li_2012/b2011_12/measures/documents/summary_hb_2117_2012.pdf. Governor Brownback signed House Bill 2117 into law on May 22, 2012.
[7] See the Fiscal Note on Senate Bill 78 as introduced, http://kslegislature.org/li_2014/b2013_14/measures/documents/fisc_note_sb78_00_0000.pdf.
[8] Supplemental Note on House Bill 2059; http://kslegislature.org/li_2014/b2013_14/measures/documents/summary_hb_2059_2013.pdf.
[9] Kansas Department of Revenue, Notice 15-06, https://www.ksrevenue.org/taxnotices/notice15-06.pdf; Notice 15-02, https://www.ksrevenue.org/taxnotices/notice15-02.pdf.
[10] “The Brownback Pro-Growth Plan.”
[11] This argument is not valid in the case of tax cuts for wage, salary, and passive investment income. Because states must balance their budgets, every dollar of such a tax cut must be offset by either reduced state spending (which takes a dollar of disposable income from a state employee, state contractor, or recipient of a state transfer payment) or an offsetting increase in another tax (which reduces the disposable income of the person paying it). The only exception to this is if the tax cut leads to dissaving by the state government, for example, the drawing down of state reserves or the delaying of a contribution to a state pension fund.
Putting more money into a business’s hands by cutting its taxes can lead it to make an in-state investment that it otherwise would not have made, assuming it lacks sufficient cash on hand to make the investment and cannot borrow the money.
[12] Arthur Laffer, Jonathan Small, and Wayne Winegarden, “Economics 101,” February 2012, published by the Oklahoma Council of Public Affairs.
[13] “A key part of the nine-state comparisons is that people and businesses move to states with pro-growth tax environments.” (“Economics 101,” p. 7.)
[14] Scott Rothschild, “Brownback Gets Heat for ‘Real Live Experiment’ Comment on Tax Cuts,” Lawrence Journal-World, June 19, 2012. Supply-side theory predicts positive impacts on state and national economic performance from cuts in a wide array of taxes, including corporate income and estate taxes.
[15] For an explanation of why cutting personal income taxes for businesses should not be expected to have significant supply-side effects in the real world, see: Michael Mazerov, “Cutting State Personal Income Taxes Won’t Help Small Businesses Create Jobs and May Harm State Economies,” Center on Budget and Policy Priorities, February 19, 2013, https://www.cbpp.org/sites/default/files/atoms/files/2-19-13sfp.pdf.
[16] The same is true if the comparison begins in April 2012, the month before the tax cut was enacted. It is worth noting that the only neighboring state that underperformed Kansas in job creation, Oklahoma, also cut its income tax rates during this period. None of Kansas’ other neighbors cut their income taxes significantly.
The Kansas Policy Institute (KPI), a conservative think tank that supported the Brownback tax cuts and opposed repealing them, argues for the use of a different job creation measure (which, unlike the Bureau of Labor Statistic data used in Figure 1, counts pass-through owners themselves as employees) and a different set of comparison states (based on a statistical analysis of which states’ employment bases are most similar to Kansas’). See Dr. William Boyes and Stephen Slivinski, “A Thousand Flowers Blooming: Understanding Job Growth and the Kansas Tax Reforms,” January 2017, https://kansaspolicy.org/job-growth-and-kansas-tax-reforms/. Without debating the merits of those arguments, making those substitutions does not result in an appreciably different picture. From 2012 to 2016, Kansas’ private-sector job growth rate using the alternative job creation measure was roughly three-fifths the rate of all 50 states taken together and below or equal to that of five of the eight recommended comparison states (Alabama, Kentucky, Michigan, Missouri, and Ohio) and only slightly better than a sixth, Nebraska.
[17] Kansas’ economic growth was slightly slower than Missouri’s when measured to two decimal places. Kansas’ economic growth during this period was also slower than all of the five additional states that KPI argues should be compared to Kansas: Alabama, Arkansas, Kentucky, Michigan, and Ohio.
[18] American Community Survey data extracted using American FactFinder.
[19] “Governor’s Consensus Revenue Estimating Working Group Final Recommendations,” October 4, 2016, p. 9; http://budget.ks.gov/files/FY2017/cre_workgroup_report.pdf. Comparable data are not available from other states.
[20] Richard Prisinzano et al., “Methodology to Identify Small Businesses,” U.S. Dept. of the Treasury, Office of Tax Analysis, Technical Paper 4 (Update), November 2016, p. 27.
[21] U.S. Census Bureau, County Business Patterns, 2015 data via American FactFinder.
[22] “The reform had no measurable impact on the number of filers reporting income from S-corporations or partnerships.” Jason DeBacker et al., “The Impact of State Taxes on Pass-Through Businesses: Evidence from the 2012 Kansas Income Tax Reform,” September 2017, p. 20, https://papers.ssrn.com/soL3/papers.cfm?abstract_id=2958353.
[23] Tracy M. Turner and Brandon Blagg, “The Short-term Effects of the Kansas Income Tax Cuts on Employment Growth,” Public Finance Review, 2017, p. 16, http://journals.sagepub.com/doi/abs/10.1177/1091142117699274.
[24] The “synthetic control methodology” used in the paper creates a comparison group of states by applying different weights to the various states’ recent economic performance as well as measures that should, theoretically, contribute to that performance (such as education levels). It should be acknowledged that the authors are critical of the types of neighboring states comparisons used in the other two studies summarized here.
[25] Dan S. Rickman and Hongbo Wang, “Two Tales of Two U.S. States: Regional Fiscal Austerity and Economic Performance,” March 19, 2017, pp. 15-16, https://mpra.ub.uni-muenchen.de/79615/1/MPRA_paper_79615.pdf. (References in the quote were omitted.)
[26] Arthur Laffer and Stephen Moore, “Taxes Really Do Matter: Look at the States,” Laffer Center for Supply-Side Economics, September 2012, p. 17, http://www.laffercenter.com/wp-content/uploads/2012/09/2012-09-TaxesDoMatterLookAtStates-LafferCenter-Laffer-Moore.pdf.
[27] Jonathan Curry, “Undeterred by ‘Kansas Experiment,’ Laffer Presses Tax Cuts,” State Tax Today, August 9, 2017.
[28] Arthur B. Laffer, Stephen Moore, and Jonathan Williams, Rich States, Poor States, 6th Edition, American Legislative Exchange Council, 2013, p. 3.
[29] Jonathan Williams and Ben Wilterdink, “Lessons from Kansas: A Behind the Scenes Look at America’s Most Discussed Tax Reform Effort,” American Legislative Exchange Council, February 2017.
[30] Interview with Nick Gillespie, Reason TV, April 22, 2015, https://www.youtube.com/watch?v=r3tFqzeXI0g&.
[31] Russell Berman, “The Death of Kansas’ Conservative Experiment,” The Atlantic, June 7, 2017, https://www.theatlantic.com/politics/archive/2017/06/kansass-conservative-tax-experiment-is-dead/529551/.
[32] Cato Institute, “Fiscal Policy Report Card on America’s Governors, 2012,” https://object.cato.org/pubs/wtpapers/GRC2012.pdf.
[33] Report Card, p. 24.
[34] Ryan Bourne, “The Real Lessons from the Kansas Experiment,” Cato, June 28, 2017, https://www.cato.org/publications/commentary/real-lessons-kansas-experiment.
[35] Quoted in Berman, Note 31.
[36] Jeff Glendening, “Historic Tax Hike Won’t Fix Spending Problem,” Wichita Eagle, July 2, 2017, http://www.kansas.com/opinion/opn-columns-blogs/article159217439.html. In contrast, the Tax Foundation has acknowledged that Kansas’ “[s]pending growth has been slow, averaging about 0.5 percent in recent years . . . and just 0.3 percent per year since 2008.” Scott Drenkard and Joseph Bishop-Henchman, “Testimony: Reexamining Kansas’ Pass-through Carve-Out,” January 19, 2017 (updated May 18, 2017 and June 30, 2017), https://taxfoundation.org/testimony-reexamining-kansas-pass-through-carve-out/.
[37] Kansas Legislative Research Department, “Kansas Fiscal Facts,” July 2017, p. 34, http://www.kslegresearch.org/KLRD-web/Publications/FiscalFacts/2017_fiscal_facts.pdf. (Change in full-time equivalent employment).
[38] Jonathan Shorman, “Brownback Asks Agencies to Show How They Will Deal with Five Percent Cuts,” Hutchinson News, August 11, 2016, http://www.hutchnews.com/7482195d-6874-5ead-914f-a6b64bfdeb5d.html. For examples of these mid-year budget cuts, see Bryan Lowry and Dion Lefler, “Brownback Moves Money from Highway Fund, Cuts Pension Spending to Deal with $279M Shortfall,” Wichita Eagle, December 9, 2014, http://www.kansas.com/news/politics-government/article4382802.html; Brad Cooper, “Gov. Sam Brownback Is Cutting Aid to Kansas Schools by $44.5 Million,” Kansas City Star, February 5, 2015, http://www.kansascity.com/news/politics-government/article9376751.html.
[39] CBPP calculations for Michael Mitchell, Michael Leachman, and Kathleen Masterson, “A Lost Decade in Higher Education Funding: State Cuts Have Driven Up Tuition and Reduced Quality,” August 22, 2017, https://www.cbpp.org/sites/default/files/atoms/files/2017_higher_ed_8-22-17_final.pdf.
[40] A table the Department of Transportation prepared in January 2017 showed actual “extraordinary” transfers from the state highway fund to the General Fund or directly to state agencies between fiscal years 2013 and 2016 totaling $908 million (http://kslegislature.org/li/b2017_18/committees/ctte_h_apprprtns_1/documents/testimony/20170308_06.pdf). Transfers in 2017 have not been publicly reported, although at the time the table was prepared Governor Brownback was recommending an additional $398 million. See also Micheal Mahoney, “Kansas Budget Cuts to Put 25 Highway Projects on Hold,” KMBC TV, May 19, 2016, http://www.kmbc.com/news/kansas-budget-cuts-to-put-25-highway-projects-on-hold/39631246.
[41] State of Kansas, “Comparison Report,” August 2017, p. 18, http://budget.ks.gov/publications/FY2018/FY2018_Comparison_Report--8-4-2017.pdf. “Editorial: No More KPERS Delays,” Topeka Capital-Journal, September 17, 2016, http://cjonline.com/opinion/2016-09-17/editorial-no-more-kpers-delays.
[42] Stephen Moore, “What’s the Matter with Kansas Republicans?” The Weekly Standard, May 22, 2017, http://www.weeklystandard.com/whats-the-matter-with-kansas-republicans/article/2008157. The Cato Institute has made a similar claim: “[T]he state is strongly affected by what goes on in the agricultural and energy industries. Given the weakness of commodity prices over this period, the state economy has struggled for reasons nothing to do with the tax cuts.” See Bourne, Note 34.
[43] Williams and Wilterdink, Note 29, p. 14.
[44] Bureau of Labor Statistics State and Local Area Employment database, https://www.bls.gov/sae/data.htm. State employment data at this level of industry disaggregation are not available on a seasonally adjusted basis.
[45] Economist Peter Fisher suggested separating Wichita-area employment from the rest of the state as an approach to isolating the effects of the downturn in aircraft manufacturing. See: Peter Fisher, “The Lessons of Kansas,” 2017, http://www.gradingstates.org/the-problem-with-tax-cutting-as-economic-policy/the-lessons-of-kansas/?print=pdf.
[46] University of Wisconsin economist Menzie Chin examined the impact of the aerospace industry on the output (“gross domestic product”) of the Kansas economy from 2010 through the first quarter of 2016. He found that the industry made a net positive contribution to Kansas output growth in most of the calendar quarters subsequent to the beginning of 2013, when the tax cuts took effect. See “Does the Aerospace Decline Explain the Kansas Collapse?” Econbrowser blog, August 12, 2016, http://econbrowser.com/archives/2016/08/does-the-aerospace-decline-explain-the-kansas-collapse.
[47] The fall from peak employment in the mining and logging sector, which occurred almost a year after the tax cuts took effect (December 2013), has been 4,100 persons.
[48] Other reasons include the regressive distributional impact that tax cuts justified on economic development grounds often have, and the fact that tax cuts likely impair a state’s ability to provide services that are critical to its long-run economic success, such as an educated and healthy work force and high-quality roads, bridges, and other infrastructure.
[49] For a discussion of the importance of entrepreneurship to state economic growth, see Michael Mazerov and Michael Leachman, “State Job Creation Strategies Often Off Base,” Center on Budget and Policy Priorities, February 3, 2016, https://www.cbpp.org/sites/default/files/atoms/files/2-3-16sfp.pdf.
[50] The Wall Street Journal recently reported that Kansas’ aerospace manufacturing industry is poised for an upturn and that industry leaders are now quite concerned now about its ability to attract enough skilled workers in light of the large number who have left the state or will soon retire. See Shayndi Raice, “The ‘Air Capital of the World’ Has a Problem: Too Few Aviation Workers,” Wall Street Journal, August 2, 2017. Unfortunately, the cuts in higher education and national press coverage of the fiscal, economic, and political problems that the tax cuts have engendered have harmed the state’s ability to generate such workers internally and attract them from other states.
[51] Nicholas Johnson and Michael Mazerov, “Proposed Kansas Tax Break for ‘Pass-Through’ Profits Is Poorly Targeted and Will Not Create Jobs,” Center on Budget and Policy Priorities, revised March 26, 2012, https://www.cbpp.org/sites/default/files/atoms/files/1-24-12sfp.pdf, pp. 5-6. The Tax Foundation raised similar concerns after the package was enacted: Mark Robyn, “Not in Kansas Anymore: Income Taxes on Pass-Through Businesses Eliminated,” Tax Foundation, May 29, 2012, https://files.taxfoundation.org/legacy/docs/ff302.pdf.
[52] The Kansas Policy Institute has explained why relatively few modestly compensated employees could be expected to take such a step: “For individuals, the choice comes down to whether they want to maintain traditional employment — with the advantages that come with being a full-time employee, such as the employer 401(k) matching contributions and group health insurance benefits — or transition to self-employment, even if it is an arrangement in which that employee simply becomes a ‘freelance’ contractor (i.e., Schedule C) while continuing to do the same full-time job. The loss of these benefits and various legal protections that come with being a traditional employee suggests that maintaining their status as a traditional employee is likely a better option than going through the accounting gymnastics involved in becoming a Schedule C worker just to avoid state income tax.” Page 5 of the source cited in Note 16.
[53] Associated Press, “KU Coach Bill Self, Other LLCs Avoid Taxes Under Kansas Law,” Topeka Capital-Journal, May 17, 2016 (updated November 2, 2016), http://cjonline.com/news-sports-catzone-hawkzone/2016-05-17/ku-coach-bill-self-other-llcs-avoid-taxes-under-kansas-law.
[54] Bryan Lowery, “More Business Owners Using Tax Exemption in Kansas than Expected,” Wichita Eagle, February 21, 2015, http://www.kansas.com/news/politics-government/article10802204.html.
[55] Of course, the Brownback administration itself cited the increase as providing evidence that the exemption had, in fact, stimulated the creation of new businesses. In the same Wichita Eagle article, Kansas Secretary of Revenue Nick Jordan said, “in tax year 2013 alone there were 8,666 new filers . . . the [191,000] estimate was based on data from 2009, [and] much of the difference is because of four years of growth in small businesses.” And, as recently as late July 2017, Arthur Laffer made the same claim: “[T]here was a huge increase in overall number of businesses as well, which is exactly why they did it.” “If that isn’t a supply-side response, I don’t know what is.” Quoted in Jonathan Curry, “Undeterred by ‘Kansas Experiment,’ Laffer Presses Tax Cuts,” State Tax Today, August 9, 2017.
[56] Dave Trabert, “IRS Data Refutes Kansas Tax Evasion Theories,” Kansas Policy Institute, May 17, 2017, https://kansaspolicy.org/irs-data-refutes-kansas-tax-evasion-theories/.
[57] The 2009 data for Kansas are available at https://www.irs.gov/pub/irs-soi/09in17ks.xls.
[58] Non-resident owners of pass-through businesses operating in Kansas might also benefit from the exemption, but they would not be picked up in the IRS data. The apparent discrepancy between the 2.0 percent growth in Kansas returns reporting passthrough income cited here and the growth rates shown in Figure 4 is explained by the fact that the former includes farm income returns and the latter does not. The number of Kansas farms declined between 2012 and 2015.
[59] See the source cited in Note 34.
[60] See the source cited in Note 23, pp. 16-17.
[61] The fact that Kansas outperformed three of its five neighbors in the growth of sole proprietorships between 2012 and 2015 (see Figure 4) may also reflect adoption of the second tax avoidance strategy described above — that is, people deciding to become independent contractors to their former employers.
[62] See Note 22.
[63] See the source cited in Note 19, p. 9.
[64] See the source cited in Note 19, pp. 10-11.
[65] See Michael Leachman and Michael Mazerov, “State Personal Income Tax Cuts: Still a Poor Strategy for Economic Growth,” Center on Budget and Policy Priorities, May 14, 2015, https://www.cbpp.org/sites/default/files/atoms/files/3-21-13sfp.pdf.
[66] Leachman and Mazerov, preceding Note.
More from the Authors