As the baby boom generation ages into its peak years for retirement and disability, the demands on the Social Security Administration (SSA) are reaching all-time highs. Yet Congress has cut SSA’s core operating budget by 10 percent since 2010, after adjusting for inflation. [2] These cuts hurt SSA’s service to the public in every state. The agency has been forced to shutter field offices and shrink its staff, leading to longer waits for service and a record-high disability appeals backlog.The agency has been forced to shutter field offices and shrink its staff, leading to longer waits for service and a record-high disability appeals backlog. While the overall effect is a decline in service nationwide, the effects of the cuts vary considerably by state.
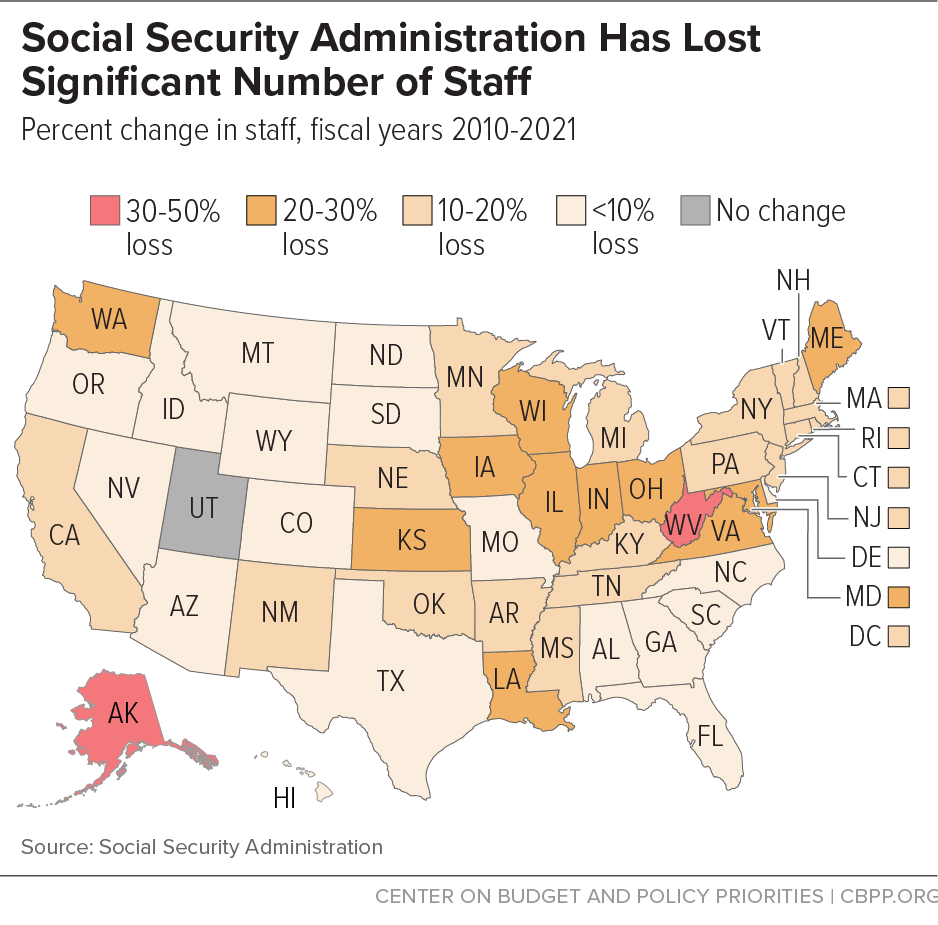
- SSA’s staff has shrunk 6 percent nationwide since 2010, so there are fewer people to take appointments, answer phones, and process applications for Social Security’s vital retirement, survivors, and disability benefits. As a result, workers and beneficiaries must wait longer to be served. Five states — Alaska, Iowa, Kansas, Nebraska, and West Virginia — have lost more than 15 percent of their staff since 2010.
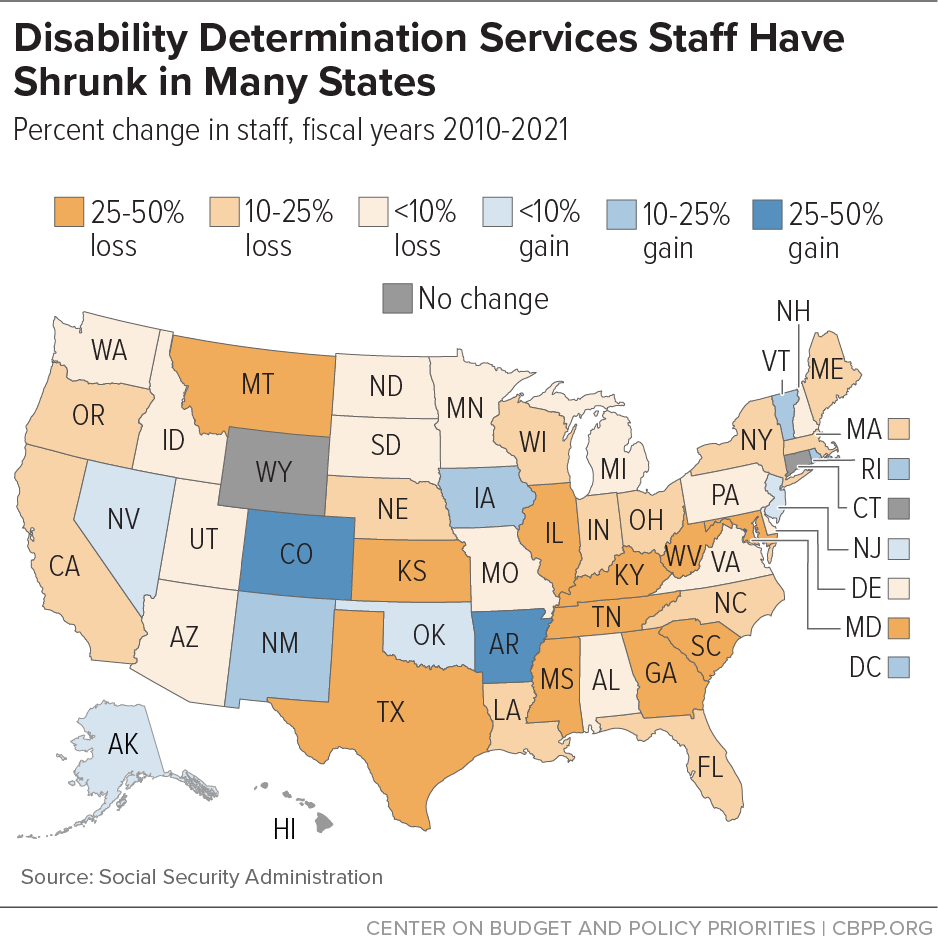
- In addition to its own staff, SSA funds state Disability Determination Service (DDS) employees, who decide whether applicants’ disabilities are severe enough to qualify for Disability Insurance (DI) or Supplemental Security Income (SSI). DDS staff has shrunk 14 percent nationwide since 2010. Seven states — Indiana, Kansas, Louisiana, Mississippi, South Dakota, Tennessee, and Texas — have lost over 20 percent of their DDS staff.
- Staff shortages have contributed to a record-high disability hearing backlog of over 1 million applicants. In seven states — Arizona, Hawaii, New Jersey, Nevada, North Carolina, South Carolina, and Wisconsin — plus Puerto Rico and the District of Columbia, the number of people awaiting a decision on their appeal has more than doubled since 2010, and in three of those, it has more than tripled. In three states — Delaware, Maryland, and North Carolina — plus the District of Columbia, the average processing time for an appeal is over 21 months. These long waits cause medical and financial hardship.
- SSA has been forced to close 64 field offices since 2010, at least one in nearly every state. Shuttering field offices reduces access to essential services, particularly in rural areas. New York alone has shuttered 12 field offices, while Pennsylvania has closed half a dozen.
Staff Attrition Causes Service to Decline in Every State
Almost all SSA’s operating budget is spent on staff, and the majority of SSA’s staff provide direct service to the public. As a result, funding cuts unavoidably result in service gaps. Tight budgets have forced SSA to cut staff by attrition, which results in uneven patterns across the country.
SSA’s front-line staff serves tens of millions of Americans every year. Its national toll-free telephone number serves as the gateway to the agency’s services, fielding 37 million calls in 2015. [3] Here, trained agents provide services such as answering questions about SSA’s programs, taking claims for retirement benefits, and setting up appointments. The agency’s field office staff assisted 41 million visitors in 2015, performing tasks like taking applications for benefits, processing name changes, and replacing lost Social Security cards.[4]
SSA’s behind-the-scenes work is equally important for ensuring prompt and accurate service. SSA’s payment service centers handle tasks such as awarding widows’ benefits when their spouses die, issuing back payments for DI beneficiaries who waited a year or more for a hearing, and resolving complex claims issues. SSA also funds state DDS employees, who decide whether applicants’ disabilities are severe enough to qualify for DI or SSI benefits.
Budget cuts have forced SSA to freeze hiring. As a result, since 2010, SSA has lost 5,000 employees, while state DDSs have lost 2,000. Inevitably, this means that beneficiaries must wait longer to be served. On the toll-free number, hold times and busy rates are up. In the field, SSA cut back on office hours — and since staff must serve nearly the same number of visitors in fewer hours and with fewer staff, applicants wait weeks for appointments, and walk-in visitors often wait hours.
SSA and DDS staff losses are spread unevenly across the nation, as Figures 1 and 2 and Appendix Table 1 show. Nationwide, SSA’s staff has shrunk by 6 percent since 2010, but five states — Alaska, Iowa, Kansas, Nebraska, and West Virginia — have lost more than 15 percent. Similarly, DDS staff has shrunk 14 percent nationwide since 2010, but seven states — Indiana, Kansas, Louisiana, Mississippi, South Dakota, Tennessee, and Texas — have lost over 20 percent.
Backlog in Disability Hearings Hurts Applicants All Over the Country
SSA pays disability benefits through the DI and SSI programs to workers with impairments severe enough that they can’t support themselves and their families.[5] The average processing time for an initial disability claim has held fairly steady in recent years at three to four months. If denied applicants appeal, they typically wait at least another year before an administrative law judge decides their case. SSA denied record numbers of disability applicants during the Great Recession, and hearing requests rose nearly 50 percent.[6] But instead of providing additional resources for these record-high hearing requests, Congress cut SSA’s operating budget.
The backlog of pending cases, which was shrinking before the funding cuts, has grown by over 50 percent since 2010, topping 1 million in 2015.[7] Rising workloads combined with funding cuts caused the hearings backlogs to mount. [8] Even as the annual number of beneficiaries appealing their decisions is returning to pre-recession levels, huge backlogs from those peak years remain. Meanwhile, the average wait for a final decision rose from 360 days to 540 between 2011 and 2016.
The hearings backlog has a high human cost. Waiting a year and a half for a final decision, as a typical appellant does, causes financial and medical hardship. Some applicants lose their homes or must declare bankruptcy while awaiting a hearing. Their health often worsens; some even die.[9] The longer that applicants wait for a final decision from SSA, the weaker their connections to the workforce become — which makes it harder to find work when they finally get an answer, whether or not they ultimately receive benefits.
In seven states — Arizona, Hawaii, New Jersey, Nevada, North Carolina, South Carolina, and Wisconsin — plus Puerto Rico and the District of Columbia, the number of people awaiting a decision on their appeal has more than doubled since 2010, and in three of those, it has more than tripled. In three states — Delaware, Maryland, and North Carolina — plus the District of Columbia, the average processing time for an appeal is over 21 months. (See Figure 3 and Appendix Table 2.)
Field Office Closures Hurt Communities Nationwide
SSA provides face-to-face service at its network of field offices. There, staff take claims for Social Security and SSI benefits, provide replacement Social Security cards, and process name changes. They offer personalized information for applicants navigating complex decisions about when to retire, and make decisions about whether a beneficiary is capable of managing his or her own finances. Their assistance is not limited to SSA’s programs. They also enroll beneficiaries in Medicare and its Extra Help program for low-income beneficiaries, and help beneficiaries apply for the Supplemental Nutrition Assistance Program (SNAP, formerly food stamps). In addition to field offices, SSA until recently hosted hundreds of mobile offices, which offered part-time service in other government offices. These mobile offices helped residents of remote areas access SSA services.
Since Congress began cutting SSA’s operating budget in 2010, the agency has closed 64 field offices, along with 533 — almost all — of the agency’s mobile offices. Shuttering field offices reduces access to essential services, particularly in rural areas. New York alone has shuttered 12 field offices, while Pennsylvania has closed half a dozen, as Appendix Table 3 shows.
Closing field offices has consequences. For example, when a field office closes, fewer people in the area apply for disability benefits — including many whose disabilities meet SSA’s strict criteria, according to recent research.[10]
SSA will always need to provide high-quality service in the field. Although straightforward requests can be handled online or by phone, more complex cases often require face-to-face help. SSA primarily serves Americans who are elderly or disabled, often at traumatic moments in their lives such as the onset of a disability or the death of a spouse. Its clients are diverse and include people suffering from severe mental impairments and people with limited ability to speak English. Its staff provide critical guidance to workers making complex, life-altering decisions. Providing prompt and thorough service in the field reduces errors that SSA staff must fix later.
Appendix TABLE 1 | ||||||
---|---|---|---|---|---|---|
Social Security and Disability Staff Changes by State | ||||||
Social Security Administration Staff | Disability Determination Services Staff | |||||
FY 2010 | FY 2015 | % Change | FY 2010 | FY 2015 | % Change | |
Alabama | 2,713 | 2,576 | -5% | 365 | 365 | 0% |
Alaska | 76 | 55 | -28% | 23 | 20 | -13% |
Arizona | 706 | 713 | 1% | 223 | 200 | -10% |
Arkansas | 534 | 480 | -10% | 404 | 395 | -2% |
California | 6,991 | 6,559 | -6% | 1,440 | 1,293 | -10% |
Colorado | 705 | 728 | 3% | 117 | 119 | 2% |
Connecticut | 403 | 363 | -10% | 114 | 114 | 0% |
Delaware | 110 | 108 | -2% | 41 | 48 | 17% |
Dist. of Columbia | 239 | 202 | -15% | 49 | 49 | 0% |
Florida | 2,753 | 2,748 | 0% | 1,045 | 942 | -10% |
Georgia | 1,777 | 1,767 | -1% | 523 | 434 | -17% |
Hawaii | 135 | 138 | 2% | 42 | 37 | -12% |
Idaho | 149 | 147 | -1% | 63 | 68 | 8% |
Illinois | 3,422 | 3,113 | -9% | 515 | 413 | -20% |
Indiana | 925 | 821 | -11% | 328 | 248 | -24% |
Iowa | 343 | 283 | -17% | 129 | 135 | 5% |
Kansas | 333 | 279 | -16% | 104 | 78 | -25% |
Kentucky | 825 | 782 | -5% | 424 | 373 | -12% |
Louisiana | 799 | 706 | -12% | 287 | 228 | -21% |
Maine | 209 | 192 | -8% | 58 | 49 | -16% |
Maryland | 12,749 | 11,362 | -11% | 232 | 213 | -8% |
Massachusetts | 1,200 | 1,125 | -6% | 250 | 255 | 2% |
Michigan | 1,543 | 1,391 | -10% | 594 | 518 | -13% |
Minnesota | 493 | 449 | -9% | 182 | 157 | -14% |
Mississippi | 639 | 586 | -8% | 320 | 252 | -21% |
Missouri | 2,784 | 2,734 | -2% | 361 | 338 | -6% |
Montana | 125 | 121 | -3% | 46 | 41 | -11% |
Nebraska | 182 | 153 | -16% | 77 | 75 | -3% |
Nevada | 265 | 272 | 3% | 95 | 86 | -9% |
New Hampshire | 151 | 143 | -5% | 51 | 43 | -16% |
New Jersey | 905 | 908 | 0% | 298 | 289 | -3% |
New Mexico | 961 | 927 | -4% | 86 | 77 | -10% |
New York | 4,099 | 3,841 | -6% | 934 | 776 | -17% |
North Carolina | 1,328 | 1,395 | 5% | 679 | 603 | -11% |
North Dakota | 95 | 87 | -8% | 22 | 21 | -5% |
Ohio | 1,794 | 1,597 | -11% | 589 | 497 | -16% |
Oklahoma | 563 | 512 | -9% | 308 | 296 | -4% |
Oregon | 428 | 412 | -4% | 195 | 172 | -12% |
Pennsylvania | 4,510 | 4,155 | -8% | 704 | 588 | -16% |
Puerto Rico | * | * | * | 142 | 115 | -19% |
Rhode Island | 166 | 161 | -3% | 47 | 45 | -4% |
South Carolina | 661 | 653 | -1% | 403 | 367 | -9% |
South Dakota | 94 | 83 | -12% | 33 | 26 | -21% |
Tennessee | 1,073 | 1,086 | 1% | 533 | 398 | -25% |
Texas | 3,477 | 3,323 | -4% | 1,034 | 766 | -26% |
Utah | 176 | 171 | -3% | 73 | 71 | -3% |
Vermont | 62 | 58 | -6% | 34 | 33 | -3% |
Virginia | 2,193 | 2,056 | -6% | 447 | 414 | -7% |
Washington | 1,627 | 1,632 | 0% | 318 | 285 | -10% |
West Virginia | 454 | 377 | -17% | 227 | 190 | -16% |
Wisconsin | 724 | 648 | -10% | 233 | 236 | 1% |
Wyoming | 44 | 45 | 2% | 15 | 16 | 7% |
Total | 70,202 | 65,696 | -6% | 15,856 | 13,867 | -13% |
APPENDIX TABLE 2 | ||||
---|---|---|---|---|
Disability Insurance Hearing Backlogs by State | ||||
Eligibility Hearing Backlogs | ||||
FY 2010 | FY 2016 | % Change | Average Hearing Processing Time, 2016 (days) |
|
Alabama | 31,505 | 37,267 | 18% | 514 |
Alaska | 899 | 780 | -13% | 473 |
Arizona | 9,053 | 19,184 | 112% | 538 |
Arkansas | 8,613 | 11,885 | 38% | 391 |
California | 58,752 | 95,695 | 63% | 553 |
Colorado | 10,673 | 14,401 | 35% | 514 |
Connecticut | 6,539 | 7,324 | 12% | 523 |
Delaware | 1,552 | 3,092 | 99% | 645 |
Dist. of Columbia | 3,300 | 7,264 | 120% | 669 |
Florida | 42,642 | 79,462 | 86% | 611 |
Georgia | 23,613 | 40,105 | 70% | 601 |
Hawaii | 574 | 1,786 | 211% | 436 |
Idaho | N.A. | N.A. | N.A. | N.A. |
Illinois | 23,684 | 31,654 | 34% | 542 |
Indiana | 14,545 | 26,729 | 84% | 514 |
Iowa | 3,169 | 5,915 | 87% | 528 |
Kansas | 5,581 | 9,352 | 68% | 492 |
Kentucky | 13,349 | 21,887 | 64% | 521 |
Louisiana | 14,664 | 21,452 | 46% | 410 |
Maine | 3,550 | 2,560 | -28% | 521 |
Maryland | 6,048 | 8,909 | 47% | 659 |
Massachusetts | 10,217 | 12,024 | 18% | 455 |
Michigan | 28,472 | 41,466 | 46% | 498 |
Minnesota | 8,857 | 12,216 | 38% | 411 |
Mississippi | 13,916 | 19,020 | 37% | 532 |
Missouri | 21,689 | 30,409 | 40% | 530 |
Montana | 3,926 | 5,271 | 34% | 472 |
Nebraska | 2,587 | 4,476 | 73% | 505 |
Nevada | 2,588 | 6,146 | 137% | 488 |
New Hampshire | 4,133 | 3,363 | -19% | 433 |
New Jersey | 9,498 | 29,197 | 207% | 618 |
New Mexico | 6,320 | 5,799 | -8% | 554 |
New York | 46,144 | 80,362 | 74% | 619 |
North Carolina | 20,031 | 44,749 | 123% | 649 |
North Dakota | 2,805 | 3,772 | 34% | 441 |
Ohio | 30,895 | 42,593 | 38% | 507 |
Oklahoma | 12,436 | 13,993 | 13% | 456 |
Oregon | 9,162 | 16,259 | 77% | 530 |
Pennsylvania | 41,937 | 65,047 | 55% | 582 |
Puerto Rico | 2,970 | 11,739 | 295% | 621 |
Rhode Island | 3,589 | 2,843 | -21% | 387 |
South Carolina | 12,969 | 27,991 | 116% | 610 |
South Dakota | N.A. | N.A. | N.A. | N.A. |
Tennessee | 25,744 | 39,379 | 53% | 513 |
Texas | 29,175 | 52,911 | 81% | 489 |
Utah | 4,757 | 5,834 | 23% | 542 |
Vermont | N.A. | N.A. | N.A. | N.A. |
Virginia | 13,857 | 22,688 | 64% | 533 |
Washington | 12,862 | 17,881 | 39% | 522 |
West Virginia | 12,075 | 17,707 | 47% | 579 |
Wisconsin | 7,451 | 17,002 | 128% | 566 |
Wyoming | 31,505 | N.A. | 18% | N.A. |
Total | 705,367 | 1,121,267 | 59% | * |
APPENDIX TABLE 3 | |
---|---|
Social Security Field Office Closures Since FY 2010 |
|
Number of Offices Closed | |
Alabama | - |
Alaska | 1 |
Arizona | - |
Arkansas | 1 |
California | 3 |
Colorado | - |
Connecticut | 2 |
Delaware | - |
Dist. of Columbia | 1 |
Florida | 3 |
Georgia | 2 |
Hawaii | - |
Idaho | - |
Illinois | 1 |
Indiana | - |
Iowa | 1 |
Kansas | 1 |
Kentucky | 1 |
Louisiana | 3 |
Maine | 1 |
Maryland | - |
Massachusetts | 2 |
Michigan | 1 |
Minnesota | - |
Mississippi | 1 |
Missouri | 1 |
Montana | - |
Nebraska | 1 |
Nevada | - |
New Hampshire | - |
New Jersey | 2 |
New Mexico | - |
New York | 12 |
North Carolina | 1 |
North Dakota | 1 |
Ohio | 1 |
Oklahoma | 1 |
Oregon | 2 |
Pennsylvania | 6 |
Puerto Rico | 3 |
Rhode Island | - |
South Carolina | 1 |
South Dakota | - |
Tennessee | 2 |
Texas | 3 |
Utah | - |
Vermont | - |
Virginia | 1 |
Washington | 1 |
West Virginia | - |
Wisconsin | - |
Wyoming | - |
Total | 64 |
End Notes
[1] Emily Horton contributed to this report.
[2] Kathleen Romig, “Budget Cuts Squeeze Social Security Administration Even as Workloads Reach Record Highs,” Center on Budget and Policy Priorities, June 3, 2016, http://www.cbpp.org/research/retirement-security/budget-cuts-squeeze-social-security-administration-even-as-workloads.
[3] Social Security Administration, Fiscal Year 2015 Agency Financial Report, https://www.ssa.gov/finance/2015/Full%20FY%202015%20AFR.pdf.
[4] Social Security Administration, Annual Performance Report, 2015-2017, https://www.ssa.gov/agency/performance/2016/FINAL_2015_2017_APR_508_compliant.pdf.
[5] For Social Security and SSI, disability is defined as the inability to earn above the substantial gainful activity (SGA) threshold ($1,130 per month in 2016) because of a medically determinable physical or mental impairment(s) which can be expected to result in death or last at least 12 months.
[6] Social Security Administration, Annual Statistical Supplement, Table 2.F9, 2008 and 2012.
[7] Social Security Administration, Annual Statistical Supplement, Table 2.F9, 2011-2015; SSA Budget Overview, February 2016, https://www.ssa.gov/budget/FY17Files/2017BO.pdf.
[8] In addition to funding constraints, inefficiencies in the Administrative Law Judge hiring process have hampered SSA’s ability to fill vacancies. (See Statement of Carolyn W. Colvin, Acting Commissioner, Social Security Administration, Before the House Appropriations Committee, Subcommittee on Labor, Health and Human Services, Education, and Related Agencies, February 26, 2015, https://www.ssa.gov/legislation/testimony_022615.html.) However, the Bipartisan Budget Act of 2015 addressed the hiring problem, and the Office of Personnel Management is working to implement the improvements.
[9] Kathy Ruffing, “No Surprise: Disability Beneficiaries Experience High Death Rates,” Center on Budget and Policy Priorities, April 4, 2013, http://www.cbpp.org/blog/no-surprise-disability-beneficiaries-experience-high-death-rates.
[10] Manasi Deshpande and Yue Li, “Who Are We Screening Out? Application Costs and the Targeting of Disability Programs,” 4th Annual Meeting of the Disability Research Consortium, August 3, 2016, http://www.nber.org/aging/drc/20160803drcmeeting/Panel%202.2%20Deshpande.pdf.