Social Security Keeps 21 Million Americans Out of Poverty: A State-by-State Analysis
Social Security benefits play a vital role in reducing poverty. Without Social Security, 21.4 million more Americans would be poor, according to the latest available Census data (for 2011). Although most of those whom Social Security keeps out of poverty are elderly, nearly a third are under age 65, including 1.1 million children. (See Table 1.) Depending on their design, reductions in Social Security benefits could significantly increase poverty, particularly among the elderly.
| Table 1 Effect of Social Security on Poverty, 2011 | |||
| Age Group | Percent in Poverty | Number Lifted Out of Poverty by Social Security | |
| Excluding Social Security | Including Social Security | ||
| Children Under 18 | 23.4 | 21.9 | 1,107,000 |
| Adults Ages 18-64 | 16.7 | 13.7 | 5,829,000 |
| Elderly Age 65 and Over | 43.6 | 8.7 | 14,480,000 |
| Total, All Ages | 21.9 | 15.0 | 21,415,000 |
| Addendum: Women Age 65 and Over | 48.3 | 10.7 | 8,696,000 |
| Source: Center on Budget and Policy Priorities based on data from the U.S. Census Bureau, Current Population Survey, March 2012. | |||
Social Security Lifts 14 Million Elderly Americans Out of Poverty
Almost 90 percent of people aged 65 and older receive some of their family income from Social Security.[2] Without Social Security benefits, 43.6 percent of elderly Americans would have incomes below the official poverty line, all else being equal; with Social Security benefits, only 8.7 percent do. These benefits lift some 14.5 million elderly Americans — including 8.7 million women — above the poverty line.
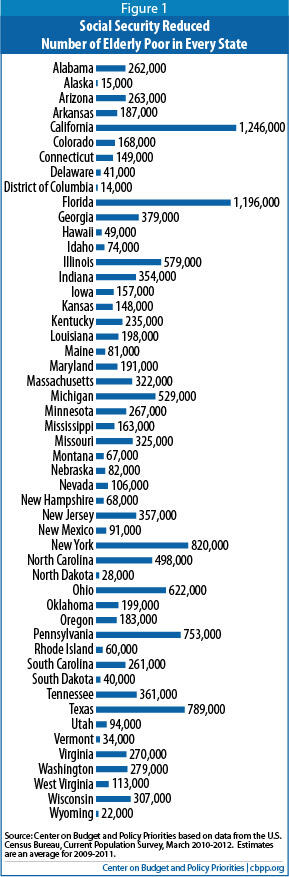
Social Security reduces elderly poverty dramatically in every state in the nation, as Figure 1 and Table 2 show. Without Social Security, the poverty rate for those aged 65 and over would meet or exceed 40 percent in 41 states; with Social Security, it is less than 10 percent in the large majority of states. Social Security lifts 1.2 million elderly people out of poverty in California and Florida, about 800,000 in New York, Texas, and Pennsylvania, and over half a million in Ohio, Illinois, and Michigan.
Social Security Lifts More Than 1 Million Children Out of Poverty
Social Security is important for children and their families as well as for the elderly. About 6 million children under age 18 (8 percent of all U.S. children) lived in families that received income from Social Security in 2011, according to Census data. This figure includes children who received their own benefits as dependents of retired, disabled, or deceased workers, as well as those who lived with parents or relatives who received Social Security benefits. In all, Social Security lifts 1.1 million children out of poverty.
Social Security records show that 3.2 million children under age 18 qualified for Social Security payments themselves in December 2011. (See Table 3.) Of these, 1.2 million were the survivor of a deceased worker. Another 1.7 million received payments because their parent had a severe disability. And 315,000 children under 18 received payments because their parent or guardian was retired.[3]
Technical Note
This analysis uses the Census Bureau’s official definition of poverty. In determining poverty status, the Census Bureau compares a family’s cash income before taxes with poverty thresholds that vary by the size and age of the family. The poverty thresholds in 2011 were $10,788 for an elderly individual, $13,596 for an elderly couple, and $23,021 for an average family of four.[4] To calculate the anti-poverty effects of Social Security, we determined each family’s poverty status twice — first excluding and then including the family’s Social Security benefits.
Our analysis considers the non-institutionalized population using data from the Census Bureau’s Current Population Survey (CPS), the survey that is used to produce official poverty estimates.[5] Each March the CPS collects information on personal income, health coverage, and other social and economic characteristics for the previous year. The national estimates reported here are for 2011. The state-by-state estimates are based on a three-year average (for 2009, 2010, and 2011) to improve the reliability of the results.
One critic of estimates such as these argues that they “do nothing to answer the question of what would have happened if Social Security had not existed.”[6] Indeed, this analysis does not take into account other changes that would occur in the absence of Social Security. If Social Security did not exist, many elderly individuals likely would have saved somewhat more and worked somewhat longer, and many might live with their adult children rather than in their own households. Other studies confirm, however, that Social Security has made a very large contribution to reducing poverty and that cutting Social Security benefits could substantially increase poverty among the elderly.[7]
| Table 2 Effect of Social Security on Poverty Among the Elderly by State, 2009-2011 | |||
| Percent in Poverty | Number Lifted Out of Poverty by Social Security | ||
| Excluding Social Security | Including Social Security | ||
| Alabama | 49.4 | 9.1 | 262,000 |
| Alaska | 36.8 | 10.4 | 15,000 |
| Arizona | 41.7 | 9.1 | 263,000 |
| Arkansas | 55.0 | 11.9 | 187,000 |
| California | 37.8 | 8.5 | 1,246,000 |
| Colorado | 36.9 | 7.2 | 168,000 |
| Connecticut | 37.6 | 6.2 | 149,000 |
| Delaware | 38.8 | 7.7 | 41,000 |
| District of Columbia | 34.9 | 15.6 | 14,000 |
| Florida | 45.8 | 8.9 | 1,196,000 |
| Georgia | 52.8 | 11.9 | 379,000 |
| Hawaii | 33.6 | 8.2 | 49,000 |
| Idaho | 46.8 | 8.5 | 74,000 |
| Illinois | 44.2 | 7.5 | 579,000 |
| Indiana | 48.8 | 8.0 | 354,000 |
| Iowa | 47.3 | 5.6 | 157,000 |
| Kansas | 46.9 | 6.7 | 148,000 |
| Kentucky | 51.4 | 9.2 | 235,000 |
| Louisiana | 50.3 | 15.0 | 198,000 |
| Maine | 47.4 | 8.0 | 81,000 |
| Maryland | 35.6 | 8.2 | 191,000 |
| Massachusetts | 40.7 | 7.4 | 322,000 |
| Michigan | 47.6 | 7.4 | 529,000 |
| Minnesota | 45.2 | 6.9 | 267,000 |
| Mississippi | 54.8 | 12.5 | 163,000 |
| Missouri | 47.3 | 6.9 | 325,000 |
| Montana | 50.1 | 7.8 | 67,000 |
| Nebraska | 42.1 | 6.6 | 82,000 |
| Nevada | 42.1 | 9.4 | 106,000 |
| New Hampshire | 45.1 | 6.5 | 68,000 |
| New Jersey | 39.4 | 7.8 | 357,000 |
| New Mexico | 42.1 | 10.4 | 91,000 |
| New York | 42.8 | 10.9 | 820,000 |
| North Carolina | 50.9 | 10.0 | 498,000 |
| North Dakota | 42.1 | 8.7 | 28,000 |
| Ohio | 48.3 | 8.1 | 622,000 |
| Oklahoma | 46.1 | 7.2 | 199,000 |
| Oregon | 40.8 | 7.0 | 183,000 |
| Pennsylvania | 47.4 | 9.1 | 753,000 |
| Rhode Island | 47.9 | 8.3 | 60,000 |
| South Carolina | 51.9 | 11.4 | 261,000 |
| South Dakota | 42.8 | 7.3 | 40,000 |
| Tennessee | 54.8 | 11.5 | 361,000 |
| Texas | 41.4 | 10.7 | 789,000 |
| Utah | 42.1 | 7.3 | 94,000 |
| Vermont | 49.1 | 8.5 | 34,000 |
| Virginia | 37.8 | 9.5 | 270,000 |
| Washington | 40.0 | 6.7 | 279,000 |
| West Virginia | 51.8 | 9.0 | 113,000 |
| Wisconsin | 42.6 | 5.1 | 307,000 |
| Wyoming | 41.2 | 6.6 | 22,000 |
| Source: Center on Budget and Policy Priorities based on data from the U.S. Census Bureau, Current Population Survey, March 2010-2012. | |||
| Table 3 Social Security Beneficiaries by State and Age, December 2011 | ||||
| Total | Age 65 and Older | Age 18-64 | Children Under Age 18 | |
| Alabama | 1,037,438 | 627,589 | 329,654 | 80,195 |
| Alaska | 82,109 | 52,635 | 21,732 | 7,742 |
| Arizona | 1,104,545 | 783,759 | 259,461 | 61,325 |
| Arkansas | 647,077 | 399,589 | 197,044 | 50,444 |
| California | 5,129,529 | 3,692,234 | 1,160,957 | 276,338 |
| Colorado | 721,274 | 514,038 | 168,796 | 38,440 |
| Connecticut | 630,447 | 472,762 | 127,539 | 30,146 |
| Delaware | 176,885 | 123,940 | 43,496 | 9,449 |
| District of Columbia | 75,755 | 52,578 | 18,618 | 4,559 |
| Florida | 3,894,179 | 2,835,182 | 867,238 | 191,759 |
| Georgia | 1,524,263 | 982,617 | 434,226 | 107,420 |
| Hawaii | 234,314 | 177,767 | 44,908 | 11,639 |
| Idaho | 278,563 | 192,561 | 69,890 | 16,112 |
| Illinois | 2,065,432 | 1,475,030 | 477,476 | 112,926 |
| Indiana | 1,219,879 | 820,232 | 324,861 | 74,786 |
| Iowa | 592,000 | 435,929 | 130,205 | 25,866 |
| Kansas | 498,707 | 353,505 | 116,734 | 28,468 |
| Kentucky | 913,548 | 547,184 | 297,965 | 68,399 |
| Louisiana | 809,450 | 509,036 | 234,569 | 65,845 |
| Maine | 306,600 | 204,129 | 84,964 | 17,507 |
| Maryland | 872,919 | 627,752 | 195,228 | 49,939 |
| Massachusetts | 1,161,122 | 819,775 | 275,084 | 66,263 |
| Michigan | 2,016,684 | 1,331,766 | 563,127 | 121,791 |
| Minnesota | 904,803 | 656,491 | 206,106 | 42,206 |
| Mississippi | 609,651 | 363,797 | 193,116 | 52,738 |
| Missouri | 1,188,437 | 791,322 | 323,531 | 73,584 |
| Montana | 198,230 | 139,855 | 48,113 | 10,262 |
| Nebraska | 313,087 | 230,834 | 66,888 | 15,365 |
| Nevada | 424,836 | 300,676 | 100,435 | 23,725 |
| New Hampshire | 262,952 | 178,509 | 67,821 | 16,622 |
| New Jersey | 1,500,403 | 1,104,066 | 318,478 | 77,859 |
| New Mexico | 370,911 | 248,606 | 97,585 | 24,720 |
| New York | 3,337,276 | 2,347,514 | 805,485 | 184,277 |
| North Carolina | 1,808,331 | 1,193,445 | 507,017 | 107,869 |
| North Dakota | 121,335 | 91,509 | 24,675 | 5,151 |
| Ohio | 2,166,271 | 1,499,952 | 549,988 | 116,331 |
| Oklahoma | 717,398 | 478,397 | 191,215 | 47,786 |
| Oregon | 734,841 | 522,183 | 180,428 | 32,230 |
| Pennsylvania | 2,617,879 | 1,850,453 | 631,965 | 135,461 |
| Rhode Island | 207,122 | 144,356 | 51,525 | 11,241 |
| South Carolina | 956,097 | 620,923 | 275,039 | 60,135 |
| South Dakota | 156,102 | 116,417 | 32,606 | 7,079 |
| Tennessee | 1,287,683 | 827,555 | 374,766 | 85,362 |
| Texas | 3,551,961 | 2,406,196 | 896,302 | 249,463 |
| Utah | 335,444 | 235,011 | 76,034 | 24,399 |
| Vermont | 132,268 | 90,916 | 34,149 | 7,203 |
| Virginia | 1,318,580 | 913,142 | 329,364 | 76,074 |
| Washington | 1,127,126 | 796,472 | 276,144 | 54,510 |
| West Virginia | 451,039 | 277,734 | 144,242 | 29,063 |
| Wisconsin | 1,085,632 | 766,501 | 265,677 | 53,454 |
| Wyoming | 93,748 | 66,999 | 21,782 | 4,967 |
| Totala. | 55,404,480 | 38,292,328 | 13,866,846 | 3,245,306 |
| Source: Social Security Administration, Annual Statistical Supplement, 2012, Table 5.J5. a. Includes outlying areas and foreign countries (not shown). | ||||
End Notes
[1] The authors wish to thank William Chen for his assistance in preparing this paper.
[2] Kathy A. Ruffing and Paul N. Van de Water, Top Ten Facts About Social Security, Center on Budget and Policy Priorities, August 2010 (update forthcoming).
[3] Social Security Administration, Annual Statistical Supplement to the Social Security Bulletin, 2012, Table 5.J10.
[4] Poverty thresholds depend on the size of the family and the ages of its members; this figure is a weighted average for families of four. For more information, see http://www.census.gov/hhes/www/poverty/data/threshld/index.html.
[5] U.S. Census Bureau, Income, Poverty, and Health Insurance Coverage in the United States: 2011, Series P60-243, September 2012.
[6] Charles P. Blahous III, Reforming Social Security for Ourselves and Our Posterity, Westport, CT: Praeger, 2000, p. 13.
[7] Eugene Smolensky, Sheldon Danziger, and Peter Gottschalk, “The Declining Significance of Age in the United States: Trends in the Well-Being of Children and the Elderly Since 1939,” in John L. Palmer, Timothy Smeeding, and Barbara Boyle Torrey, eds., The Vulnerable, Washington: Urban Institute, 1988; Gary V. Engelhardt and Jonathan Gruber, “Social Security and the Evolution of Elderly Poverty,” National Bureau of Economic Research Working Paper 10466, May 2004.
More from the Authors

Areas of Expertise
