New Data Show Income Concentration Jumped Again In 2005

Income Share of Top 1% At Highest Level Since 1929

Economists Thomas Piketty and Emmanuel Saez recently made available an updated version of their groundbreaking data series on U.S. income inequality.[1]  The data are unique because of the detailed information they provide regarding income gains at the top of the income scale and because they extend back to 1913.  The data offer important insight into the distribution of income gains during the current economic expansion and may shed some light on recent revenue trends (see box below).

The new data show:

  • Between 2004 and 2005, the average income of the highest-income 1 percent of households increased by $119,000, after adjusting for inflation.  The average income of the bottom 90 percent of households increased by about $550.
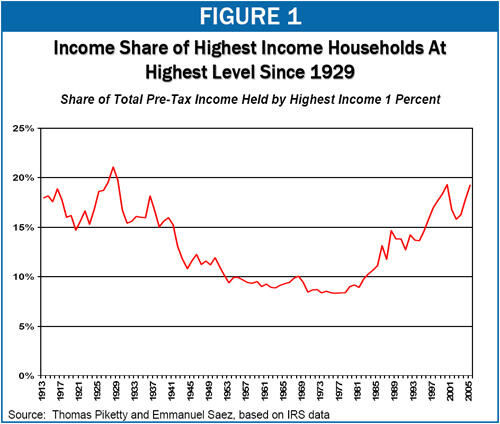
  • Income concentration, which increased in 2003 and rose sharply in 2004, jumped again in 2005.  The share of pre-tax income in the nation that goes to the top 1 percent of households increased from 17.8 percent in 2004 to 19.4 percent in 2005. Only three times since World War II has the percentage of income received by the top 1 percent risen this much in a single year (in percentage point terms).  One of those three times was 2004.
  • The jump in income concentration in 2005 brought the percentage of income going to the top 1 percent of households to its highest level since 1929. [2]
  • The large jump in income concentration reflects another year of very uneven income gains.  From 2004 to 2005, the average incomes of the bottom 90 percent of households grew by less than 2 percent, after adjusting for inflation.  In contrast, the average income of the top 1 percent of households experienced a jump of nearly 14 percent, after adjusting for inflation.  Moreover, average income is pulled up by gains at the top of the income scale; IRS data suggest that even the less than 2 percent gain among the bottom 90 percent of households may well be due mostly to gains in the top half or top quartile of the income spectrum.
  • The top 1 percent of households (those with annual incomes above about $350,000 in 2005) garnered 47 percent — nearly half — of the total income gains in 2005.  More than two thirds of total income gains accrued to those in the top decile (the highest-income 10 percent) of the income scale.  Less than one third of total income gains went to the bottom 90 percent of households. 
  • Income gains were even more pronounced among those with even higher incomes.  The incomes of the top one-tenth of 1 percent (0.1 percent) of households grew more rapidly than the incomes of the top 1 percent of households.  The share of national income received by the top one-tenth of 1 percent of households increased by 1.0 percentage point from 2004 to 2005 and was as high as in 2000, when it reached its highest level since 1929.  (See Table 1.) 

Table 1:
Change in Income Shares, 2004-2005

Share of Households

Share of National
Pre-tax Income, 2004

Share of National
Pre-tax Income, 2005

Percentage
Point Change

Bottom 99%

82.2%

80.6%

-1.6

Top 1%

17.8%

19.4%

+1.6

Top Tenth of 1%

7.8%

8.8%

+1.0

Note:  A percentage point of income was equivalent to $75 billion in 2005.
Figures may not add due to rounding.

Image
3-29-07inc-f1.jpg

Data May Shed Some Light on Recent Revenue Trends

In each of the past three years (fiscal years 2005, 2006, and 2007), federal revenues have come in considerably higher than expected.  Each year, the Administration and other tax-cut supporters have credited the Administration’s tax cuts with the positive revenue “surprises.”  Many tax policy experts, however, have warned against attaching too much significance to revenue surprises, noting that such surprises are common and that there were negative revenue surprises in 2001, 2002, and 2003.  They have pointed out that revenues often come in higher than expected during expansions and lower than expected during recessions, regardless of tax policies.  For example, there were substantial positive revenue surprises at the equivalent point in the 1990s business cycle, following tax increases in 1990 and 1993.* 

Some experts also have observed that part of the explanation for recent revenue surprises might be growing income inequality.  High-income taxpayers pay taxes at higher rates.  As a result, an increase in the share of the nation’s income that goes to these households leads to an increase in revenues, even if there is no increase in overall economic growth.   The Congressional Budget Office and Goldman Sachs, among others, suggested that this might be part of the explanation for higher-than-expected 2006 revenues.** 

The new Piketty Saez data provide some support for this theory.  Because of lags in the availability of data, CBO likely made its 2006 revenue projections based on income distribution data available only through 2003 and its 2007 revenue projections based on income distribution data only through 2004.  But the new Piketty Saez data show that, between 2003 and 2005, the share of national pre-tax income going to the top 1 percent of households increased by 3.2 percentage points, the largest two-year increase since the 1920s; about half of this large jump occurred between 2004 and 2005.***  While data are not yet available for 2006 and 2007, it is highly unlikely that this increase in income concentration was reversed.  Thus, the substantial increases in income concentration in 2004 and 2005 may have contributed to the 2005, 2006, and 2007 revenue “surprises.”

*See Jason Furman, “Do Revenue Surprises Tell Us Much About the Cost of Tax Cuts?” Center on Budget and Policy Priorities, July 18, 2006. 

**Congressional Budget Office, “Monthly Budget Review,” May 4, 2006, and Goldman Sachs, “The Macro Effects of Rising Income Inequality,” June 30, 2006.

*** If capital gains, which are taxed at lower rates, are excluded, the income share of the top 1 percent increased by 2.5 percentage points between 2003 and 2005, the largest increase since the 1920s except for 1986-1988.

The Piketty and Saez data provide valuable insight into the distribution of income gains during the current economic expansion.  The incomes of nearly all groups fell in 2001 and 2002.  The incomes of those at the top of the income spectrum fell by the largest percentage (at least in part as a result of the decline in the stock market), and their share of total income consequently declined. 

In 2003, however, when income growth resumed, so did the long-term trend toward increased income inequality.  And in 2004, when income growth accelerated, inequality rose sharply. 

The 2005 data provide further evidence that the long-term trend toward growing income concentration has resumed full force in this expansion.  With the percentage of income going to the top 1 percent of households already above its 2000 level (the level it reached nine years into the 1990s expansion) — and with income concentration thus returning to its highest level since before the Great Depression — it is difficult to argue that these data depict an insignificant, short-term blip.

Prominent Leaders, Including President Bush, Have Acknowledged a Need to Address Rising Inequality 

“I know some of our citizens worry about the fact that our dynamic economy is leaving working people behind. We have an obligation to help ensure that every citizen shares in this country's future. The fact is that income inequality is real; it's been rising for more than 25 years. ”
- President Bush, January 31, 2007

“[R]ising inequality is a concern in the American economy.  It's important for our society that everyone feels that they have an opportunity to participate in the opportunities that the economy is creating.”
- Federal Reserve Chairman Bernanke, February 15, 2006

“[There is a] really serious problem here, as I’ve mentioned many times before this [House] committee, in the consequent concentration of income that is rising...”
 - Former Fed. Chairman Greenspan, July 20, 2005
End Notes

[1] Piketty and Saez rely on detailed Internal Revenue Service micro-files for most years, but use more aggregated IRS data and statistical techniques to extend their series back to 1913 and forward to 2005 (years for which detailed micro-files are not available).  They recently updated their 2005 estimates based on updated IRS data.  For details, see Thomas Piketty and Emmanuel Saez, “Income Inequality in the United States:  1913-1998,” Quarterly Journal of Economics, February 2003.  The updated data series is available at http://elsa.berkeley.edu/~saez/TabFig2005prel.xls.

[2] Piketty and Saez present three different data series, each of which uses a different income concept and, therefore, yields somewhat different estimates of the share of income going to each income group.  (For example, estimates of the share of income going to the top 1 percent in 2005 range from 17.4 in one series to 19.4 percent in the series we emphasize here to 21.9 percent in the third series that Piketty and Saez present.)  We focus on the series that includes capital gains income in measuring the income that households receive, but ranks households according to their non-capital gains income.  The authors indicate that this approach to sorting households gets around the volatility associated with capital gains realizations and provides a better measure of the underlying distribution of income than a measure that sorts households according to income that including capital gains.  But the authors also present a data series that includes capital gains income and ranks households by income that includes capital gains and a series that excludes capital gains altogether.  In the series that includes capital gains and ranks households by income including capital gains, the percentage of income going to the top 1 percent of households in 2005 was at its highest level since 1929.  In the series that excludes capital gains, the percentage of income going to the top 1 percent of households in 2005 was at its highest level since 1936.