Large Majority of Housing Voucher Recipients Work, are Elderly, or Have Disabilities
Higher Housing Costs Drive Longer Stays for Working Families
In light of renewed interest among policymakers in increasing the "self-sufficiency" of recipients of housing assistance (and other public benefit programs), we used recent administrative data submitted to the Department of Housing and Urban Development (HUD) by state and local housing agencies to analyze the demographic characteristics and labor force attachment of households receiving assistance under the Section 8 Housing Choice Voucher (HCV) program. Our major findings are as follows:
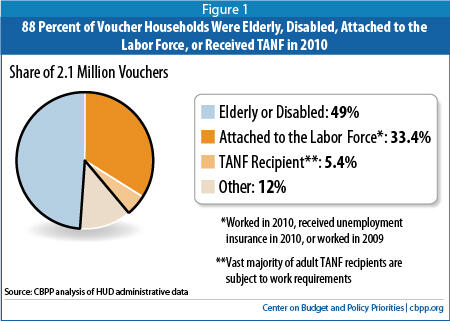
- In 2010, 88 percent of all voucher households were elderly, disabled, working (or had recently worked), or likely to be subject to a work requirement under the Temporary Assistance for Needy Families (TANF) program. Only 251,000 voucher households nationwide did not fall into one of these categories. Image
- Elderly or disabled households make up nearly half (49 percent) of all voucher households, a significant increase over the past decade. This increase, which stemmed largely from a jump in the number of voucher households headed by a non-elderly person with disabilities, may have been driven substantially by restrictions on the types of households that can receive newly authorized vouchers.
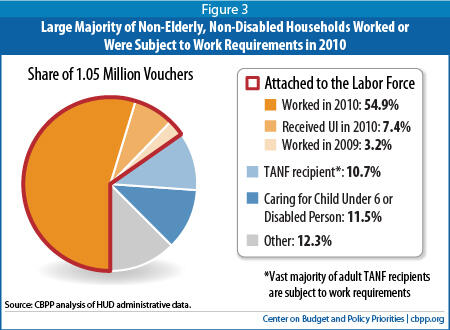
- Three-fourths of the voucher households that are not elderly or disabled either work or participate in other programs that have work requirements. Most of these households worked in 2010 or had worked recently, despite the high unemployment last year. Nearly half of the remaining households in this group include a pre-school child or a child or other adult who is disabled and may need care.
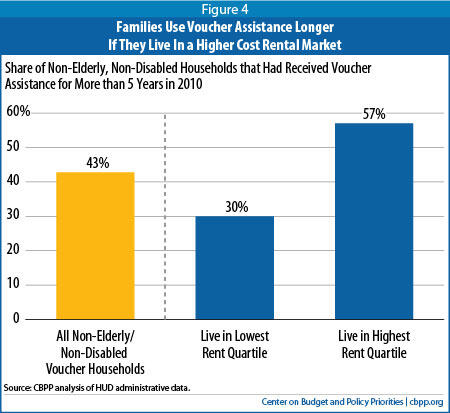
- Households use voucher assistance longer if they live in a higher-cost rental market. Non-elderly, non-disabled households in low-cost areas were only about half as likely as similar households in high-cost areas to have received assistance for five years or more. The longer stays on the program in higher-cost areas do not appear to be driven by lack of work effort: non-elderly, non-disabled households in high-cost areas that received voucher assistance for more than five years were more likely to work than other voucher holders. Despite typical earnings above the minimum wage level, however, voucher families living in the highest cost areas need continuing assistance to avoid having to pay the large majority of their incomes for housing costs.
Nearly Half of Participants Are Elderly or Disabled, a Significant Increase in Last Decade
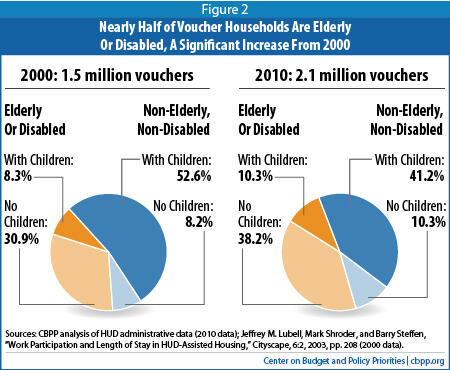
The composition of the voucher population changed significantly over the decade as well. Nearly half (49 percent) of the households that received voucher assistance in 2010 were elderly or disabled,[2] a substantial increase from this group's 39 percent share in 2000.[3] About one out of five of those elderly or disabled households has minor children, unchanged from a decade ago.
The substantial increase in the share of vouchers used by elderly or disabled households primarily reflects an 82 percent increase in the number of voucher households headed by a non-elderly person with disabilities. In 2010, some 608,000 disabled families received housing voucher assistance, 29 percent of all voucher households. By contrast, in 2000, 334,000 disabled families received 22 percent of housing vouchers. People with disabilities had the largest percentage increase in receipt of voucher assistance of any demographic group we analyzed. A recent HUD study highlights the relative success of federal housing programs in targeting assistance to people with disabilities, who are twice as likely to receive federal housing assistance as other renters.[4]
The share of vouchers serving elderly households also rose between 2000 and 2010 by 2.5 percentage points (154,000 households). Multiple factors probably produced these changes, as discussed below.
Demographic Changes Partly Reflect Restrictions on Who Can Receive Newly Authorized Vouchers
Available data are not sufficiently detailed to explain why the share of housing vouchers assisting different types of households changed significantly over the decade. It seems unlikely, however, that the changes described above resulted primarily from changes in the types of households seeking vouchers. Unmet needs for housing assistance among all demographic groups were high throughout the decade. In every demographic group discussed here, there were substantially more households with worst-case housing needs in 2009 than there had been in 1999. [5] Only about one in four eligible households receives federal rental assistance of any type.
The growth in the share of vouchers going to elderly households, non-elderly disabled households, or other households without minor children (see the box above) has apparently been driven to a large extent by restrictions on the types of households that can receive new vouchers. HUD awarded about 600,000 new vouchers to state and local housing agencies over the decade,[6] only 155,600 of which did not have such restrictions.[7]
Share of Vouchers Assisting Families With Children Has Declined Significantly
The share of vouchers going to families with children declined from 61 percent in 2000 to 52 percent in 2010. Even the 2000 level reflected a decline from five years earlier, when 68 percent of voucher-assisted households included minor children.* The number of families with children receiving voucher assistance increased by 166,000 over the decade, but nearly three-fourths of the additional vouchers served other types of households.
These changes occurred at the same time that housing needs among very low-income renters with children grew significantly. Between 1999 and 2009, the number of very low-renters with children who lacked housing assistance and had what HUD calls "worst-case housing needs" (meaning that they paid more than half of their income for housing costs or lived in severely substandard housing) grew from 1.8 million to 2.7 million.** Recent data indicate that the number of homeless families with children also has increased substantially.***
The reduction in the share of vouchers going to families with children reflects the significant increase in the share of vouchers going to people with disabilities, as discussed in the text, as well as the increase in the share of vouchers going to non-elderly, non-disabled households without minor children. The number of households with vouchers in the latter group rose by 76 percent (or 93,500) between 2000 and 2010; one in five households receiving voucher assistance is in this group, compared to 13 percent in 2000. Even with the increase in the share of vouchers serving this group, however, these households continue to have a higher incidence of "worst-case needs" for housing assistance than any other group of households does.****
Despite these developments, the HCV program still assists 40 percent more families with children — 1,080,000 such families — than all other HUD rental assistance programs combined. (Other HUD programs provided rental assistance to 766,000 families with children in 2010, according to HUD data.)
* Jill Khadduri, Mark Shroder, and Barry Steffen, "Can Housing Assistance Support Welfare Reform?" in Barbara Sard and Amy S. Bogdon, editors , A Place to Live, a Means to Work, Fannie Mae Foundation 2003, Table 2.10, p. 48.
** See note 5.
*** Douglas Rice, "Hardship in America, Part 3: Homelessness Growing Among Families with Children," Center on Budget and Policy Priorities, November 22, 2011.
**** Steffen et al., n. 5.
About half of the new vouchers (302,000) replaced other federal housing assistance; about two-thirds of the units replaced were in privately owned properties, which primarily house elderly households.[8] Such "tenant protection" vouchers typically were issued to households living in units that lost federal assistance, though if these households ceased to receive assistance the vouchers were reissued to applicants at the top of the housing agencies' waiting lists.
In addition, Congress directed that about 70,000 of the new vouchers awarded in this period must serve non-elderly people with disabilities (including homeless veterans). These vouchers must continue to serve the same types of households when they become available for reissuance. [9]
Where federal policy has not prescribed the types of households that may receive particular vouchers, housing agencies have broad discretion in the management of their waiting lists. They can prioritize certain types of applicants — such as those who are homeless or are victims of natural disasters — so long as three out of four new households admitted to the HCV program each year are "extremely low-income," meaning that their income does not exceed 30 percent of the area median income (as determined by HUD). It is possible that the efforts of the George W. Bush Administration to end chronic homelessness, and the development of hundreds of community plans to achieve this goal, encouraged agencies to adopt preferences for the homeless that increased the share of vouchers used by persons with disabilities and other households without children.
Three-Fourths of Non-Elderly, Non-Disabled Households Work or Are Likely to be Subject to Work Requirements
Concerns about work effort among recipients of housing assistance typically focus on families that are not elderly or disabled. Such families, 80 percent of which had minor children in 2010, made up slightly more than half of the households that received housing voucher assistance last year. They can be divided into three broad groups:
- Households attached to the labor market. Nearly two-thirds (66 percent) of non-elderly, non-disabled households worked in 2010 or had worked recently as evidenced by receipt of unemployment insurance in 2010 or reported earnings in 2009, despite the weak economy.
- Households subject to TANF work requirements. Another 11 percent of non-elderly, non-disabled households received assistance from state TANF programs that impose work requirements on the vast majority of adult recipients. Taken together, then, about three-fourths of all non-elderly, non-disabled housing voucher households worked in 2010 or 2009 or likely are required to look for or prepare for work.
- Households neither attached to the labor market nor subject to TANF work requirements. Of the remaining non-elderly, non-disabled households, nearly half (48 percent) include a pre-school child or a member (other than the head or spouse) who has a disability. Responsibilities to care for these individuals may make it difficult or impossible for single heads of households to work without child care subsidies or other assistance.
The rest of this section examines these three groups in more detail.
Households Attached to the Labor Force
Some 7 percent of non-elderly, non-disabled households receiving voucher assistance who did not work in 2010 received unemployment insurance (UI). To receive UI benefits in 2010 in most states, individuals would have to have worked in covered employment in at least two of the five calendar quarters preceding their claim.[11]
Another 3 percent of non-elderly, non-disabled households receiving voucher assistance worked in 2009 but lost their jobs in 2010 and did not receive UI.[12] It is not surprising that UI was not available to these households: on average, only 40 percent of the unemployed received UI in 2010.[13]
Households Subject to TANF Work Requirements
We estimate that 11 percent of non-elderly, nondisabled households that did not work in 2009 or 2010 or receive unemployment insurance received TANF benefits in 2010 and likely were subject to work requirements.[14] These 113,000 families include 935 families who did not receive TANF benefits in 2010 due to a sanction for failure to comply with work requirements; federal law prohibits rent reductions for families when they lose welfare income due to such work-related sanctions. The 113,000 estimate may be somewhat high or low, for reasons explained in the Methodological Appendix.
Another 11,000 voucher households received General Assistance benefits in 2010. They may be subject to work requirements under state or local rules, but we did not have sufficient information to make that judgment and therefore did not consider GA recipients as subject to work requirements, although many of them are.[15]
Households Not Attached to the Labor Force or Subject to a Work Requirement
In 2010, only 251,000 non-elderly, non-disabled households receiving HCV assistance were neither attached to the labor force (as evidenced by current or recent work as described above) nor receiving TANF and likely subject to TANF work requirements. These households make up only 12 percent of all households in the HCV program. That is, fully 88 percent of all voucher households in 2010 were elderly, disabled, working or worked recently, or participating in a program that has work requirements. (See Figure 1.)
Unfortunately, little information relevant to the work capacity of these households is available. This is what we can learn from the HUD data:
- Nearly half of these households (48 percent) include either a pre-school child or a child or other adult who is disabled. Only 5,200 of these 121,000 households include a second parent. The lack of another caretaker could make it difficult or impossible for the head of household to work unless funds are available to provide alternative care for these dependents.
- About 60 percent of these households have received voucher assistance for less than five years, indicating that they have received voucher assistance for less time than is typical of other voucher households.[16]
- These households are spread among nearly all of the state and local agencies that administer HCV programs. Most agencies do not serve a sufficient number of such individuals to provide the scale that may be needed to justify the staff time required for a work-related intervention. For example, only about 20 percent of the agencies that administer HCV programs (493 agencies) serve more than 100 such households.
- Despite their lack of earnings, UI, or TANF benefits, most of these households (73 percent) report annual income of more than $5,000 in 2010. Their income comes from a wide variety of sources such as child support, pensions, and foster care payments. [17] One of every six of these households receives SSI benefits for a disabled child or a disabled or elderly adult who is not the head of the household or the spouse.
Based on research on the growing "disconnected" population of single mothers who are neither working nor receiving welfare benefits, [18] it is plausible that some of these households have exhausted the TANF benefits available in their states but have been unable to find work. Some may be in the process of applying for disability benefits. [19] Without further research, it is not possible to know whether efforts to promote work among these households would be cost-effective, even where housing agencies serve a substantial number of such "disconnected" households.
High Rents Drive Duration of Voucher Use
Prior analyses of lengths of stay on the voucher program have not examined the possible correlation between duration of voucher use and rental costs in the area.[20] We divided the two main groups of households in our analysis — non-elderly, non-disabled households and elderly or disabled households — into housing cost quartiles based on the two-bedroom HUD Fair Market Rent for the area in which they lived. This breakdown is illuminating. The key findings are:
- Families use voucher assistance longer if they live in a higher-cost rental market. In 2010, 43 percent of non-elderly, non-disabled households had received voucher assistance for more than five years. But in the geographic areas where the one-quarter of non-elderly/non-disabled voucher households who faced the lowest rents lived, only 30 percent of assisted households had received voucher assistance for more than five years, compared to 57 percent of such households in the geographic areas in the highest rent quartile. [21]
- Families that receive voucher assistance for extended periods in high-cost areas are more likely to work than other voucher holders. In the areas in the highest-cost quartile, 64 percent of long-staying households worked in 2010, compared with 50 percent of long-staying households in areas in the lowest-cost quartile. This finding is discussed further below.
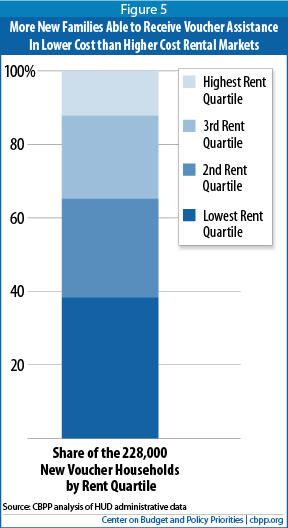
- Many more new families are able to receive voucher assistance in lower-cost rental markets than higher-cost ones. In 2010, 11 percent of all participating households had been receiving voucher assistance for less than a year. A plurality of these 228,000 new entrants — 38 percent — lived in the areas in the lowest quartile for rents. In contrast, only 12 percent of new entrants lived in the highest-rent areas, likely because fewer families gave up their vouchers in these areas.
An important lesson from these findings is that when Congress makes few if any new vouchers available and applicants can be admitted only when families leave the program, vouchers are least available in the areas where they are most needed to offset high housing costs. In the highest cost quartile of areas, fewer than 28,000 of the 522,000 voucher households were households that had newly entered the program in the prior year.
Families That Receive Voucher Assistance for Extended Periods in High-Cost Areas Are More Likely to Work Than Other Voucher Holders
Despite this greater work effort, working families, particularly in the highest-cost areas, continued to need assistance to afford a decent place to live. Some 99,000 non-elderly, non-disabled households who received voucher assistance for more than five years and lived in the highest-cost areas had earnings in 2010; their median annual income was $21,136.[22] To remain in their housing without a voucher, the typical family in this group would have to pay 81 percent of its income for rent and utilities. Such an extremely high rent burden is unlikely to be sustainable; without voucher assistance, many families would have to move to overcrowded or poor-quality housing in neighborhoods with less adequate services. Some could become homeless.
To afford their current rent without a voucher — and without paying more than 30 percent of income for housing, the longstanding federal affordability standard — the typical working family that currently receives a voucher and lives in a high cost area would need an annual income of more than $56,000. Even in the lowest-cost areas, such families would need to have incomes of more than $27,000 per year to be able to afford their housing at no more than 30 percent of income, without a voucher.
The substantial gap between income levels and housing costs underscores the importance of strategies that can significantly increase the potential earnings of assisted households. Unfortunately, many efforts to increase earnings among adults with limited education have not been successful, so it is important to ground such initiatives in evidence of what works.[23]
Methodological Appendix
Data Sources
This analysis uses U.S. Department of Housing and Urban Development (HUD) administrative data on households that participated in the Section 8 Housing Choice Voucher (HCV) program during calendar years 2009-2010. The data are an extract from the Family Report Form HUD-50058.
Our total sample for 2010 consisted of 2,097,992 active household records. This number of active records corresponds closely to the 2,083,187 households that received HCV assistance, on average, in 2010, based on CBPP analysis of data from HUD's Voucher Management System ("Voucher Utilization Data, 2004-2010," Center on Budget and Policy Priorities, National Fact Sheet, October 19, 2011,
).The records analyzed may include some or all of the approximately 15,000 households that received assistance under HUD's Section 811 Mainstream Voucher program. There was insufficient information available to exclude these households, if they were assisted by state or local housing agencies that also administer regular Section 8 voucher programs.
The data on the number of authorized vouchers and the number of vouchers in use in 2010 are from CBPP analysis of HUD's Voucher Management System data.
Categorizations of the restrictions that Congress or HUD imposed on new vouchers authorized and awarded from 1999 – 2010 are based on HUD notices published annually in the Federal Register and press releases on HUD's website.
Major Categories and Data Adjustments
This appendix explains how we categorized the data and what adjustments we made.
Households Working or Recently Attached to the Labor Market
For the purpose of this analysis, non-elderly, non-disabled households that received income in 2010 from wages or self-employment (577,841) or from Unemployment Insurance (UI) (78,264) are defined as households attached to the labor force. In addition, we considered as recently attached to the labor force the 34,163 non-elderly, non-disabled households that reported earnings as their primary or sole source of income in 2009 but did not have income from employment or UI in 2010. About 40 percent of these families received TANF benefits in 2010, but for purposes of this analysis they are counted in the "attached to the labor force" category. We were able to match 536,674 of the 549,905 non-elderly non-disabled households that relied primarily on earnings in 2009 with the 2010 dataset. In 2010, 56,492 of these households exited the voucher program, and about 10,000 became elderly/disabled households. Most of the remaining households in the matched sample were still working or received UI benefits.
Households Subject to a Work Requirement
We considered households likely to be subject to work requirements if they are not included in the "attached to the labor force" category discussed above and received TANF benefits in 2010 that were counted in determining their rent obligation (111,655), or if they were subject to the special "imputed welfare income" rent rules due to a work-related sanction (935).[24] If the TANF benefits were not counted in the determination of the household's required rent contribution, we assumed that the payment was a type of benefit that would not carry work requirements.[25] We did not include 10,289 non-elderly, non-disabled families reported as receiving TANF benefits (and not working or receiving UI benefits) in the number of households subject to work requirements because of this assumption.
We retained the TANF categorization for 7,039 non-elderly, non-disabled households without minor children, as it is possible that an adult would continue to receive TANF benefits for a child in foster care or otherwise temporarily absent from the home. If the source of income for these households is not TANF, however, they may not be subject to a work requirement.
Income Types and Amounts
The data extract contains 99 percent of the total reported income from all HCV participants. (The data provide a maximum of eight income sources per household.) There are 30,110 households missing income information that we excluded from our estimates regarding income but not from other portions of the analysis. Percentages of non-elderly, non-disabled households receiving certain types of income are based on the records of 1,053,531 households for which data on income sources were provided.
Housing agency staff members categorize the sources of income, and in the case of benefits from TANF and state General Assistance programs, the categorizations appear to be significantly in error. For example, about 94,700 families with children were reported as receiving GA benefits in states that either did not have a GA program in 2009 or 2010 or provided GA benefits only to households without minor children, based on a recent study by the Center on Budget and Policy Priorities of the eligibility rules for state General Assistance programs. [26]
General Assistance and TANF-Related Adjustments
We made two types of adjustments for households reported as receiving income from a General Assistance (GA) program. For households that included children, if there is no GA program in their state or the program does not serve families with minors, we considered them as receiving TANF benefits. We shifted 94,704 such families into the TANF category under this adjustment, of which 55,721 are non-elderly, non-disabled households. For other households living in a state that does not offer a GA program, we changed the source of income to "other countable income," except when the benefits were not counted in the determination of the household's required rent contribution. If the housing agency did not count the payment in determining the family's rent contribution ("total tenant payment"), we assumed that determination was correct and considered the income as "other excluded income."[27] As noted above, we made the same assumption for TANF income that was not included in the tenant rent calculation.
Household Types
Most of this analysis focuses on the 1,081,540 households we categorized as non-elderly, non-disabled. Some of the analysis concerns the 1,016,452 households we categorized as elderly or disabled.
Non-Elderly, Non-Disabled Households
We defined a household as non-elderly, non-disabled when the sole member, or the head and the co-head or spouse (if present), are younger than 62 and are not receiving Supplemental Security Income (SSI) benefits or identified as having a disability.
Elderly/Disabled Households
These are households where the sole member, or the head or co-head or spouse, meets the elderly or disabled definition. This is consistent with HUD's definition of "elderly family" and "disabled family" at 24 C.F.R. §5.403: the presence of a child or another adult with disabilities does not make a household a "disabled family." This category includes 45,855 households in which the head, co-head, or spouse is elderly or disabled but the other member of the couple is not.
Disability Status
Under the U.S. Housing Act and HUD's implementing regulation (24 C.F.R. §5.403), an individual meets the definition of a "person with disabilities" if he or she has been determined to meet the disability standard established by the Social Security Act for receipt of Social Security Disability Insurance or SSI benefits, or is determined by a public housing agency to have a physical, mental, or emotional impairment that is expected to be of long-continued and indefinite duration and substantially impedes the individual's ability to live independently, but more suitable housing conditions could improve the individual's ability to live independently. Individuals with developmental disabilities also are included in the HUD definition of disability.
To determine disability status, we used receipt of SSI benefits by individuals younger than 62 or whether an agency staff person had checked the "disabled" field on the HUD form. (We did not consider other income sources that may be tied to disability in some cases, such as Social Security, other pension income or General Assistance.) Our methodology appears to have shifted about 26,000 households into the "elderly/disabled" category compared to HUD's practice of relying solely on whether the "disabled" field on the form is checked for a particular household member. Given the frequent difficulty of assessing whether a person has disabilities and the limitations on seeking information related to disability status unless it is essential to program administration, the HUD practice likely undercounts the number of "disabled" households.
Elderly
We used HUD's definition of elderly as a person 62 years or older.
Two-Parent Households
The HUD file does not flag households based on whether they are headed by one or two adults. We used one or more of the sex, age, disability status, and income variables to identify the presence of a co-head or spouse in the household. If data were entered for a co-head or spouse in any of these fields, we assumed the presence of a co-head or spouse in the household. Using this method, we determined that there were 191,285 households with a co-head or spouse, 114,054 of which had minor children.
Presence of Minors in the Household
The data have a flag variable to identify households with minor children; however, this flag sometimes contradicts other children variables (age, disability, and income). To address this contradiction, we created our own flag, which considered all the child variables to identify households as having minors.
High- and Low-Cost Areas
We divided our sample of non-elderly, non-disabled households into four quartiles based on HUD's FY 2012 two-bedroom Fair Market Rent for the area in which they resided. We matched the county where each non-elderly, non-disabled household resides with its two-bedroom FMR. Households residing in New England were matched to the two-bedroom FMR for their town. We did a similar analysis for elderly and disabled households.
Duration of Stay
We subtracted the admission date from the date of action in the 2010 data file to obtain the number of months in the program. We excluded 6,702 households that appeared to have erroneous data for either or both of these variables. As with the rest of this analysis, we excluded from the estimates of duration of stay any households that have an "end of participation" record in the 2010 data. This provides a clearer picture of the lengths of stay of families continuing to participate in the program.
End Notes
[1] The data for 2000 are from Jeffrey M. Lubell, Mark Shroder, and Barry Steffen, "Work Participation and Length of Stay in HUD-Assisted Housing," Cityscape, 6:2, 2003, pp. 207 – 223. This analysis adjusted HUD administrative data for non-reporting, with apparent sensitivity to the fact that not all authorized vouchers are in use. HUD's 2010 file of administrative data on households receiving voucher assistance includes data on 2,097,992 households used for this analysis. See the Methodological Appendix. In 2010, there were 2,295,275 authorized vouchers, but about 200,000 were not in use, in part due to lack of funding.
[2] Under HUD policies and this analysis, a household is an "elderly family" if the head, spouse or co-head, or sole member is 62 or older. We categorized a non-elderly household as "disabled" if the head, spouse or co-head, or sole member receives Supplemental Security Income benefits or is flagged as a person with disabilities in the HUD administrative data. This practice is consistent with HUD's definition of "disabled family" but may differ from prior HUD analyses. These categories apply regardless of the presence or absence of minor children. See the Methodological Appendix for further explanation.
[3] Lubell, Shroder and Steffen, n. 1 above.
[4] Maria Teresa Souza et al., "2009 Worst Case Housing Needs of People with Disabilities," U.S. Department of Housing and Urban Development Office of Policy Development and Research, March 2011. Even controlling for income, households with disabilities are more likely to receive rental assistance. In 2009, 37 percent of renter households with disabilities and incomes at or below half of the area median income received housing assistance, compared to 23 percent of similar households without disabilities. Exhibit 2, p.5
[5] U.S. Department of Housing and Urban Development, " A Report on Worst Case Housing Needs in 1999: New Opportunity Amid Continuing Challenges, Executive Summary," January 2001 ; Barry L. Steffen et al., "Worst Case Housing Needs 2009: Report to Congress," U.S. Department of Housing and Urban Development Office of Policy Development and Research, February 2011, pp. 5-6. HUD's reports on worst-case needs are based on the biennial American Housing Survey. Data for 2011 are not yet available. Some 2.2 million more households had worst-case needs in 2009 than in 1999; families with children made up a slightly larger share of households with such severe housing needs in 2009.
[6] From 1999 – 2010, Congress authorized, and HUD awarded, 609,000 additional vouchers, nearly equal to the increase in the number of households receiving voucher assistance. (This figure excludes the 12,117 vouchers for homeless veterans and families involved in the child welfare system that Congress funded in 2010 but that HUD did not award until mid-2011.) Of this total, 108,655 were awarded in 1999; it is likely that some but not all of these vouchers were in use and reflected in the 2000 figures cited in this analysis.
[7] These were the "fair share" incremental vouchers funded by Congress in 2000, 2001 and 2002.
[8] As of January 2000, 70 percent of the households living in units with project-based Section 8 assistance did not have children: 50 percent were elderly, 13 percent were disabled, and 8 percent non-elderly, non-disabled. HUD Office of Policy Development & Research, "New Facts about Households Assisted by HUD's Housing Programs." Recent Research Results, October 2000, http://www.huduser.org/periodicals/rrr/rrr_10_2000/1000_6.html.
[9] The estimate of 70,000 new vouchers over the decade restricted to people with disabilities includes: 43,310 vouchers for non-elderly disabled households that Congress funded in various years from 1999 to 2009; about 20,000 vouchers for homeless veterans under the HUD-VASH program funded in 2008 and 2009 (the VASH vouchers funded in 2010 were not awarded until mid-2011); and 8,776 vouchers funded under the section 811 Mainstream program in 1999 – 2003.
[10] This could occur legitimately for two reasons. First, HUD rules allow the state and local housing agencies that administer the HCV program to delay required reporting of income changes until families' regular annual income recertification. Some agencies elect this option as a work incentive or to reduce administrative costs. Second, the administrative data used for this analysis include only one record per family per year. If the employed family member lost her job during 2010 and requested a rent reduction, only the most recent record showing no earned income would be available.
[11] Hannah Shaw and Chad Stone, "Introduction to Unemployment Insurance," Center on Budget and Policy Priorities, April 16, 2010. The standard base period used to determine UI benefits is the first four of the last five completed calendar quarters, though many states have adopted an "alternative base period" which considers the previous four calendar quarters. In many states, workers qualify only if they have earnings in at least two of the quarters in their base period.
[12] Some households that were admitted to the voucher program in 2010 may have worked in 2009 but joined the program after losing their jobs. The HUD data do not include information on pre-admission work history.
[13] The 40 percent figure is the fraction of the monthly average number of recipients of UI benefits in 2010 divided by the monthly average number of unemployed individuals in 2010. The numerator counts UI benefits from both the regular state-run and federal emergency programs. U.S. Department of Labor Unemployment Insurance Chartbook, http://www.doleta.gov/unemploy/chartbook.cfm.
[14] Federal law requires states to meet strict work participation rates for "work-eligible individuals" in their TANF programs. "Work-eligible individuals" do not include child-only cases (where TANF benefits are not provided on behalf of the adult(s) in the household), which are generally exempt from work requirements. A state can set its own exemption policies, determining who it considers unable to work, but these families generally would not be excluded from the federal work participation rate that states must meet. Only 707 of the 113,000 TANF households described in this section appear to be child-only cases, based on HUD data.
[15] Nearly 60 percent of these households live in the 12 states that allow "employable" individuals without other income to receive GA benefits but often impose work requirements. Liz Schott and Clare Cho, "General Assistance Programs: Safety Net Weakening Despite Increased Need," Center on Budget and Policy Priorities, October 26, 2011. See Table 1, p. 4.
[16] In 2010, 57 percent of all non-elderly, non-disabled voucher households, and 46 percent of elderly or disabled households, had received voucher assistance for five years or less.
[17] HUD rules require the exclusion of some types of income, including foster care payments, in determining tenant rent payments and the amount of subsidy. The cited figure includes reported income from all sources, regardless of whether the income is counted in determining rental payments.
[18] See, e.g., Pamela Loprest and Austin Nichols, "Dynamics of Being Disconnected from Work and TANF," Urban Institute, May 2011. Using data from the Survey of Income and Program Participation (SIPP), Loprest and Nichols estimated that one-fifth of the 1.2 million "disconnected" women in 2008 received housing assistance. Some 193,000 of the non-elderly, non-disabled voucher households that were not attached to the labor market or receiving TANF in 2010 have minor children.
[19] For example, of the 11,000 of these households that receive General Assistance (GA) benefits, about 40 percent live in states that provide aid only to individuals deemed unemployable, even if they have not been found to meet the stringent standard necessary to qualify for federal disability benefits or to be treated as disabled under HUD rules. (Some 18 of the 30 states that operated GA programs in 2010 restricted benefits to people deemed unemployable. Schott and Cho, supra.)
[20] Using HUD administrative data from 1995 – 2002, Ed Olsen and colleagues estimated that attrition from the voucher program increased by 3 percent for every $100 reduction in the local voucher payment standard. Edgar O. Olsen, Scott E. Davis and Paul E. Carrillo, "Explaining Attrition in the Housing Voucher Program," Cityscape 8:2 (2005), pages 95-113. This finding is consistent with ours, as payment standards are based on the HUD Fair Market Rents, which are the basis of our analysis. It should be noted that housing agencies have some flexibility in setting payment standards, so a lower payment standard in one area as compared to another does not necessarily reflect lower market rents in the area with the lower FMR.
[21] While the lengths of stay of elderly or disabled households also were longer in the highest cost areas, the differences were more muted than for non-elderly, non-disabled households, who are more likely to be able to work their way off of housing assistance in lower cost areas. Some 54 percent of the elderly or disabled households in 2010 had received voucher assistance for more than five years. Of the elderly or disabled households living in the areas in the lowest cost quartile, 45 percent had such longer stays; of those living in the areas in the highest cost quartile, 64 percent had received HCV assistance for more than five years.
[22] This figure includes all countable household income. Considering earnings alone, the median earnings of these 99,000 households was $18,405 in 2010. The median earnings of all non-elderly, non-disabled households who worked in 2010, regardless of duration of voucher receipt or relative housing costs, was $14,933.
[23] For example, the Sectoral Employment Initiative is one of the most successful employment and training initiatives that has been rigorously evaluated in recent years. Three distinctly different programs, operated by organizations in Massachusetts, New York and Wisconsin, showed impressive results. Participants in the sector-focused training earned 29 percent more than those not selected to participate in the second year and 18 percent more during the entire two-year evaluation period. Sheila Maguire et al., "Tuning In to Local Labor Markets: Findings from the Sectoral Employment Impact Study," Public/Private Ventures, 2010, http://ppv.org/ppv/publications/assets/325_publication.pdf. Non-experimental results from HUD's Family Self-Sufficiency Program also have shown significant earnings increases for the families that completed the program. Lalith de Silva et al., "Evaluation of the Family Self-Sufficiency Program: Prospective Study," February 2011, http://www.huduser.org/portal/publications/FamilySelfSufficiency.pdf . HUD plans to initiate a random assignment evaluation of the FSS program in the next year.
[24] The imputed welfare income rule is 24 C.F.R. §5.615. The HUD data show a total of 4,218 families subject to the special "imputed welfare income" rent rules due to a work-related sanction. Most of these families still received some amount of TANF benefits or were working.
[25] HUD rules count as "income" for rent-determination purposes only TANF benefits that qualify as "assistance" under federal rules. (24 C.F.R. §5.609(b)(6).) Typically, benefits count as "assistance" only if they are received for more than four months.
[26] Liz Schott and Clare Cho, "General Assistance Programs: Safety Net Weakening Despite Increased Need," Center on Budget and Policy Priorities, October 26, 2011.
[27] HUD rules require the exclusion of "temporary, nonrecurring or sporadic income." 24 C.F.R. §5.609(c)(9).
More from the Authors