Census Data Show Historic Coverage Gains in 2014
Health Reform Coverage Expansions a Major Factor
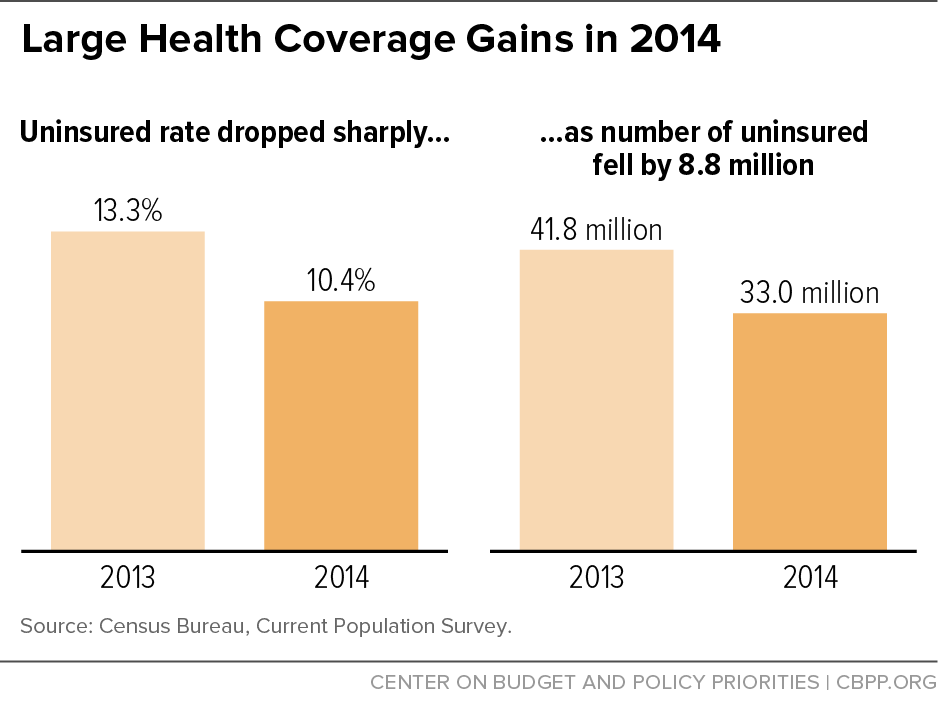
The uninsured rate fell sharply from 13.3 percent in 2013 to 10.4 percent in 2014 and the number of uninsured Americans dropped from 41.8 million to 33.0 million, Census Bureau data based on the Current Population Survey (CPS) show.[1] (See Figure 1.) These are by far the largest single-year reductions on record in data back to 1987.
2014 health coverage gains are by far the largest single-year reductions on record in data back to 1987.Consistent with the historic coverage gains measured in the Centers for Disease Control and Prevention’s (CDC) National Health Interview Survey (NHIS) and several private surveys, the new figures are the first Census estimates to capture the impact of the Affordable Care Act’s (ACA) major coverage expansions, which took full effect January 1, 2014. The ACA gave states the option to expand Medicaid to more low-income adults and established subsidies for low- and moderate-income families to purchase private coverage through the health insurance marketplaces.
New Census data include estimates from both the CPS and American Community Survey (ACS), which are considered the gold standard for national- and state-level health coverage estimates, respectively. Because the Census Bureau revised the CPS health coverage questions last year, only the 2013 and 2014 CPS coverage estimates can be compared directly. But the ACS questions have not changed, so the ACS can be used for comparisons back to 2009. This analysis bases single-year historical comparisons on CPS data and longer-term comparisons on a combination of adjusted CPS data, ACS data, and data from the NHIS.
The new CPS figures show:
- The share of Americans without health coverage fell from 13.3 percent in 2013 to 10.4 percent in 2014. The number of uninsured fell from 41.8 million to 33.0 million.
- Private coverage and public coverage rates grew together in 2014 for the first time since 2000, evidence of the comprehensive impact of the ACA’s major coverage expansions. The share of Americans with private coverage rose from 64.1 percent in 2013 to 66.0 percent in 2014, reflecting the ACA’s subsidized marketplace coverage, continued progress in covering young adults, and the improving economic outlook. The share with public coverage rose from 34.6 percent in 2013 to 36.5 percent in 2014, reflecting the ACA’s Medicaid expansion to low-income adults, continued progress in covering low-income children through the Children’s Health Insurance Program (CHIP), and the aging of more Americans into Medicare.
- Among virtually all of the demographic categories that the CPS data cover, including gender, family income, working status, and race/ethnicity, the share who are uninsured fell by at least one-eighth in 2014.[2] Coverage gains were greatest among the groups historically least likely to have coverage. The uninsured rate for adults under age 26, for example, plummeted from 22.1 percent in 2013 to 17.1 percent in 2014. People in families under 200 percent of the poverty line, Latinos, African Americans, and people with less than a high school education all experienced very large gains (see Appendix Table 1).
- The share of the population enrolled in Medicare rose again in 2014 as another cohort of baby boomers aged into eligibility.
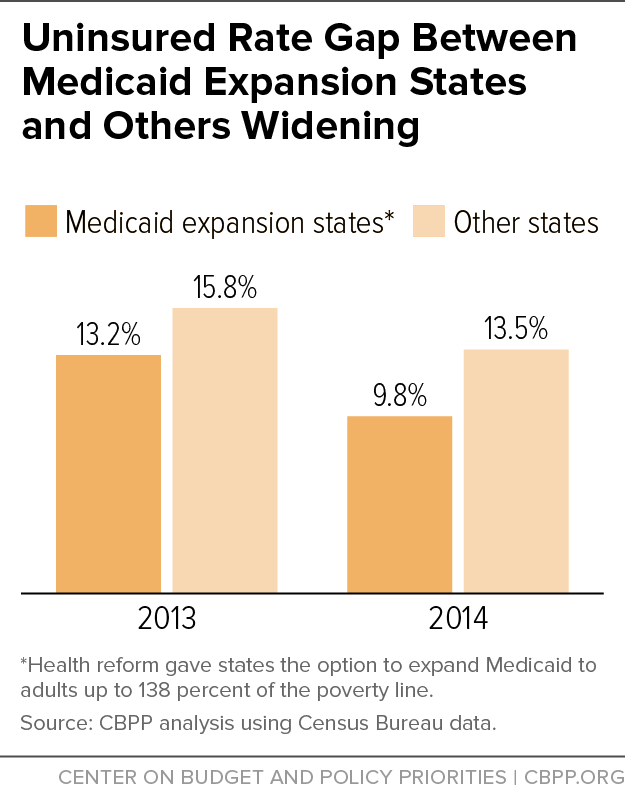
The ACS data show that the uninsured rate in 2014 was 9.8 percent in states that had expanded Medicaid and 13.5 percent in non-expansion states. The coverage gap between expansion and non-expansion states widened from 2.6 percentage points in 2013 to 3.7 percentage points in 2014. If the uninsured rate had fallen in non-expansion states at the same rate as in expansion states, an additional 2.6 million uninsured Americans would have gained coverage last year.
Changes to CPS Health Coverage Questions
Although the CPS is the most widely used source of health coverage information, changes in its health coverage questions in 2013 — the result of a multi-year Census initiative to improve the reliability and accuracy of the survey’s health coverage estimates — mean the 2013 and 2014 results can be compared to one another but not to prior years. The CPS estimates remain of substantial value, however, because of the high quality of the CPS’ survey design and the CPS’ wealth of additional information on income and demographics.
Thus, for comparisons with earlier years, the ACS is the preferred data source. This paper uses both ACS and CPS data as appropriate — the ACS data and a modified version of several different CPS-based historical series for comparisons to years before 2013, and the CPS data for comparing 2013 and 2014 coverage rates as well as 2014 coverage rates across population groups.
Analysts have long maintained that the CPS estimate of the number of uninsured is too high for what the survey purportedly measures — the number uninsured for the entire calendar year. The new survey questions, which ask separately about coverage at the time of the interview and coverage transitions over the course of the previous year, are designed to generate more reliable estimates. These changes have strengthened the CPS’ ability to accurately measure the effects of recent changes in health care coverage sources, such as the availability of subsidies to purchase marketplace coverage under the Affordable Care Act. The Census Bureau believes that the 2013 CPS data on health coverage provide an improved baseline to accurately measure the effects of the 2014 ACA coverage expansions.
In addition, an array of surveys and data show that the number of Americans without insurance has continued falling in 2015. The number of uninsured fell from nearly 45 million in 2013 to 36.0 million in 2014 and to 29 million in the first quarter of 2015, according to recent CDC estimates.[3] At 9.2 percent, the CDC’s estimated uninsured rate for the first quarter of 2015 was the lowest since the CDC began collecting these data in 1997 and more than 40 percent below the peak in 2010.
Large Decline in Uninsured in 2014 Builds on Earlier Progress
The 2014 health coverage gains build upon much smaller but steady gains since 2010. The ACS data show that the uninsured rate declined for the fourth consecutive year in 2014, from 15.5 percent in 2010 to 11.7 percent in 2014. (The ACS estimates of the overall uninsured rate are modestly higher than the CPS estimates on a consistent basis because they reflect uninsurance at the time of the interview, while CPS estimates reflect uninsurance for an entire year.)
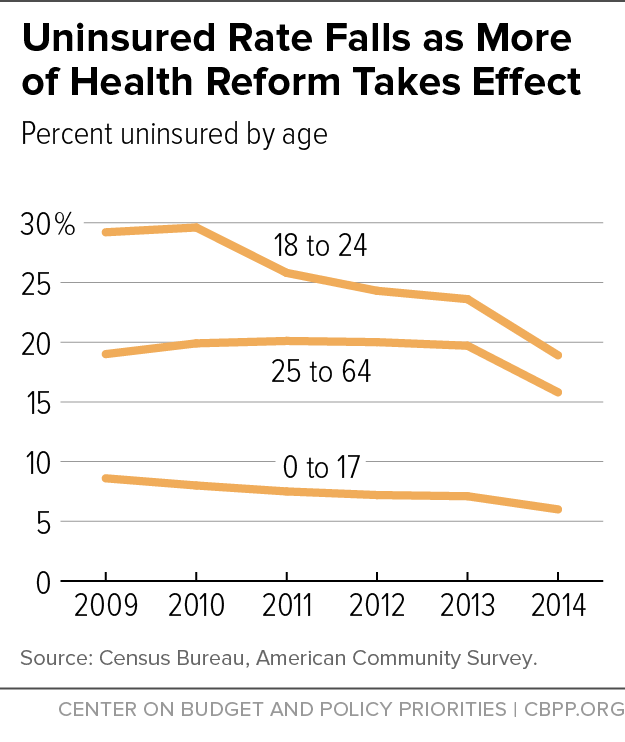
The improvement prior to 2014 likely reflects ACA provisions permitting young adults to enroll in (or remain on) their parents’ health insurance plan up to age 26 and barring states from scaling back children’s Medicaid or CHIP eligibility or making it harder for eligible children to enroll, as well as continued progress in a number of states in reaching more children through CHIP. Among adults under age 26, the uninsured rate fell from 29.6 percent in 2010 to 26.5 percent in 2012 and 25.5 percent in 2013, the ACS data show. Among children, it fell from 8.6 percent in 2009 to 8.0 percent in 2010, 7.2 percent in 2012, and 7.1 percent in 2013. Progress in covering these groups continued in 2014, as the uninsured rates for young adults and children fell to 20.4 and 6.0 percent, respectively.
In 2014, the nation also made major progress in extending coverage to other non-elderly adults. Some 15.5 percent of adults aged 25-64 were uninsured in 2014, down from 19.4 percent in 2013, according to the ACS. Coverage rates for this group had stagnated since 2010. Their coverage gains in 2014 reflect implementation of the ACA’s major coverage expansions, including both the Medicaid expansion to low-income adults and subsidized marketplace coverage for low- and moderate-income families. (See Figure 2.)
Although the adoption of new CPS questions for 2013 means that the uninsured rates for 2013 and 2014 cannot be directly compared with previous years, the change in the uninsured rate in 2014 can be compared with other single-year changes within earlier CPS historical series (each of which contains consistent, comparable data) dating back to 1987, when the CPS health insurance data were first collected.[4] Under this analysis, the decline in the uninsured rate of 2.9 percentage points (or more than one-fifth) between 2013 and 2014 is by far the largest single-year reduction on record; in fact, it is several times greater than any previous single-year decline. (See Figure 3.) Similarly, the number of Americans without health coverage experienced the largest year-to-year decline over this time period.

Other Surveys Show Uninsured Rate Lowest on Record
As noted, changes in the CPS over time make it difficult to use that survey to determine if the uninsured rate in 2014 is the lowest since the CPS health insurance data were first collected. However, other government and private survey data sources that did not change their survey methods decisively confirm that the 2014 uninsured rate was lower than in any earlier year for which these surveys collected data. For example:
- Under the CDC’s National Health Interview Survey (NHIS), which has used the same questions since 1997, 2014’s uninsured rate of 11.5 percent is by far the lowest on record and is nearly one-fifth below the previous low (14.2 percent in 1999).[5]
- Similarly, the ACS and Gallup’s Well-Being Index[6] show the 2014 uninsured rate to be lower than in any year since those surveys first were conducted in 2008.
Private Coverage Grew Due to Launch of Marketplaces
The share of Americans with private coverage grew from 64.1 percent in 2013 to 66.0 percent in 2014, according to CPS data. This is the first increase since 2000. The percentage of Americans with private coverage fell by more than one-seventh between 2000 and 2013.[7]
The growth in private coverage was driven almost entirely by an increase in direct-purchase coverage, as the share of Americans with private coverage who did not receive it through their employer rose from 11.6 percent in 2013 to 14.6 percent in 2014, an increase of 10.4 million people. The great majority of this increase is quite likely due to enrollment in health reform’s insurance marketplaces. The great majority of those enrolled in marketplace coverage received premium subsidies and cost-sharing assistance to help make marketplace coverage affordable for low- and moderate-income people.[8]
Some 55.4 percent of Americans had employer-sponsored coverage in 2014, statistically unchanged from 2013. The employer-sponsored coverage rate for both full-time and part-time workers remained stable. This counters claims that health reform would lead to substantial reductions in employer-based coverage.
Public Coverage Also Grew
The share of Americans covered by programs like Medicare, Medicaid, and CHIP rose from 34.6 percent in 2013 to 36.5 percent in 2014, according to CPS data. Enrollment in public health programs has grown each year since 2009, according to ACS data first collected in 2008,[9] but 2014’s growth was more than one-fourth greater than in any previous year.
Medicaid and CHIP enrollment was particularly strong in 2014, rising by nearly 6.7 million or 12.3 percent. Much of this growth was among adults newly eligible for Medicaid in states that adopted the ACA’s Medicaid expansion. Some 40.0 percent of adults below the poverty line were enrolled in Medicaid in 2014, up from 2013’s 36.5 percent. Medicaid and CHIP also continue to play a significant coverage role for children: 77.0 percent of poor children were enrolled in Medicaid in 2014.
As in 2012 and 2013, Medicare enrollment rose significantly in 2014, as the share of the population aged 65 or older reached a historic high. Some 1.5 million more people were enrolled in Medicare in 2014 than in 2013.
Coverage Gap Widens Between Medicaid Expansion States and Others
Some 13.5 percent of people in the 26 states that did not implement the ACA’s Medicaid expansion in 2014 were uninsured, compared to 9.8 percent of people in the 25 states (including the District of Columbia) that expanded Medicaid.[10] The uninsured rate declined in both groups of states, but the expansion states’ greater coverage gains in 2014 further widened the gap. The gap was 3.7 percentage points in 2014, compared to 2.6 percentage points in 2013. The CDC, Urban Institute, and Gallup also have all found evidence of this growing divide. (See Figure 4.)
Certain Groups Remain Disproportionately Uninsured
Despite broad coverage gains throughout the population in 2014, certain groups remain uninsured at disproportionately high rates, the CPS data show.
- 26- to 34-year-olds. Some 18.2 percent of 26- to 34-year-olds were uninsured in 2014, a decline of 5.5 percentage points from 2013 but still the highest among all age cohorts. Adults under age 26 were the age cohort with the highest uninsured rate until 2013, but they have benefited from the ACA provision allowing children to remain on their parents’ private insurance plans until age 26; their uninsured rate fell to 17.1 percent in 2014.
- Hispanics. Some 19.9 percent of Hispanics were uninsured in 2014, compared to 11.8 percent of African Americans, 9.3 percent of Asian Americans, and 7.6 percent of non-Hispanic whites. This disparity narrowed somewhat in 2014, however, as the uninsured rate among Hispanics fell markedly from 2013’s 24.4 percent.
- Residents of the South and West. Some 13.0 percent of those living in the South and 10.4 percent of those living in the West were uninsured in 2014, well above the comparable figures for the Northeast (7.8 percent) and Midwest (8.2 percent).
- Unemployed or underemployed. Some 17.3 percent of those who were unemployed for at least one week in 2014, and 17.7 percent of those who worked less than full time, were uninsured, well above the 11.2 percent uninsured rate for people who had a full-time job throughout the year. This disparity narrowed somewhat in 2014 as the unemployed or underemployed gained access to affordable coverage through the ACA’s insurance marketplaces.
- People in low-income households. The uninsured rate was more than twice as high among people in households with incomes below $50,000 (15.2 percent) as among people in households with incomes of $50,000 or more (7.4 percent). Nevertheless, this disparity narrowed in 2014 due to the Medicaid expansion and marketplace subsidies (both of which are targeted to those with lower incomes), which lowered the uninsured rate among households below $50,000 from 19.9 percent in 2013 to 15.2 percent in 2014.
Other Surveys Show Further Coverage Gains in 2015
The CDC issued preliminary data from its National Health Interview Survey earlier this year showing that the ranks of the uninsured fell in the first quarter of 2015 by another 7.0 million people (or 2.3 percentage points).[11] The CDC estimates that the uninsured rate fell from 14.4 percent in 2013 to 11.5 percent in 2014 and 9.2 percent in the first quarter of 2015 — the lowest since the CDC began collecting these data in 1997 and more than 40 percent below the peak of 16.0 percent in 2010.
These CDC figures are consistent with three independent private surveys showing major gains in coverage for adults in 2015, each of which found the uninsured rate falling between 35 and 40 percent since 2013. (Two of the studies examined non-elderly adults; the third examined all adults.) All three surveys also indicate that the Medicaid expansion and subsidized marketplace coverage are driving these large reductions in the ranks of the uninsured.
- Data from the Urban Institute’s Health Reform Monitoring Survey show the uninsured rate among adults aged 18-64 fell from 17.6 percent in the third quarter of 2013 to 12.8 percent in the fourth quarter of 2014 and 10.1 percent by the second quarter of 2015. That translates into a decline in the number of uninsured non-elderly adults of 15 million since 2013, based on Census population estimates.[12]
- Results from the Gallup-Healthways Well-Being Index show that the uninsured rate among adults (including those aged 65 and above) fell from 18.0 percent in the third quarter of 2013 to 12.9 percent in the fourth quarter of 2014 and 11.7 percent in the first half of 2015, the lowest level since Gallup and Healthways began tracking this information in 2008.[13]
- May 2015 results from the Commonwealth Fund’s Affordable Care Act Tracking Survey show that the uninsured rate among adults aged 19-64 fell from 20 percent in July-September 2013 to 15 percent in April-June 2014 and 13 percent in March-May 2015. While the decline from 2014 to 2015 was not statistically significant due to small sample size, the magnitude of the continued progression in 2015 is similar to that found in the other surveys. Among those gaining coverage, 80 percent enrolled in marketplace coverage, and 64 percent of those newly enrolled in Medicaid had gone without insurance for a year or longer. The survey also found that new enrollees are using their coverage: nearly 70 percent of adults in a marketplace plan or Medicaid visited a doctor or had a prescription filled, and 62 percent of those using their coverage indicated they previously would not have been able to obtain needed care.[14]
| APPENDIX TABLE 1 | ||||
|---|---|---|---|---|
| Uninsured Rate Drops Among All Groups in 2014 | ||||
| 2013 (%) | 2014 (%) | % Point Change | % Change | |
| TOTAL | 13.3 | 10.4 | -2.9 | -22.0 |
| Race/ethnicity | ||||
| White, not Hispanic | 9.7 | 7.6 | -2.1 | -22.1 |
| Black | 15.9 | 11.8 | -4.1 | -25.9 |
| Hispanic | 24.4 | 19.9 | -4.5 | -18.6 |
| Asian | 13.8 | 9.3 | -4.4 | -32.3 |
| Age | ||||
| Under 19 | 7.6 | 6.2 | -1.3 | -16.9 |
| 19 to 25 | 22.1 | 17.1 | -5.0 | -22.7 |
| 26 to 64 | 17.8 | 13.8 | -4.0 | -22.6 |
| 65 and older | 1.5 | 1.4 | -0.1 | -7.1 |
| Work experience | ||||
| Full-time, year-round | 13.9 | 11.2 | -2.7 | -19.2 |
| Less than full-time, year-round | 24.0 | 17.7 | -6.3 | -26.3 |
| Did not work at least one week | 22.2 | 17.3 | -4.9 | -22.1 |
| Poverty status | ||||
| Below 100% of poverty line (FPL) | 23.5 | 19.3 | -4.2 | -17.8 |
| 100%-199% FPL | 20.4 | 15.1 | -5.3 | -26.0 |
| 200%-299% FPL | 15.8 | 11.7 | -4.2 | -26.4 |
| 300%+FPL | 6.8 | 5.7 | -1.1 | -15.9 |
| Household income | ||||
| Less than $50,000 | 19.9 | 15.2 | -4.7 | -23.5 |
| $50,000+ | 9.0 | 7.4 | -1.5 | -17.3 |
| Region | ||||
| Northeast | 9.3 | 7.8 | -1.5 | -16.1 |
| Midwest | 10.4 | 8.2 | -2.2 | -21.0 |
| South | 16.3 | 13.0 | -3.3 | -20.3 |
| West | 14.4 | 10.4 | -4.0 | -28.0 |
| Education | ||||
| No high school diploma | 38.2 | 30.6 | -7.6 | -19.9 |
| High school, no Bachelor’s degree | 19.6 | 15.1 | -4.5 | -23.0 |
| Bachelor’s degree, or higher | 9.2 | 7.0 | -2.2 | -23.9 |
End Notes
[1] Census Bureau, “Health Insurance Coverage in the United States: 2014,” September 16, 2015.
[2] The lone exception is the elderly. More than 98 percent of the elderly have health coverage, nearly all through Medicare. This figure remains stable over time.
[3] Robin Cohen and Michael Martinez, “Health Insurance Coverage: Early Release of Estimates from the National Health Interview Survey, January-March 2015,” National Center for Health Statistics (Centers for Disease Control and Prevention), August 2015, http://www.cdc.gov/nchs/data/nhis/earlyrelease/insur201508.pdf.
[4] The Census Bureau has four series of health insurance coverage estimates from the CPS, covering: (1) 2013-2014; (2) 1999-2012; (3) 1999-2009; and (4) 1987-2005. Each successive series reflects changes from the previous series in the way the health insurance coverage questions are asked or the survey responses are coded to improve the accuracy of the survey results. Comparisons of the single-year decline in 2014 can be made to the single-year changes within each series of unadjusted data except for 1999 and 2013. For those two years, we adjust the single-year changes based on Census Bureau estimates of how the survey changes instituted in those years affected uninsured rates.
[5] Cohen and Martinez, op. cit.
[6] Jenna Levy, “In U.S., Uninsured Rate Sinks to 12.9%,” Gallup, January 2015, http://www.gallup.com/poll/180425/uninsured-rate-sinks.aspx.
[7] This calculation is based on the adjusted CPS (see footnote 4).
[8] “Health Insurance Marketplace: Summary Enrollment Report for the Initial Annual Open Enrollment Period,” Department of Health and Human Services, Office of the Assistant Secretary for Planning and Evaluation, May 2014, http://aspe.hhs.gov/sites/default/files/pdf/76876/ib_2014Apr_enrollment.pdf. Some 85 percent of those enrolled in a marketplace plan after the first open enrollment period in 2014 qualified for financial assistance. Subsequent analysis shows the figure to have been slightly higher among those enrolling in the 2015 open enrollment period.
[9] The American Community Survey first included a health insurance question in 2008. However, 2008 results are not comparable to those from 2009 and years beyond due to issues of non-response in 2008.
[10] Our count of Medicaid expansion states excludes Indiana, Michigan, New Hampshire, and Pennsylvania. These states have expanded Medicaid to adults in poverty but hadn’t implemented their expansions by January 1, 2014.
[11] Robin Cohen and Michael Martinez, “Health Insurance Coverage: Early Release of Estimates from the National Health Interview Survey, January-March 2014,” Centers for Disease Control and Prevention, September 2014, http://www.cdc.gov/nchs/data/nhis/earlyrelease/insur201409.pdf.
[12] Sharon Long et al., “Taking Stock: Gains in Health Insurance Coverage Under the ACA as of March 2015,” Urban Institute, April 2015, http://hrms.urban.org/briefs/Gains-in-Health-Insurance-Coverage-under-the-ACA-as-of-March-2015.html.
[13] Dan Witters, “In U.S., Uninsured Rate Continues to Drop in Most States,” Gallup, August 10, 2015, http://www.gallup.com/poll/184514/uninsured-rates-continue-drop-states.aspx.
[14] Sara Collins et al., “Americans’ Experiences with Marketplace and Medicaid Coverage,” Commonwealth Fund, May 2015, http://www.commonwealthfund.org/publications/issue-briefs/2015/jun/experiences-marketplace-and-medicaid.
More from the Authors

Areas of Expertise