Community Eligibility Adoption Rises for the 2015–2016 School Year, Increasing Access to School Meals

Introduction
In the 2015–2016 school year, its second year of nationwide availability, more than 18,000 high-poverty schools, in nearly 3,000 school districts across the country, have adopted community eligibility, an option that allows qualifying schools to offer breakfast and lunch at no charge to all students without collecting and processing individual school meal applications.[1] This is an increase of about 4,000 schools compared to the prior year, further demonstrating the appeal of the new provision.
These schools, which serve more than 8.5 million children, represent half of all eligible schools, a strikingly high take-up rate for such a new federal program.[2] Those figures are up from 14,214 schools — about 45 percent of those eligible — serving 6.7 million students in the 2014–2015 school year. Consistent with last year, take-up was higher among the highest-poverty schools, where nearly all children are already eligible for free or reduced-priced meals.
Community eligibility is a powerful tool that allows school districts to target nutrition benefits to children in high-poverty schools.Congress created the Community Eligibility Provision in the 2010 reauthorization of the child nutrition programs. After a three-year phase-in period, the provision became available nationwide in the 2014–2015 school year. Schools across the country have quickly adopted it due to its many benefits.[3] Community eligibility is a powerful tool that allows school districts to target nutrition benefits to children in high-poverty schools. It not only eliminates redundant paperwork at such schools, but also makes possible substantial gains in meeting vulnerable children’s nutritional needs by providing them with a free and healthy breakfast and lunch at school each day. Reliable access to healthy meals, in turn, better prepares students to learn.
Community eligibility’s popularity in its first two years of nationwide implementation speaks to schools’ desire to improve access to healthy meals while reducing red tape, as well as to the option’s sound design. Including the three initial years during which 11 states piloted community eligibility, take-up rates have risen each year, demonstrating the provision’s popularity as more eligible districts have become aware of its many benefits and ease of implementation. State agencies also have become more familiar with community eligibility, which has contributed to more widespread adoption. Through the piloting and first year of nationwide availability, the U.S. Department of Agriculture (USDA), the U.S. Department of Education, and state child nutrition agencies gained experience with community eligibility and were then able to offer more targeted technical assistance, trainings, and outreach to districts to facilitate implementation. State and local anti-hunger advocates also played an important role in educating eligible schools about the new option.
Nevertheless, many eligible schools still have not yet implemented community eligibility, and take-up varies substantially across states. This report is designed to help state and local education stakeholders, school nutrition administrators, policymakers, and state and local anti-hunger advocates identify eligible schools and districts that have not adopted the option but could benefit from it. (Appendix 2 describes resources to support its implementation.) The report assesses community eligibility take-up in each state for the 2015–2016 school year using three measures, and compares the findings for each measure to take-up last year:
- the share of eligible school districts adopting it;
- the share of eligible schools adopting it; and
- the share of the highest-poverty schools adopting it.
The report summarizes data gathered by USDA, in collaboration with the Center on Budget and Policy Priorities and the Food Research & Action Center (FRAC).[4] The data are summarized in Appendix 1 and are available in a searchable database.[5] Appendix 3 explains the data collection process.
How Does Community Eligibility Work?
Community eligibility simplifies the school meal enrollment process for high-poverty schools by enabling them to do away with household meal applications — thereby eliminating a major administrative burden — and serve breakfast and lunch at no charge to all students.
Typically, all schools that participate in the school meal programs use a two-part process to determine which students are eligible for free or reduced-price meals:
- First, certain students are automatically enrolled for free meals without an application. Students in households participating in the Supplemental Nutrition Assistance Program (SNAP, formerly food stamps), the Temporary Assistance for Needy Families (TANF) cash assistance program, or the Food Distribution Program on Indian Reservations (FDPIR) can be identified through data matching, a process known as “direct certification.” Other students can be automatically enrolled for free meals because they are homeless, migrant, runaway, in Head Start, or in foster care.
- Next, schools collect school meal applications from the remaining students in order to determine which students are eligible for free or reduced-price meals based on their household income.
Community eligibility schools rely solely on students identified without an application and therefore no longer have to collect school meal applications, determine and verify eligibility, or track eligibility whenever a meal is served.[6] As a result, they can focus on education and providing two nutritious and appealing meals daily.
Under community eligibility, these especially vulnerable students who are identified without an application are known as identified students. A school’s eligibility for community eligibility is based on its Identified Student Percentage (ISP), which is determined by dividing its total number of identified students by its total enrollment. Schools with an ISP of 40 percent or greater can adopt community eligibility. It is important to note that identified students are only a subset of those who would qualify for free or reduced-price meals if the school collected school meal applications; schools that are eligible for community eligibility typically have a much higher percentage of low-income students than their ISP.
School districts determine whether to adopt community eligibility and for which eligible schools. Districts may choose to implement the option in an individual school, group of schools, or districtwide. Nearly 4,000 districts are eligible for the option districtwide, and in about another 3,300, a subset of schools are eligible. Community eligibility was designed to serve high-poverty schools, even those situated in districts that are not uniformly low income; many districts have implemented the provision for some, but not all, eligible schools.
Community eligibility also simplifies how schools are reimbursed for meals served. Under the school meal programs’ traditional reimbursement structure, at each meal school districts keep track of which students eat and whether they qualify for free, reduced-price, or paid meals. School districts then receive a per-meal federal reimbursement, which is highest for free meals. For schools implementing community eligibility, the reimbursements are based on the school’s ISP. A school’s ISP is multiplied by 1.6 to approximate the share of students that would receive free or reduced-price meals if the school collected meal applications; the resulting percentage is the share of meals that are reimbursed at the highest (free) federal reimbursement rate, while the remaining meals are reimbursed at the lowest (paid) rate. (The 1.6 multiplier was derived from analyses indicating that for every ten students who were approved for free school meals without an application, six more were approved for free or reduced-price meals based on an application.) Of course, federal reimbursements cannot exceed 100 percent of the meals served.
The fact that schools with higher ISPs receive the highest reimbursement rate for more meals makes it financially easier for them to implement community eligibility. In fact, a school with an ISP of 62.5 percent or higher receives the highest federal reimbursement for all of its meals. In schools with a lower ISP, administrative savings from eliminating applications and economies of scale for food procurement and labor often cover the cost of meals served to students who would otherwise pay. But schools with ISPs just above 40 percent might need to provide additional non-federal resources if their federal reimbursements do not fully cover the cost of serving meals at no charge to all students. Because the financial viability of community eligibility depends on local costs and other local factors, the decision about whether to adopt the option rests with school districts.
Another local consideration for schools implementing community eligibility comes from eliminating school meal applications. While removing this process eases the administrative burden for the school nutrition department, it is important to note that the data from these applications have long been used for many purposes outside of school nutrition. For example, the data from school meal applications are used by some states to allocate state education funding or by school districts to determine eligibility for certain education services or fee waivers. There are many alternative data options for community eligibility schools; states can establish policies that better support school districts that choose to implement community eligibility.[7]
Growing Up in Concentrated Poverty Has Lasting Impact on Youth Development
Growing up in a high-poverty neighborhood can have lasting effects on a child’s growth and development. High-poverty neighborhoods, which can be violent, stressful, and environmentally hazardous, can impair children’s cognitive development, school performance, mental health, and long-term physical health — even if the family itself is not low-income.a Schools that are eligible to participate in community eligibility meet a stringent threshold and are located in some of the nation’s poorest, most vulnerable communities, including urban districts like Baltimore, Chicago, and Detroit, as well as rural areas of Kentucky and West Virginia, where nearly all students qualify for free or reduced-price school meals. Data from these schools provide a sobering look at areas of concentrated poverty and how widespread these pockets are in every state.
Social interventions have made a difference for children in high-poverty communities. In particular, access to healthy meals at home and at school through the federal nutrition programs, including the Supplemental Nutrition Assistance Program (SNAP) and school meal programs, can help children overcome some of the negative consequences of poverty and food insecurity. These programs work hand in hand to help low-income families stretch limited budgets and support positive health and education outcomes for low-income children.
Food insecurity is linked to a number of negative health outcomes, such as increased risk of heart disease and diabetes, as well as nutritional deficiencies and negative behavioral, social, and academic outcomes with lasting consequences.b A recent Council of Economic Advisers (CEA) report detailed the positive benefits SNAP can have for children and families.c By reducing poverty and food insecurity, SNAP can improve health and development, particularly for children. Children receiving SNAP face lower risks of nutritional deficiencies and poor health than they would without SNAP, which can lead to improved health over their lifetimes, according to studies cited in the CEA report, which also noted that SNAP improves children’s success in school. One study, for example, found that test scores among students in SNAP households are highest for those receiving benefits two to three weeks before the test, suggesting that SNAP can help students learn and prepare for tests. Short-term academic outcomes, in turn, are linked with longer-term outcomes in education and employment. Children in households receiving SNAP automatically qualify for school meals through the National School Lunch and School Breakfast Programs.
For school districts with high-poverty schools, adopting community eligibility can increase access to school meals and help children perform better in school. Children experiencing hunger have been found to have lower math scores and be more likely to repeat a grade.d Teens experiencing hunger are more likely to have been suspended from school and have difficulty getting along with other children.e Meanwhile, educators report that children who eat breakfast at school are more likely to arrive at school on time, to behave, and be attentive in class.f
a Barbara Sard and Douglas Rice, “Creating Opportunity for Children,” Center on Budget and Policy Priorities, October 15, 2014, https://www.cbpp.org/sites/default/files/atoms/files/10-15-14hous.pdf.
b Brynne Keith-Jennings, “SNAP Promotes Long-Term Gains, Especially for Children,” Center on Budget and Policy Priorities, December 11, 2015, https://www.cbpp.org/blog/snap-promotes-long-term-gains-especially-for-children.
c “Long-term Benefits of the Supplemental Nutrition Assistance Program,” Executive Office of the President, December 2015, https://www.whitehouse.gov/sites/whitehouse.gov/files/documents/SNAP_report_final_nonembargo.pdf.
d Katherine Alaimo, Christine M. Olson, and Edward A. Frongillo, Jr. “Food Insufficiency and American School-Aged Children’s Cognitive, Academic, and Psychosocial Development,” Pediatrics 2001, 108(1):44-53.
e Ibid.
f J. Michael Murphy, “Breakfast and Learning: An Updated Review,” Journal of Current Nutrition and Food Science 2007, 3(1): 3-36.
What Share of Eligible School Districts Have Adopted Community Eligibility?
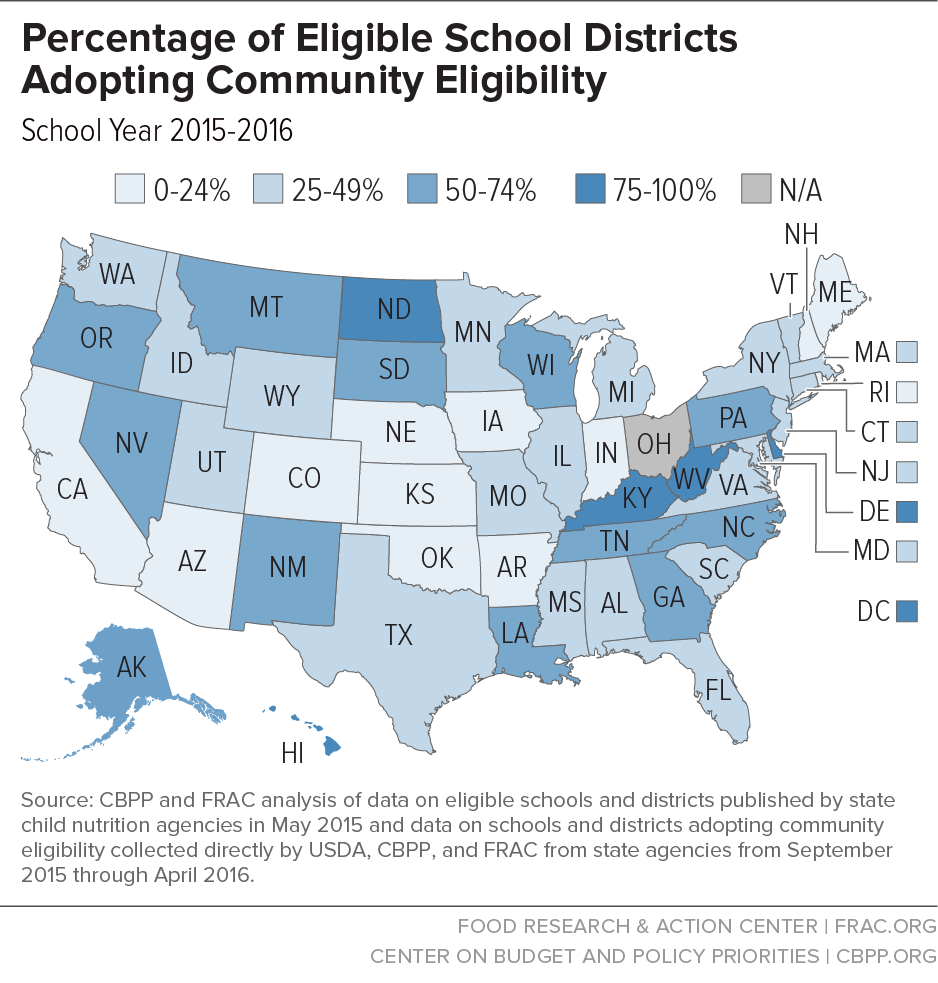
Nationwide, 2,979 school districts — 37 percent of those eligible — are now using the Community Eligibility Provision in some or all schools.[8] This is an increase from 2,216 school districts, or 32 percent of those eligible, in the 2014–2015 school year. The median state’s take-up rate for eligible school districts was 36 percent. Figure 1 shows the variation across states in community eligibility take-up by school districts.
Almost all states increased the number of districts implementing community eligibility, but the rise in the number of participating districts varied considerably across states. Some states doubled or nearly doubled their participating districts. In Hawaii, for example, an additional five participating districts joined the six participating districts from the 2014–2015 school year so that 79 percent of eligible districts now have adopted community eligibility. New Mexico increased the number of electing districts from 53 in the 2014–2015 school year to 93 this year, bringing the share of all eligible districts that have adopted community eligibility to 71 percent. In Louisiana, the state did not issue a new funding policy until just before the 2014–2015 school year, leading some school districts to hold off on adopting community eligibility that year. For 2015–2016, as schools became aware of the new policy and the many benefits experienced by districts that had already adopted it, 19 more districts opted in, bringing the total number of participating districts to 63 out of 108 eligible, or 58 percent. At the other end of the spectrum, Wyoming did not add any additional districts (but did add participating schools).
Several of the pilot states approved to offer community eligibility in the years before the nationwide rollout in 2014–2015, including Florida, Illinois, Kentucky, and Massachusetts, experienced significant growth in the number of school districts participating, continuing the upward trend of previous years. Illinois, Kentucky, and Michigan were first to offer the provision in the 2011–2012 school year; the District of Columbia, New York, Ohio, and West Virginia were added in the 2012–2013 school year; Florida, Georgia, Maryland, and Massachusetts implemented in the 2013–2014 school year. Kentucky was particularly strong in school district growth, adding 33 new districts in the 2015–2016 school year to the 104 already participating. Fully 80 percent of all eligible school districts in Kentucky are now participating in community eligibility in all or some of their schools.
Many districts that declined to implement community eligibility last year when it first became available decided to implement it for this school year. One factor contributing to delayed implementation was that during the first year of nationwide availability, some states did not set state-specific policy, for example, on how state education funding will be allocated to community eligibility schools in the absence of school meal application data on student income. Data from school meal applications have long been used for many purposes, including allocating funding and determining which students are eligible for certain services, such as tutoring or test fee waivers.
Districts can use alternative poverty measures in community eligibility schools, such as direct certification or Medicaid data, or determine which individual students qualify for services through a household income form separate from the school meal programs. When a state does not establish a clear policy, however, districts at first may be wary of adopting community eligibility without knowing the effects it might have beyond the school nutrition department. Leading up to the 2015–2016 school year, many states assessed lessons learned from other states and from implementing districts within their state to develop and clarify state policies for community eligibility schools, resulting in more school districts choosing to implement community eligibility.
In addition, statewide outreach and education remain key steps to increasing the number of school districts participating in community eligibility. State education and school nutrition program administrators can identify remaining districts that could benefit from the option but have not yet tried it, and work with them to assess the feasibility of doing so. It is important to keep in mind, however, that school districts vary tremendously in size and may require differentiated technical assistance. For example, in Hawaii, Ke Ana La'ahana Public Charter School with 44 students is a single school district, as is the Los Angeles Unified School District serving more than 640,000 students. Similarly, North Dakota’s Fort Yates Public School district has just one eligible school, while Florida’s Miami-Dade County could adopt community eligibility districtwide for all of its 351 schools. Program administrators and other stakeholders continue to weigh these factors when developing training and education for eligible districts that have not yet adopted community eligibility.
As educators become more familiar with community eligibility, the share of eligible districts that participate likely will continue to grow.
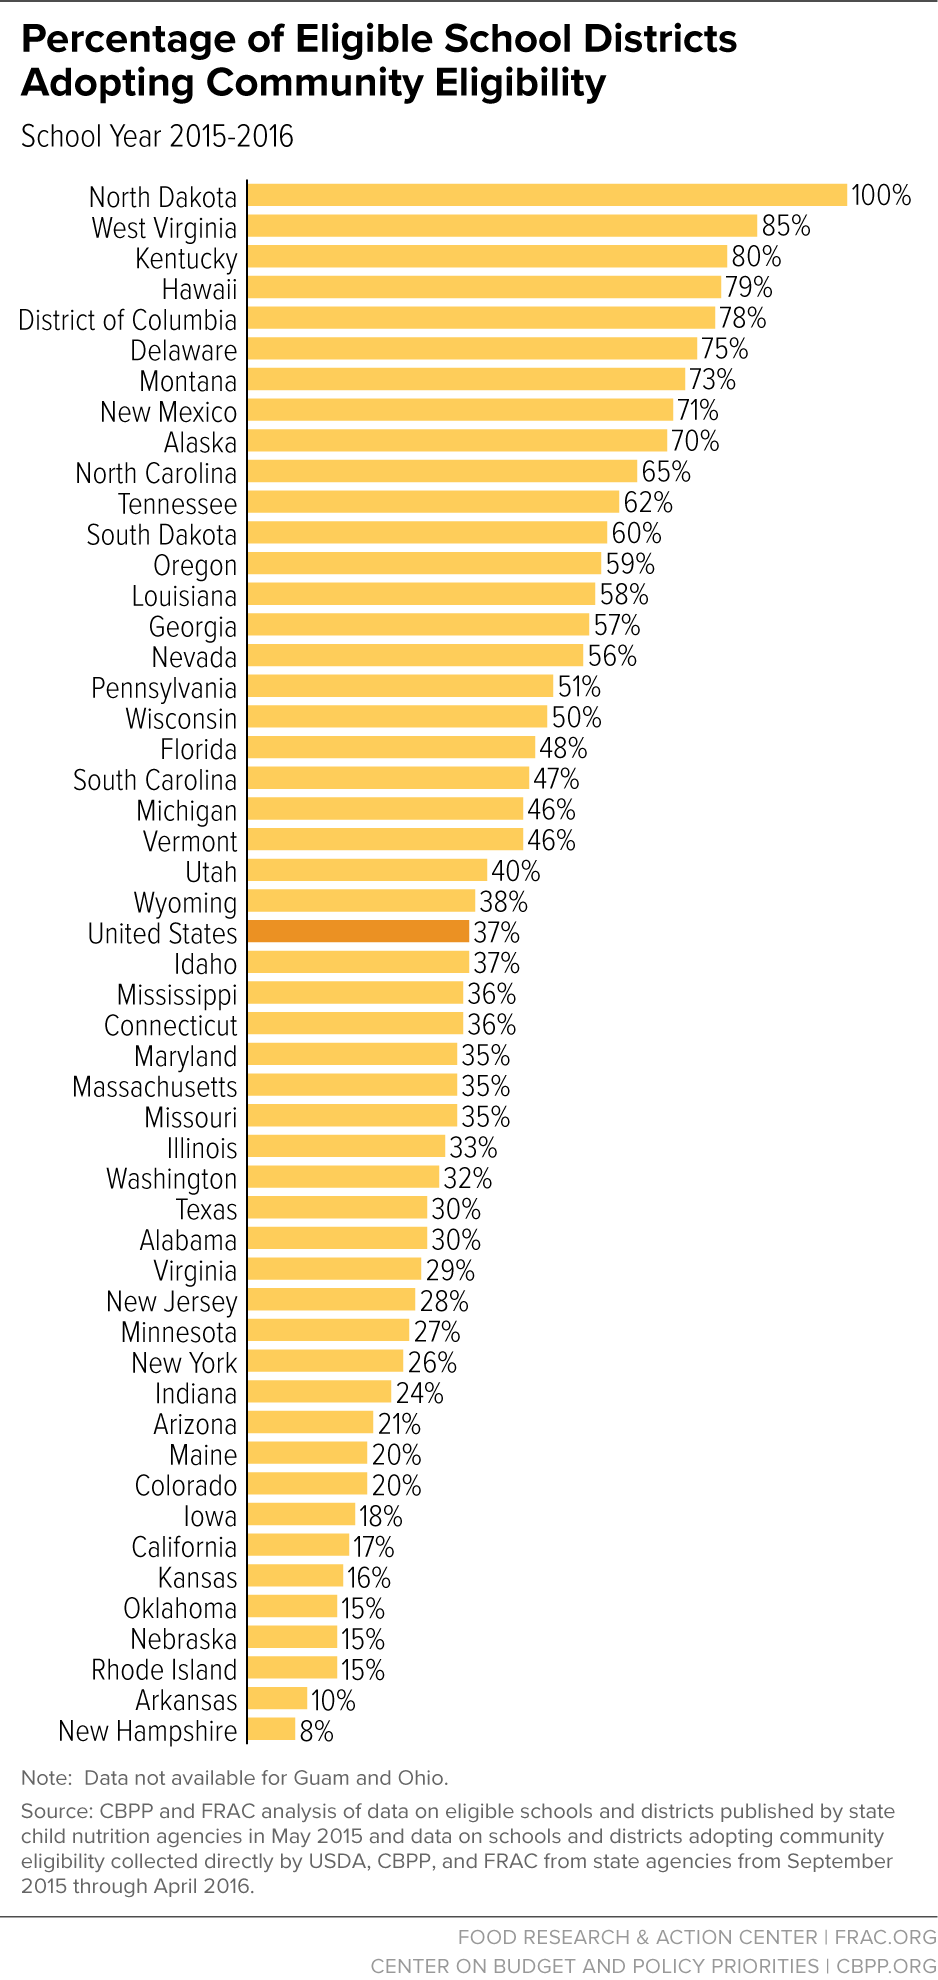
Figure 2 shows the share of school districts in each state that adopted the option this year.
What Share of Eligible Schools Have Adopted Community Eligibility?
Nationwide, 18,247 schools have adopted community eligibility for the current school year, half (50 percent) of those eligible.[9] These schools serve just over 8.5 million students, more than half (56 percent) of the roughly 15.2 million students who attend eligible schools.[10] This is an increase from the 14,214 schools serving 6.7 million children that used community eligibility during the 2014–2015 school year.
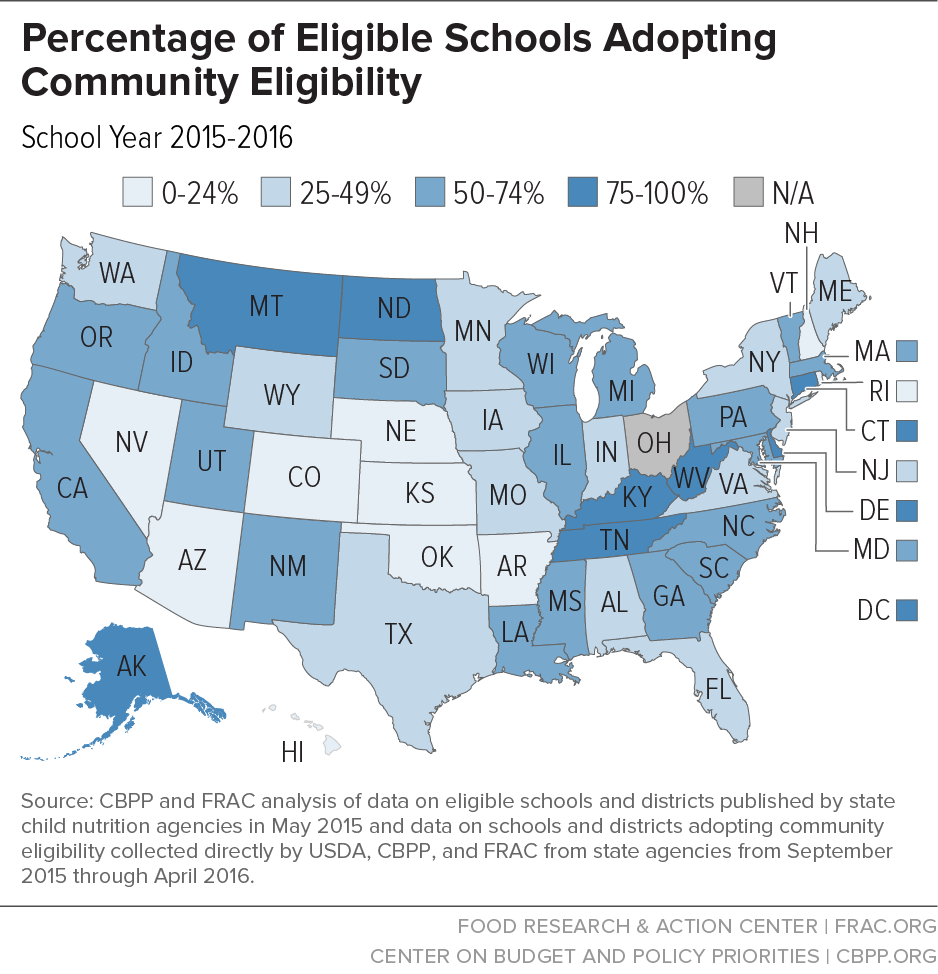
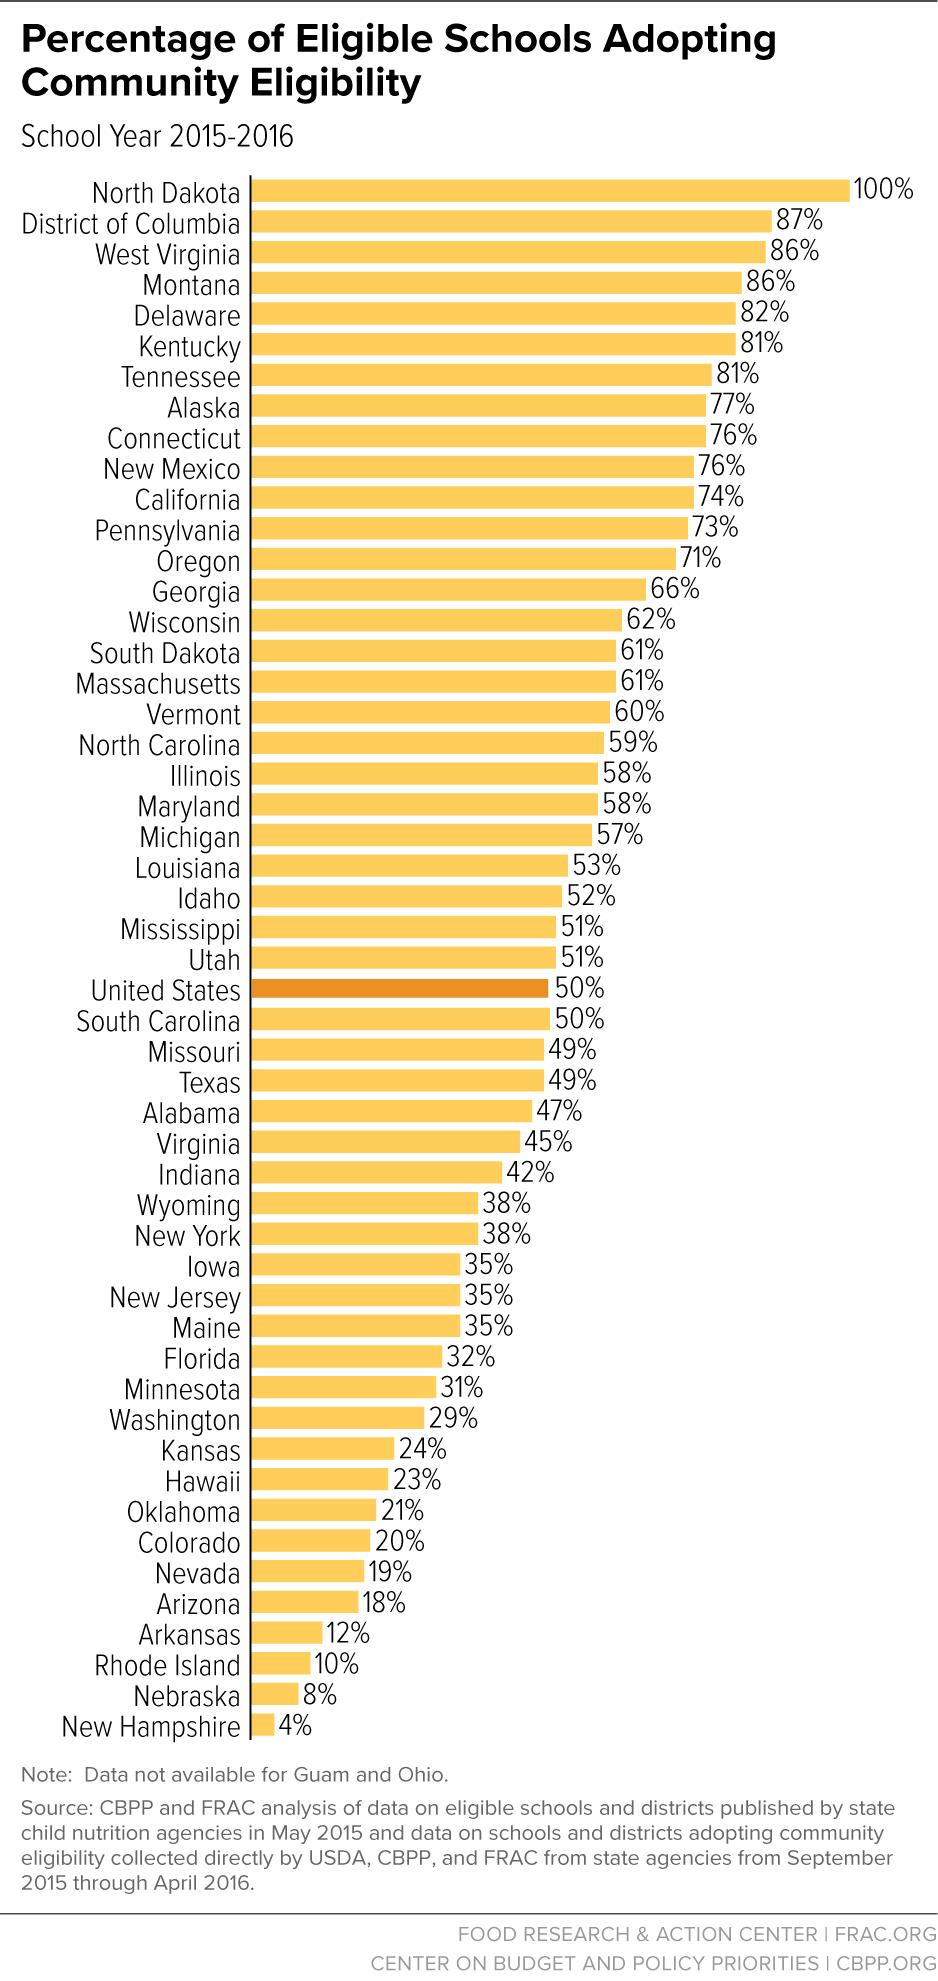
Almost all states increased the number of schools participating in community eligibility from last school year, though growth varies considerably by state.[11] Figure 3 shows the variation across states in community eligibility take-up by schools. California added the largest number of schools, with 443 new schools in 2015–2016, 339 of which are in the Los Angeles Unified School District. Other large states, including Florida, Illinois, and Maryland, had large increases as well with 283, 281, and 202 new schools, respectively. Several medium-sized states also increased participation substantially. Through strong outreach efforts to eligible schools and districts by the state child nutrition agency and other stakeholders, Massachusetts increased by 168 schools and Virginia by 119 schools. Some states with smaller populations and numbers of eligible schools also substantially increased the number of participating schools. New Mexico increased by 86 schools and West Virginia increased by 59 schools.[12] Figure 4 shows the share of schools in each state that adopted the option this year.
The 11 pilot states continued to add significant numbers of schools in the 2015–2016 school year. The continued growth in these pilot states is partially because they have had time to establish sound state policy for community eligibility schools. Maryland, for example, clarified the state’s education funding formula for community eligibility schools through the Hunger-Free Schools Act of 2015. On the same day the act was signed into law, Baltimore City Public Schools adopted community eligibility in all of their 186 schools. In addition, these states have had several years to educate districts about the option and school district administrators have had the opportunity to witness its benefits. In addition to Maryland, pilot states with substantial growth in the number of schools participating in the 2015–2016 school year include Florida, Illinois, Kentucky, and Massachusetts. Massachusetts and Florida expanded their use of Medicaid data for direct certification, which improved their ability to identify low-income students and increased the pool of schools eligible for community eligibility.
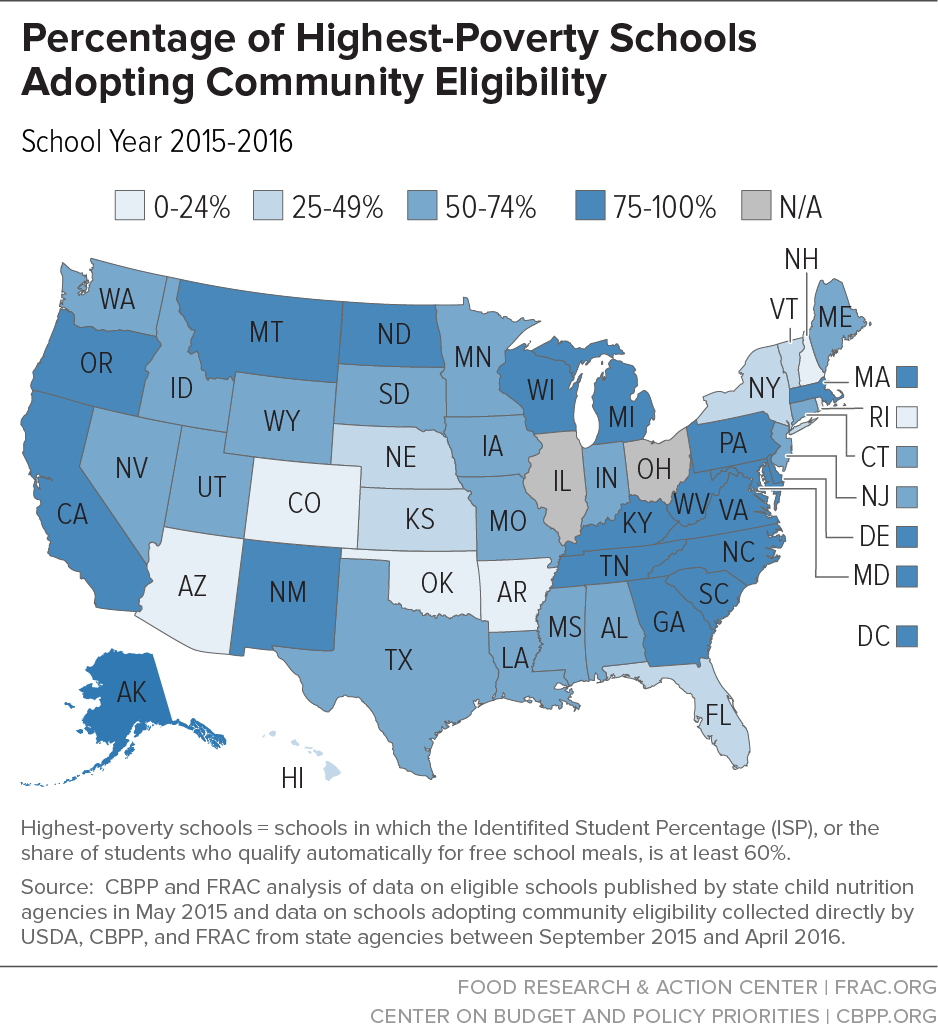
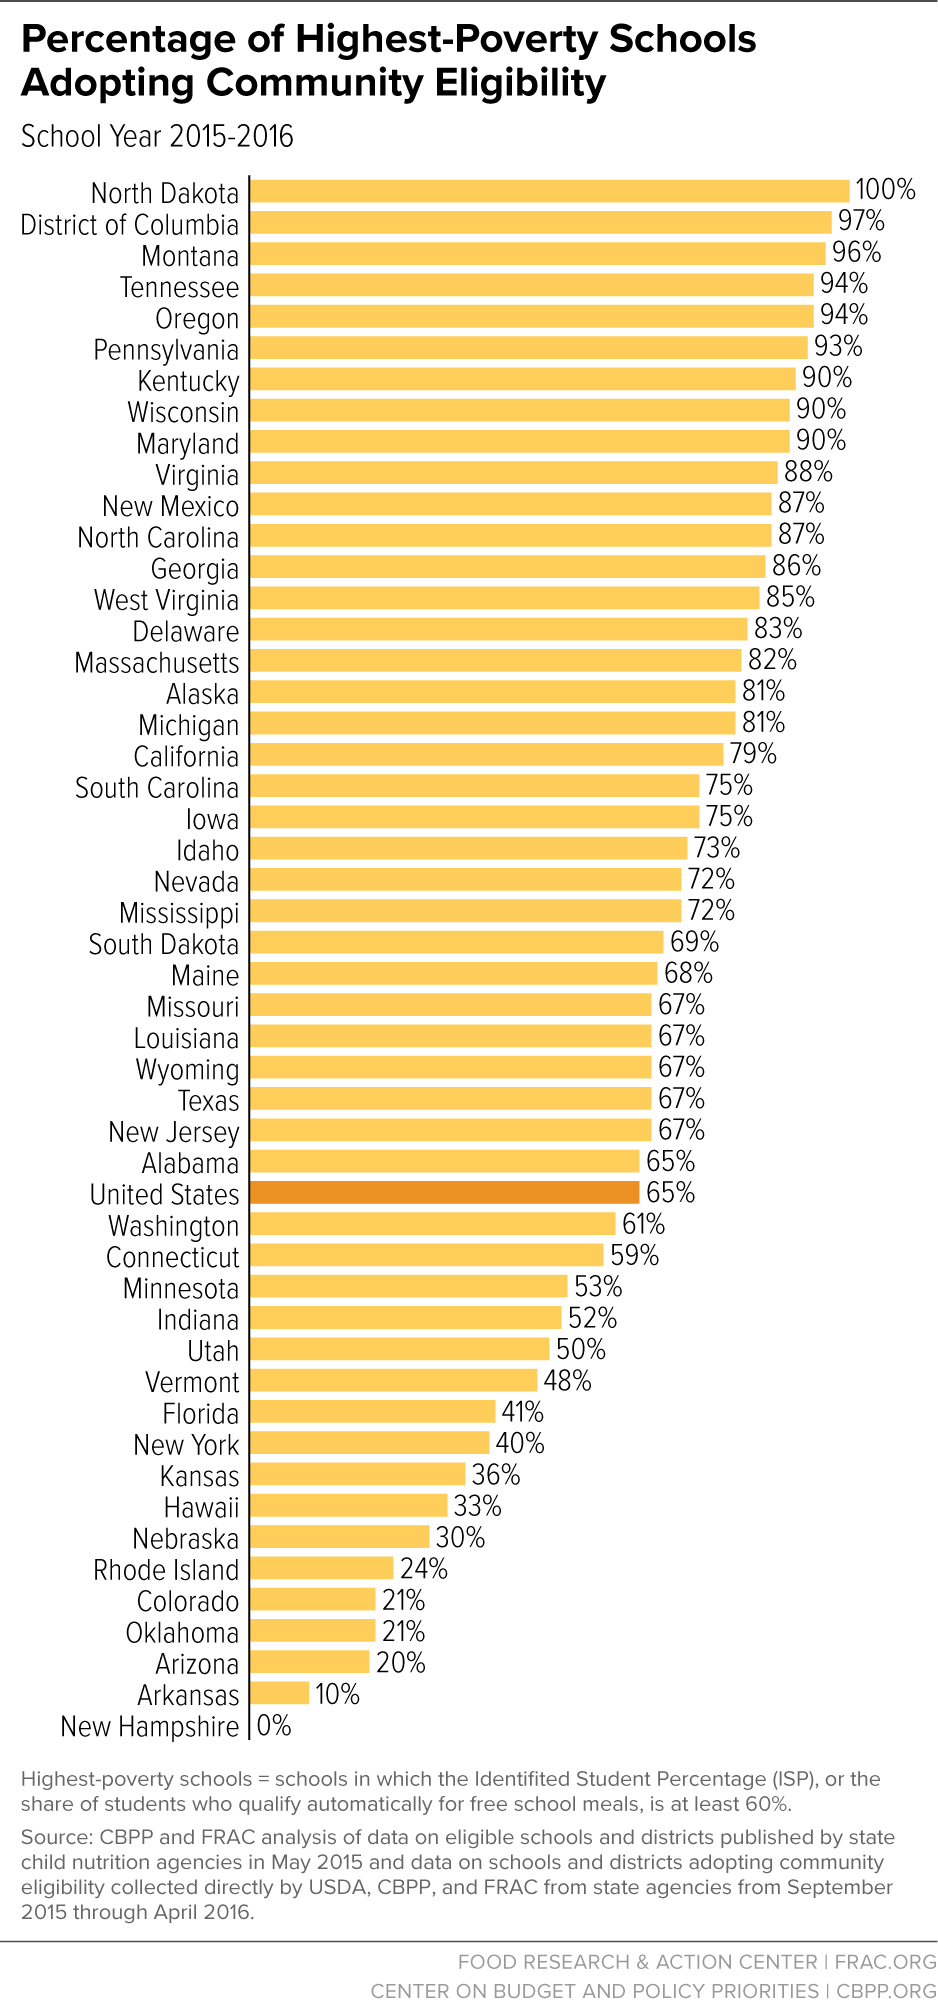
What Share of the Highest-Poverty Schools Have Adopted Community Eligibility?
Schools with ISPs of 60 percent or higher receive the highest federal reimbursement rate (depending on the ISP, 96 percent to 100 percent of meals served are reimbursed at the federal free rate), making implementing the Community Eligibility Provision financially easier. Schools with ISPs this high serve an overwhelming majority of low-income students. Implementing community eligibility in these highest-poverty schools ensures that nutritious meals reach the most vulnerable children.
Across the states for which data on the highest-poverty schools were available, 14,051 of the eligible schools had ISPs of 60 percent or higher.[13] In states for which data were available, 9,129 highest-poverty schools adopted community eligibility, resulting in a take-up rate of 65 percent for the 2015–2016 school year, slightly higher than the 63 percent take-up rate for the 2014–2015 school year. In the median state, 69 percent of the highest-poverty schools participated, but the rate varied by state, from 100 percent in North Dakota (17 of the 17 highest-poverty schools), 97 percent in the District of Columbia (113 of the 116 highest-poverty schools), and 96 percent in Montana (50 of the 52 highest-poverty schools), down to 0 percent in New Hampshire (none of the five highest-poverty schools). Figure 5 shows the variation across states in community eligibility take-up by the highest-poverty schools for the 2015-2016 school year. Figure 6 shows the share of the highest-poverty schools in each state that have adopted the option.
What Can We Learn from These Take-Up Measures?
With a full year and a half of nationwide implementation of community eligibility complete, states and school districts have learned many lessons that can help increase take-up in the coming years. Nonetheless, education about community eligibility is still needed. Detailed information about which eligible districts and schools have adopted community eligibility can help school nutrition administrators — and other stakeholders who would like schools in high-poverty communities to offer meals at no charge to all students — to educate school districts about the option. This information can illuminate the advantages of adopting community eligibility and strategies to address barriers to participation, and inform the development of more tailored training and outreach plans. For example, if larger districts in a state have widely adopted community eligibility but smaller districts have not, state staff can reach out to smaller districts to address their concerns.
Some observations and likely explanations about the data across eligible districts, schools, and the highest-poverty schools:
-
In some states, take-up is much higher on one measure than another. About two-thirds of the states have higher take-up rates among schools than districts. This likely reflects greater interest in community eligibility among districts that can implement it in more schools; these districts, with larger shares of low-income students, may be more attuned to supporting these schools to meet their students’ needs. For example, in Massachusetts, only 35 percent of eligible school districts have adopted community eligibility, but 61 percent of eligible schools have. This reflects the fact that the larger districts with concentrated poverty, including Boston, Springfield, and Worcester — comprising roughly a third, or 251 of Massachusetts’ 756 eligible schools — have adopted community eligibility districtwide. But by working with districts that have smaller pockets of poverty affecting only a few schools, school meal administrators and advocates could help bring the benefits of community eligibility to poor students in smaller low-income neighborhoods.
Nonetheless, in 11 states, the share of districts adopting community eligibility exceeds the share of schools. This could occur when school districts with only a single school or a few schools adopt the provision, which is often the case for charter schools. Alternatively, it could reflect districts trying community eligibility in a small number of their eligible schools to see how it works. Of greater concern is the possibility that a state with higher take-up among districts than schools indicates that districts with larger concentrations of poverty are not participating. In Nevada, for example, 56 percent of eligible districts, but only 19 percent of eligible schools, have implemented community eligibility. Most of Nevada’s eligible schools are concentrated in two districts. In Clark County, there are 141 eligible schools, but only 29 schools have implemented, and in Washoe County, there are 31 eligible schools, none of which are participating. These two districts comprise 172 of the 194 schools eligible in Nevada and collectively serve over 350,000 students. Stakeholders have an opportunity to ascertain these districts’ concerns and potentially develop policy responses.
- Take-up is still greatest among the highest-poverty schools, yet many such schools have yet to implement the provision. Because schools with higher ISPs have greater student need and receive higher federal reimbursements, it is not surprising that they generally are more likely to adopt community eligibility. In Virginia, for example, 88 percent of schools with ISPs of 60 percent or higher have adopted the provision, compared with 45 percent of all eligible schools. But in states where take-up is only modestly higher, if at all, among the highest-poverty schools — such as Colorado, where take-up is 21 percent among schools with ISPs of 60 percent or higher and 20 percent among all eligible schools, or Florida, where take-up is 41 percent among schools with ISPs of 60 percent or higher and 32 percent among all eligible schools — many of the highest-poverty schools are concentrated in large districts that have chosen not to implement community eligibility in any schools. For these communities, it could be useful to make sure that the highest-poverty schools understand the community eligibility reimbursement structure and use USDA’s tool to estimate federal reimbursements under the option.[14]
- States with high take-up in their first year of implementation continued to make gains in the second year. In Alaska and Tennessee, for example, take-up was relatively high across all three measures (school districts, schools, and highest-poverty schools), reflecting supportive policies and concerted outreach efforts to eligible schools. Because of this early effort in the first year, Alaska and Tennessee were able to focus this year on remaining districts that could benefit from adopting the provision. Now with success in the first and second years, they also can share training materials, policies, and implementation strategies with states with lower take-up rates.
- Take-up will likely continue to grow. As direct certification systems improve, state agencies become more accustomed to community eligibility, and as districts benefit from the experience of their peers, take-up among eligible schools likely will continue to rise. The opportunity for district-level staff to learn from their peers is especially important. Many districts that initially implement in some, but not all, schools also tend to add more schools the following school year after seeing the benefits of community eligibility. As the benefits become clear, educators, parents, advocates, and other stakeholders will seek to have more schools adopt community eligibility.
-
Continued low take-up in some states likely reflects state-specific barriers. In Arkansas, for example — where only 18 of the 180 eligible school districts have adopted community eligibility — robust implementation was delayed because of a state education funding policy that needed to be clarified. Before year two, Arkansas enacted a policy to allow schools to adopt community eligibility without fear that the absence of data from school meal applications would affect state funding. For schools implementing community eligibility, Arkansas will generally use free and reduced-price data for the year prior to electing the option, with a plan to reexamine the measure’s accuracy in five years and an option to rely on alternative income forms if meaningful shifts occurred.[15] Despite the state establishing the policy before the 2015–2016 school year, many districts still chose not to adopt the measure, signaling that more education, outreach, and training might be needed.
Similarly, a few remaining states that rely on data from school meal applications to allocate state education funding are still determining the best approaches to ensure that community eligibility schools receive needed resources. Nebraska, for example, is considering how it can use alternative methods to measure poverty in place of school meal applications, but has not yet established a final policy. This has affected community eligibility implementation in the state, as no additional eligible schools adopted community eligibility between the end of the 2014–2015 school year and the start of the 2015–2016 school year. As lacking such a policy can be a barrier to implementation, states are encouraged to learn from other successful state approaches on how to handle alternative sources to school meal applications.
Conclusion
Community eligibility helps ensure that low-income children who attend schools in high-poverty neighborhoods have access to a nutritious breakfast and lunch each school day at no charge. Implementing community eligibility is a concrete step that educators and policymakers can take to increase school meal participation, which has been shown to improve student achievement, diets, and behavior, and to help reduce food insecurity and other poverty-related hardships among children in areas of concentrated poverty. It also substantially reduces administrative work for schools so they can focus their efforts on feeding and educating their students instead of completing paperwork. The fact that half of eligible schools have adopted community eligibility in its second year of nationwide availability demonstrates its appeal. An increase of more than 4,000 schools from the 2014–2015 school year to the 2015–2016 school year shows that as school districts learn about the many benefits of the provision, more schools decide to participate. Still, in many states there remains significant room for greater adoption of the provision. As states and school districts continue to work through state- and district-specific barriers and understand community eligibility’s benefits for our nation’s poorest students, adoption of the provision likely will continue to grow, benefitting many more low-income children and communities.
Appendix 1
| TABLE 1 | |||||||
|---|---|---|---|---|---|---|---|
| Community Eligibility Provision (CEP) Take-Up in School Districts for School Years 2014–2015 and 2015–2016 | |||||||
| 2014–2015a | 2015–2016 | 2014-2015 to 2015-2016 | |||||
| State | Eligible for CEP |
Adopting CEP |
Percentage Adopting CEP of Total Eligible | Eligible for CEPb |
Adopting CEP |
Percentage Adopting CEP of Total Eligible | Change in Number Adopting CEP |
| Alabama | 122 | 31 | 25% | 121 | 36 | 30% | 5 |
| Alaska | 32 | 18 | 56% | 30 | 21 | 70% | 3 |
| Arizona | 91 | 29 | 32% | 271 | 56 | 21% | 27 |
| Arkansas | 159 | 2 | 1% | 180 | 18 | 10% | 16 |
| California | 280 | 28 | 10% | 236 | 40 | 17% | 12 |
| Colorado | 59 | 8 | 14% | 71 | 14 | 20% | 6 |
| Connecticut | 27 | 8 | 30% | 39 | 14 | 36% | 6 |
| Delaware | 31 | 23 | 74% | 32 | 24 | 75% | 1 |
| District of Columbia | 45 | 33 | 73% | 49 | 38 | 78% | 5 |
| Florida | 167 | 61 | 37% | 211 | 102 | 48% | 41 |
| Georgia | 136 | 72 | 53% | 163 | 93 | 57% | 21 |
| Guamc | NA | NA | NA | NA | 1 | NA | NA |
| Hawaii | 12 | 6 | 50% | 14 | 11 | 79% | 5 |
| Idaho | 59 | 12 | 20% | 52 | 19 | 37% | 7 |
| Illinois | 445 | 131 | 29% | 585 | 195 | 33% | 64 |
| Indiana | 103 | 30 | 29% | 152 | 36 | 24% | 6 |
| Iowa | 67 | 13 | 19% | 95 | 17 | 18% | 4 |
| Kansas | 64 | 5 | 8% | 61 | 10 | 16% | 5 |
| Kentucky | 166 | 104 | 63% | 171 | 137 | 80% | 33 |
| Louisiana | 101 | 44 | 44% | 108 | 63 | 58% | 19 |
| Maine | NA | 7 | NA | 79 | 16 | 20% | 9 |
| Maryland | 32 | 5 | 16% | 31 | 11 | 35% | 6 |
| Massachusetts | 141 | 22 | 16% | 136 | 48 | 35% | 26 |
| Michigan | 337 | 182 | 54% | 412 | 190 | 46% | 8 |
| Minnesota | 183 | 35 | 19% | 210 | 57 | 27% | 22 |
| Mississippi | 120 | 42 | 35% | 139 | 50 | 36% | 8 |
| Missouri | 228 | 75 | 33% | 235 | 82 | 35% | 7 |
| Montana | 48 | 39 | 81% | 64 | 47 | 73% | 8 |
| Nebraska | 29 | 1 | 3% | 26 | 4 | 15% | 3 |
| Nevada | 10 | 3 | 30% | 9 | 5 | 56% | 2 |
| New Hampshire | 24 | 0 | 0% | 25 | 2 | 8% | 2 |
| New Jersey | 159 | 28 | 18% | 178 | 50 | 28% | 22 |
| New Mexico | 104 | 53 | 51% | 131 | 93 | 71% | 40 |
| New Yorkd | 602 | 138 | 23% | 720 | 186 | 26% | 48 |
| North Carolina | 135 | 54 | 40% | 128 | 83 | 65% | 29 |
| North Dakota | 25 | 16 | 64% | 17 | 17 | 100% | 1 |
| Ohioc | NA | 230 | NA | NA | 254 | NA | 24 |
| Oklahoma | NA | 18 | NA | 344 | 53 | 15% | 35 |
| Oregon | 139 | 51 | 37% | 116 | 68 | 59% | 17 |
| Pennsylvaniae | 259 | 94 | 36% | 274 | 141 | 51% | 47 |
| Rhode Island | 14 | 1 | 7% | 13 | 2 | 15% | 1 |
| South Carolina | 80 | 33 | 41% | 89 | 42 | 47% | 9 |
| South Dakota | 60 | 23 | 38% | 43 | 26 | 60% | 3 |
| Tennessee | 157 | 86 | 55% | 156 | 97 | 62% | 11 |
| Texas | 589 | 143 | 24% | 571 | 171 | 30% | 28 |
| Utah | 22 | 5 | 23% | 15 | 6 | 40% | 1 |
| Vermont | 30 | 11 | 37% | 37 | 17 | 46% | 6 |
| Virginia | 90 | 12 | 13% | 89 | 26 | 29% | 14 |
| Washington | 81 | 33 | 41% | 158 | 50 | 32% | 17 |
| West Virginia | 54 | 39 | 72% | 54 | 46 | 85% | 7 |
| Wisconsin | 215 | 76 | 35% | 183 | 91 | 50% | 15 |
| Wyoming | 5 | 3 | 60% | 8 | 3 | 38% | 0 |
| Totalsf | 6,138 | 2,216 | 32% | 7,331 | 2,979 | 37% | 763 |
| TABLE 2 | |||||||
|---|---|---|---|---|---|---|---|
| Community Eligibility Provision (CEP) Take-Up in Eligible Schools for School Years 2014–2015 and 2015–2016 | |||||||
| 2014–2015a | 2015–2016 | 2014-2015 to 2015-2016 | |||||
| State | Eligible for CEP |
Adopting CEP |
Percentage Adopting CEP of Total Eligible | Eligible for CEPb |
Adopting CEP |
Percentage Adopting CEP of Total Eligible | Change in Number Adopting CEP |
| Alabama | 818 | 347 | 42% | 840 | 392 | 47% | 45 |
| Alaska | 168 | 123 | 73% | 180 | 137 | 76% | 14 |
| Arizona | 237 | 73 | 31% | 733 | 133 | 18% | 60 |
| Arkansas | 401 | 4 | 1% | 492 | 57 | 12% | 53 |
| Californiac | 1,106 | 208 | 19% | 875 | 651 | 74% | 443 |
| Colorado | 236 | 34 | 14% | 416 | 82 | 20% | 48 |
| Connecticut | 208 | 133 | 64% | 280 | 212 | 76% | 79 |
| Delaware | 128 | 96 | 75% | 132 | 107 | 81% | 11 |
| District of Columbia | 168 | 125 | 74% | 178 | 155 | 87% | 30 |
| Florida | 2,070 | 548 | 26% | 2,561 | 831 | 32% | 283 |
| Georgia | 1,075 | 589 | 55% | 1,053 | 700 | 66% | 111 |
| Guamd | NA | NA | NA | NA | 27 | NA | NA |
| Hawaii | 81 | 6 | 7% | 109 | 25 | 23% | 19 |
| Idaho | 179 | 50 | 28% | 169 | 88 | 52% | 38 |
| Illinois | 1,877 | 1,041 | 55% | 2,264 | 1,322 | 58% | 281 |
| Indiana | 447 | 214 | 48% | 606 | 253 | 42% | 39 |
| Iowa | 234 | 78 | 33% | 315 | 110 | 35% | 32 |
| Kansas | 258 | 18 | 7% | 262 | 64 | 24% | 46 |
| Kentucky | 889 | 611 | 69% | 998 | 804 | 81% | 193 |
| Louisiana | 897 | 335 | 37% | 919 | 484 | 53% | 149 |
| Maine | NA | 21 | NA | 170 | 59 | 35% | 38 |
| Maryland | 396 | 25 | 6% | 391 | 227 | 58% | 202 |
| Massachusetts | 729 | 294 | 40% | 756 | 462 | 61% | 168 |
| Michigan | 1,018 | 625 | 61% | 1,164 | 662 | 57% | 37 |
| Minnesota | 358 | 56 | 16% | 402 | 125 | 31% | 69 |
| Mississippi | 539 | 257 | 48% | 579 | 298 | 51% | 41 |
| Missouri | 695 | 298 | 43% | 670 | 330 | 49% | 32 |
| Montana | 119 | 93 | 78% | 155 | 127 | 82% | 34 |
| Nebraska | 95 | 2 | 2% | 112 | 9 | 8% | 7 |
| Nevada | 158 | 13 | 8% | 194 | 36 | 19% | 23 |
| New Hampshire | 53 | 0 | 0% | 51 | 2 | 4% | 2 |
| New Jersey | 570 | 197 | 35% | 651 | 227 | 35% | 30 |
| New Mexico | 551 | 343 | 62% | 576 | 429 | 74% | 86 |
| New Yorke | 2,252 | 1,246 | 55% | 3,585 | 1,351 | 38% | 105 |
| North Carolina | 1,341 | 648 | 48% | 1,285 | 752 | 59% | 104 |
| North Dakota | 36 | 23 | 64% | 24 | 24 | 100% | 1 |
| Ohiod | NA | 739 | NA | NA | 842 | NA | 103 |
| Oklahoma | NA | 100 | NA | 864 | 184 | 21% | 84 |
| Oregon | 675 | 262 | 39% | 476 | 340 | 71% | 78 |
| Pennsylvaniaf | 1,036 | 646 | 62% | 1,084 | 795 | 73% | 149 |
| Rhode Island | 98 | 1 | 1% | 96 | 10 | 10% | 9 |
| South Carolina | 588 | 226 | 38% | 694 | 348 | 50% | 122 |
| South Dakota | 231 | 142 | 61% | 178 | 109 | 61% | (33) |
| Tennessee | 1,205 | 862 | 72% | 1,204 | 924 | 77% | 62 |
| Texas | 3,591 | 1,477 | 41% | 3,396 | 1,665 | 49% | 188 |
| Utah | 68 | 22 | 32% | 55 | 28 | 51% | 6 |
| Vermont | 64 | 32 | 50% | 94 | 56 | 60% | 24 |
| Virginia | 444 | 87 | 20% | 462 | 206 | 45% | 119 |
| Washington | 393 | 122 | 31% | 599 | 172 | 29% | 50 |
| West Virginia | 475 | 369 | 78% | 495 | 428 | 86% | 59 |
| Wisconsin | 688 | 348 | 51% | 610 | 381 | 62% | 33 |
| Wyoming | 9 | 5 | 56% | 13 | 5 | 38% | 0 |
| Totalsg | 30,812 | 14,214 | 45% | 34,467 | 18,247 | 50% | 4,033 |
| TABLE 3 | |||||||
|---|---|---|---|---|---|---|---|
| Community Eligibility Provision (CEP) Take-Up in Highest-Poverty Schools for School Years 2014–2015 and 2015–2016 Schools with 60% or Higher Identified Student Percentage (ISP) | |||||||
| 2014–2015a | 2015–2016 | 2014-2015 to 2015-2016 | |||||
| State | Eligible for CEP |
Adopting CEP |
Percentage Adopting CEP of Total Eligible | Eligible for CEPb |
Adopting CEP |
Percentage Adopting CEP of Total Eligible | Change in Number Adopting CEP |
| Alabama | 364 | 234 | 64% | 283 | 184 | 65% | (50) |
| Alaska | 82 | 65 | 79% | 113 | 92 | 81% | 27 |
| Arizona | 49 | 37 | 76% | 224 | 45 | 20% | 8 |
| Arkansas | 96 | 3 | 3% | 124 | 13 | 10% | 10 |
| Californiac | 91 | 17 | 19% | 190 | 151 | 79% | 134 |
| Colorado | 37 | 4 | 11% | 61 | 13 | 21% | 9 |
| Connecticut | 83 | 71 | 86% | 32 | 19 | 59% | (52) |
| Delaware | 48 | 41 | 85% | 41 | 34 | 83% | (7) |
| District of Columbia | 73 | 63 | 86% | 116 | 113 | 97% | 50 |
| Florida | 1,033 | 423 | 41% | 1,345 | 555 | 41% | 132 |
| Georgia | 379 | 338 | 89% | 475 | 410 | 86% | 72 |
| Guamd | NA | NA | NA | NA | 9 | NA | NA |
| Hawaii | 22 | 2 | 9% | 42 | 14 | 33% | 12 |
| Idaho | 22 | 10 | 45% | 11 | 8 | 73% | (2) |
| Illinoise | NA | NA | NA | NA | 992 | NA | NA |
| Indiana | 170 | 123 | 72% | 255 | 133 | 52% | 10 |
| Iowa | 71 | 46 | 65% | 111 | 83 | 75% | 37 |
| Kansas | 65 | 13 | 20% | 58 | 21 | 36% | 8 |
| Kentucky | 349 | 320 | 92% | 484 | 441 | 91% | 121 |
| Louisiana | 456 | 225 | 49% | 470 | 316 | 67% | 91 |
| Maine | NA | 1 | NA | 22 | 15 | 68% | 14 |
| Maryland | 176 | 13 | 7% | 227 | 204 | 90% | 191 |
| Massachusetts | 414 | 207 | 50% | 475 | 391 | 82% | 184 |
| Michigan | 493 | 444 | 90% | 612 | 495 | 81% | 51 |
| Minnesota | 202 | 44 | 22% | 205 | 109 | 53% | 65 |
| Mississippi | 246 | 173 | 70% | 288 | 206 | 72% | 33 |
| Missouri | 277 | 181 | 65% | 272 | 183 | 67% | 2 |
| Montana | 33 | 30 | 91% | 52 | 50 | 96% | 20 |
| Nebraska | 27 | 2 | 7% | 23 | 7 | 30% | 5 |
| Nevada | 21 | 10 | 48% | 39 | 28 | 72% | 18 |
| New Hampshire | 8 | 0 | 0% | 5 | 0 | 0% | 0 |
| New Jersey | 180 | 119 | 66% | 248 | 165 | 67% | 46 |
| New Mexico | 254 | 188 | 74% | 232 | 202 | 87% | 14 |
| New Yorkf | 1,301 | 867 | 67% | 2,394 | 952 | 40% | 85 |
| North Carolina | 488 | 330 | 68% | 500 | 434 | 87% | 104 |
| North Dakota | 17 | 16 | 94% | 17 | 17 | 100% | 1 |
| Ohiod | NA | NA | NA | NA | 573 | NA | NA |
| Oklahoma | NA | NA | NA | 227 | 48 | 21% | NA |
| Oregon | 223 | 114 | 51% | 144 | 135 | 94% | 21 |
| Pennsylvaniag | 538 | 430 | 80% | 586 | 544 | 93% | 114 |
| Rhode Island | 41 | 0 | 0% | 38 | 9 | 24% | 9 |
| South Carolina | 250 | 122 | 49% | 289 | 217 | 75% | 95 |
| South Dakota | NA | NA | NA | 158 | 109 | 69% | NA |
| Tennessee | 507 | 442 | 87% | 545 | 513 | 94% | 71 |
| Texas | 1,277 | 778 | 61% | 1,296 | 863 | 67% | 85 |
| Utah | 16 | 9 | 56% | 6 | 3 | 50% | (6) |
| Vermont | 16 | 11 | 69% | 21 | 10 | 48% | (1) |
| Virginia | 120 | 53 | 44% | 143 | 126 | 88% | 73 |
| Washington | 141 | 69 | 49% | 163 | 100 | 61% | 31 |
| West Virginia | 63 | 54 | 86% | 26 | 22 | 85% | (32) |
| Wisconsin | 349 | 277 | 79% | 360 | 325 | 90% | 48 |
| Wyoming | 2 | 2 | 100% | 3 | 2 | 67% | 0 |
| Totals | 11,171 | 7,021 | 63% | 14,051 h | 10,703 h | 65% h | 3,682 |
| TABLE 4 | |||
|---|---|---|---|
| Student Enrollment at Schools Adopting the Community Eligibility Provision (CEP) for School Years 2014-2015 and 2015-2016 | |||
| Student Enrollment at Schools Adopting CEP 2014-2015 |
Student Enrollment at Schools Adopting CEP 2015-2016 |
Change in Student Enrollment at Schools Adopting CEP (2014-2015 to 2015-2016) | |
| Alabama | 180,789 | 196,802 | 16,013 |
| Alaska | 27,666 | 29,234 | 1,568 |
| Arizona | 30,763 | 55,048 | 24,285 |
| Arkansas | 791 | 20,060 | 19,269 |
| California | 113,513 | 435,900 | 322,387 |
| Colorado | 12,455 | 34,920 | 22,465 |
| Connecticut | 66,524 | 105,547 | 39,023 |
| Delaware | 47,013 | 51,524 | 4,511 |
| District of Columbia | 44,485 | 54,061 | 9,576 |
| Florida | 274,071 | 474,006 | 199,935 |
| Georgia | 354,038 | 420,383 | 66,345 |
| Guam | NA | 20,149 | NA |
| Hawaii | 2,640 | 4,650 | 2,010 |
| Idaho | 18,828 | 32,299 | 13,471 |
| Illinois | 552,751 | 672,831 | 120,080 |
| Indiana | 96,604 | 117,187 | 20,583 |
| Iowa | 32,103 | 46,021 | 13,918 |
| Kansas | 5,992 | 19,641 | 13,649 |
| Kentucky | 279,144 | 385,043 | 105,899 |
| Louisiana | 146,141 | 217,496 | 71,355 |
| Maine | 5,284 | 17,977 | 12,693 |
| Maryland | 7,624 | 94,496 | 86,872 |
| Massachusetts | 134,071 | 200,948 | 66,877 |
| Michigan | 266,249 | 275,579 | 9,330 |
| Minnesota | 20,688 | 49,944 | 29,256 |
| Mississippi | 136,095 | 148,781 | 12,686 |
| Missouri | 106,126 | 111,319 | 5,193 |
| Montana | 15,802 | 21,161 | 5,359 |
| Nebraska | 180 | 2,425 | 2,245 |
| Nevada | 7,917 | 15,970 | 8,053 |
| New Hampshire | 0 | 644 | 644 |
| New Jersey | 99,840 | 107,277 | 7,437 |
| New Mexico | 119,300 | 149,057 | 29,757 |
| New York | 505,859 | 528,748 | 22,889 |
| North Carolina | 310,850 | 357,307 | 46,457 |
| North Dakota | 5,284 | 5,661 | 377 |
| Ohio | 305,451 | 354,727 | 49,276 |
| Oklahoma | 43,433 | 66,323 | 22,890 |
| Oregon | 103,601 | 129,635 | 26,034 |
| Pennsylvania | 327,573 | 394,630 | 67,057 |
| Rhode Island | 838 | 6,531 | 5,693 |
| South Carolina | 111,453 | 173,364 | 61,911 |
| South Dakota | 13,056 | 14,626 | 1,570 |
| Tennessee | 417,165 | 436,821 | 19,656 |
| Texas | 941,262 | 1,015,384 | 74,122 |
| Utah | 7,019 | 8,565 | 1,546 |
| Vermont | 7,386 | 12,751 | 5,365 |
| Virginia | 42,911 | 99,404 | 56,493 |
| Washington | 53,369 | 69,432 | 16,063 |
| West Virginia | 124,978 | 145,057 | 20,079 |
| Wisconsin | 133,232 | 146,330 | 13,098 |
| Wyoming | 1,255 | 1,255 | 0 |
| Totals | 6,661,462 | 8,554,931 | 1,893,469 |
Appendix 2: Resources to Support Community Eligibility Implementation
CBPP and FRAC have worked closely to monitor implementation of community eligibility and develop resources to support states and school districts as they consider adopting it. CBPP and FRAC both have community eligibility websites, which include resources explaining all facets of community eligibility, including state resources.[16] USDA’s Food and Nutrition Service website also has useful materials, webinars, and resources.[17]
There are many ways to engage policymakers around community eligibility. At the state and local level, school nutrition staff can work closely with staff from other programs that use data from school meal applications to develop policies that will allow high-poverty schools to adopt community eligibility without jeopardizing other important resources.
CBPP and FRAC’s guide for state and local anti-hunger and education advocates outlines key steps they can take this spring to ensure that high-poverty schools have the information needed to consider community eligibility.[18] Additional resources that are especially helpful to school districts considering community eligibility and stakeholders working with districts include:
- Report on first two years of community eligibility
- Report on community eligibility in 2014–2015 school year
- Database of eligible and adopting schools
- Implications of community eligibility for Title I (summary)
- Community eligibility and E-rate program
- Alternatives to school meal applications for community eligibility schools
- Implementation guide
Appendix 3: Data Collection and Analysis
CBPP and FRAC obtained information on schools that have adopted community eligibility as of September 1, 2015 directly from USDA and state education agencies. Between September 2015 and January 2016, USDA collected these data — specifically, the school’s name, school district, ISP, participation as part of a group or a whole district, and enrollment — and provided this information to CBPP and FRAC. CBPP and FRAC directly followed up with state education agencies between January and April of 2016 for data clarifications and to obtain missing data.
Under federal law, states were required to publish, by May 1, 2015, a list of schools and districts with ISPs of at least 40 percent and those with ISPs between 30 and 40 percent (near-eligible schools and districts). We compared these published lists to the lists of adopting schools, and compiled a universe of eligible schools and districts that included schools adopting community eligibility in the 2015–2016 school year. When compiling the universe of eligible schools, we treated a district as eligible if it contained at least one eligible school. We treated a school as eligible if it appeared on a state’s published list of eligible schools. Schools that were missing from a state’s list of eligible schools, but appeared on its list of adopting schools and were eligible based on their ISPs, were treated as eligible. We relied on the data from the list of participating schools, as it provided more recent data than the list of eligible schools published last year.
There are two circumstances under which a school might be able to adopt community eligibility even if it did not appear on a state’s list of eligible schools.
- Schools can participate individually or as a group (part of or all of a district). A group’s eligibility is based on the ISP for the group as a whole; a group may contain schools that would not qualify individually.
- USDA permitted states to base their published lists on proxy data readily available to them. Proxy data are merely an indicator of potential eligibility, not the basis for eligibility. Districts must submit more accurate information, which may be more complete, more recent, or both, when applying to adopt community eligibility.
Not all states published or provided actual ISPs, or published a list of eligible schools. For states that did not, we did not calculate the share of schools with ISPs of 60 percent or higher that have adopted community eligibility.
For most adopting schools, the lists obtained from USDA and state education agencies indicated whether the district elected to adopt community eligibility partially or districtwide, and whether the school was part of an adopting group.
States provided group-level ISP data for adopting schools. In the few states where both group-level and school-level data were provided, we used group-level data and categorized them accordingly.
End Notes
[1] This paper uses the term “school districts” to refer to Local Educational Agencies.
[2] Under federal law, states were required to publish a list of schools that were eligible for the Community Eligibility Provision. Based on those lists, more than 34,000 schools were eligible. Because states were permitted to use proxy data that missed some eligible schools, the number of eligible schools was likely modestly higher.
[3] For a comprehensive explanation of community eligibility and analysis of its implementation in the first two years, see Madeleine Levin and Zoë Neuberger, “Community Eligibility: Making High-Poverty Schools Hunger-Free,” Center on Budget and Policy Priorities and Food Research & Action Center, October 1, 2013, https://www.cbpp.org/research/community-eligibility-making-high-poverty-schools-hunger-free.
[4] USDA’s press release is available at http://www.usda.gov/wps/portal/usda/usdamediafb?contentid=2015/10/0297.xml&printable=true&contentidonly=true.
[5] The database is available at https://www.cbpp.org/database.
[6] A more detailed explanation of how community eligibility works can be found in Levin and Neuberger, “Community Eligibility: Making High-Poverty Schools Hunger-Free,” pp. 7-11.
[7] For a comprehensive discussion of options available to community eligibility schools to identify low-income students, see Jessie Hewins, Madeleine Levin, Zoë Neuberger, and Becca Segal, “The Community Eligibility Provision: Alternatives to School Meal Applications,” Food Research & Action Center and Center on Budget and Policy Priorities, June 19, 2014, https://www.cbpp.org/research/the-community-eligibility-provision-alternatives-to-school-meal-applications.
[8] Under federal law, states were required to publish a list of school districts that were eligible for the Community Eligibility Provision districtwide, as well as a list of individual schools that were eligible. Links to each state’s lists can be found at https://www.cbpp.org/research/food-assistance/school-districts-and-schools-that-are-eligible-for-the-school-meals. To determine the universe of eligible districts, this analysis includes all districts with at least one eligible school. It includes districts with schools that adopted community eligibility, even if the district did not appear on the original list, because, in some instances, the published lists were based on “proxy data” available to states rather than the actual school district data that are the basis for approving districts. For more information on requirements related to the published lists, see http://www.fns.usda.gov/sites/default/files/SP32-2014os.pdf.
[9] States were required to publish a list of schools that were eligible for the Community Eligibility Provision. Links to each state’s lists can be found at https://www.cbpp.org/research/food-assistance/school-districts-and-schools-that-are-eligible-for-the-school-meals. To determine the universe of eligible schools, this analysis includes schools that adopted community eligibility, even if the school did not appear on the original list, because in some instances the published lists were based on “proxy data” available to states rather than the actual school district data that are the basis for approving districts and schools.
[10] Student enrollment data for schools that adopted community eligibility were collected in the fall and winter of 2015 and reflect enrollment for the 2015–2016 school year, but student enrollment data for eligible schools that have not adopted community eligibility were taken from the state lists of eligible and near-eligible schools published in May 2015 and reflect enrollment for the 2014–2015 school year.
[11] South Dakota is the only state in which the total number of community eligibility schools declined, decreasing from 142 in the 2014–2015 school year to 109 in the 2015–2016 school year.
[12] There are some states, however, where substantial changes occurred between the number of schools on last year’s list of eligible schools and this year’s, creating the appearance of a more substantial change in take-up than actually occurred. In Washington and Arizona, the states’ data collection methodology changed. Florida and New York expanded their use of Medicaid data for direct certification, which improved their ability to identify low-income students and increased the pool of schools eligible for community eligibility. Oregon corrected a mistake in the methodology used to generate last year’s list of eligible schools.
[13] CBPP and FRAC obtained ISPs for schools adopting community eligibility from 50 states, the District of Columbia, and Guam directly from USDA and state agencies. For eligible schools that have not yet adopted community eligibility, ISP data were available for 48 states (all but Illinois and Ohio) and the District of Columbia.
[14] USDA’s estimator tool is available at http://www.fns.usda.gov/sites/default/files/cn/SP15-2013a2updated2.xls.
[15] Arkansas Department of Education, Emergency Rules Governing Distribution of Student Special Needs Funding and the Determination of Allowable Expenditures of Those Funds, September 2015, http://www.arkansased.gov/public/userfiles/rules/Current/Student_Special_Needs_Funding_Emergency_Rules_2015_Update_Final_w_Emergency_Clause.pdf.
[16] See http://frac.org/federal-foodnutrition-programs/national-school-lunch-program/community-eligibility/ and https://www.cbpp.org/community-eligibility-making-schools-hunger-free.
[17] See http://www.fns.usda.gov/school-meals/community-eligibility-provision.
More from the Authors

Areas of Expertise

Jessie Hewins is a senior child nutrition policy analyst at the Food Action and Research Center.
Mieka Sanderson is a child nutrition policy analyst for school nutrition programs at the Food Action and Research Center.

Areas of Expertise

Areas of Expertise