

Federal Policymakers Should Raise Revenue to Address Fiscal and Investment Deficits to Responsibly Steward the Nation’s Economy
Executive Summary
Our nation faces twin deficits that threaten the short- and long-term economic well-being of the nation and its people: a federal budget deficit and a federal investment deficit.
The latest data show that the U.S. budget deficit as a percent of the economy was 6 percent last year ― the last five years have been the only years since World War II where the unemployment rate was less than 5 percent but the deficit exceeded 5 percent of GDP. At the same time, we have failed to properly make investments that could make our nation better off such as in medical research and policies that will make life more affordable for people in the U.S. with low and moderate incomes.
Policymakers need to address each deficit without exacerbating the other to steward our nation’s economy responsibly, expand opportunity, and build a more shared prosperity.
There is no magical way to address both deficits: we will have to raise revenue to solve both challenges.
The Federal Fiscal Deficit and Growing Debt Pose Economic and Political Challenges
The U.S Treasury reported that the federal deficit came in at $2.0 trillion in fiscal year 2026 that ended September 30. The Congressional Budget Office (CBO) projects that debt and interest payments will continue to grow faster than the economy over the coming decades. Because our federal government is running a significant deficit, it must take on debt. Generally, higher debt means higher interest rates for consumers and businesses, which makes buying a car, affording a home, launching a small business, or getting a student loan more expensive. Moreover, there is the risk that policymakers will use higher deficits and debt as an excuse to push for deep and harmful cuts in public services, such as health care and food assistance, that help families with low- and moderate-incomes afford the basics.
These structural fiscal deficits are, in large part, the result of long-expected increased spending on Medicare and Social Security, as baby boomers have reached retirement age, and large tax cuts that decreased revenues under policies advanced by George W. Bush and Donald Trump.
The aging of the population and its upward pressure on federal spending were well understood in the late 1990s. After efforts to reduce Reagan-era deficits by Bill Clinton and George H.W. Bush, federal revenue was projected to grow faster than spending and lead the U.S. to eventually pay off its debt.
Letting revenue as a share of the economy rise naturally to address the added costs of population aging would have been an elegant solution to our long-term fiscal outlook since it would not have required proactive tax increases or spending cuts. In other words, policymakers didn’t have to do anything to cover the costs of population aging other than allow revenue to rise as a share of the economy, as they were poised to do under the law in place at the time.
Instead, policymakers took actions that made our fiscal outlook unsustainable ― large temporary tax cuts were enacted under President George W. Bush and later most were made permanent under President Obama. Still more temporary tax cuts were enacted during the first Trump Administration and then those that were expiring were extended in the July 2025 reconciliation law, with yet even more temporary tax cuts added on top.
An appropriate fiscal goal for policymakers is stabilizing the debt-to-GDP ratio. We estimate that closing this “fiscal gap” would require revenue increases and/or spending cuts that, taken together, total 2.4 percent of GDP or about $9.5 trillion of deficit reduction over ten years. That, plus the resulting interest savings, would reduce the overall ten-year deficit from its current projected average of 6.2 percent of GDP to 3.4 percent.
At the Same Time, We Are Under-Investing in Areas that Matter to Families and the Economy
The U.S. is a rich but highly unequal country. It has the fifth highest GDP per capita among the industrialized democracies in the Organization for Economic Cooperation and Development (OECD), which is 19 percent higher than Germany’s per capita GDP, and more than 35 percent higher than Canada’s, the United Kingdom’s, and France’s. The typical U.S. household ― that is, households with incomes in the middle 20 percent ― has the second highest income after taxes and transfers of any country in the OECD ($45,000 on average after adjusting for household size).
But the story is completely different for households with incomes in the bottom 10 percent of the income distribution. Despite living in a much wealthier-than-average country, these households’ size-adjusted incomes are right around the OECD average ($10,700 compared to $10,500). The average income for this group is lower than in Canada, Australia, and Belgium and right around the same level as in Germany and France. Households of color are disproportionately represented in the bottom of the income distribution due to historical and continuing racial discrimination, which has locked them out of opportunities for economic prosperity through education, employment, housing, and more.
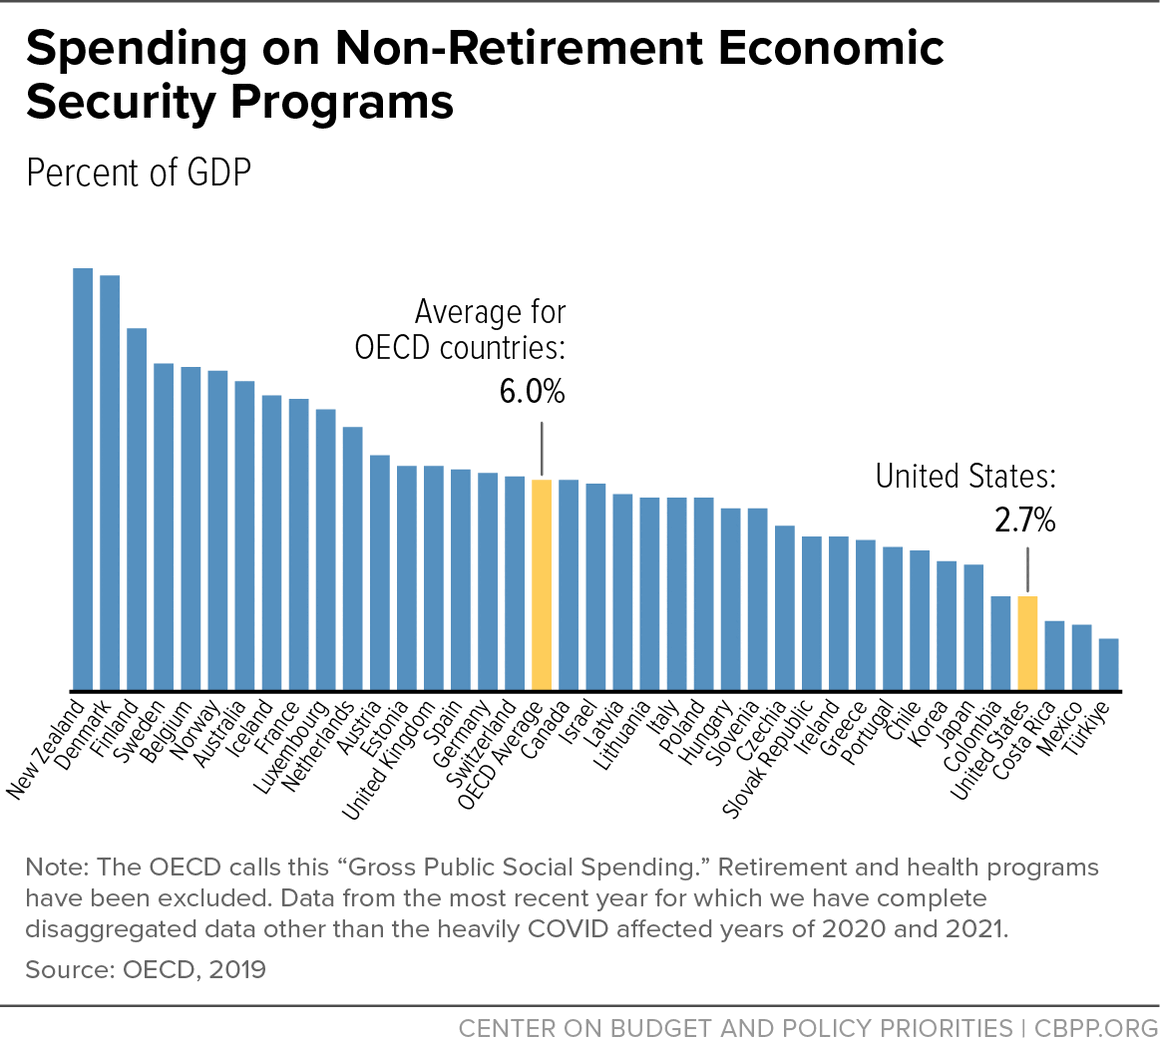
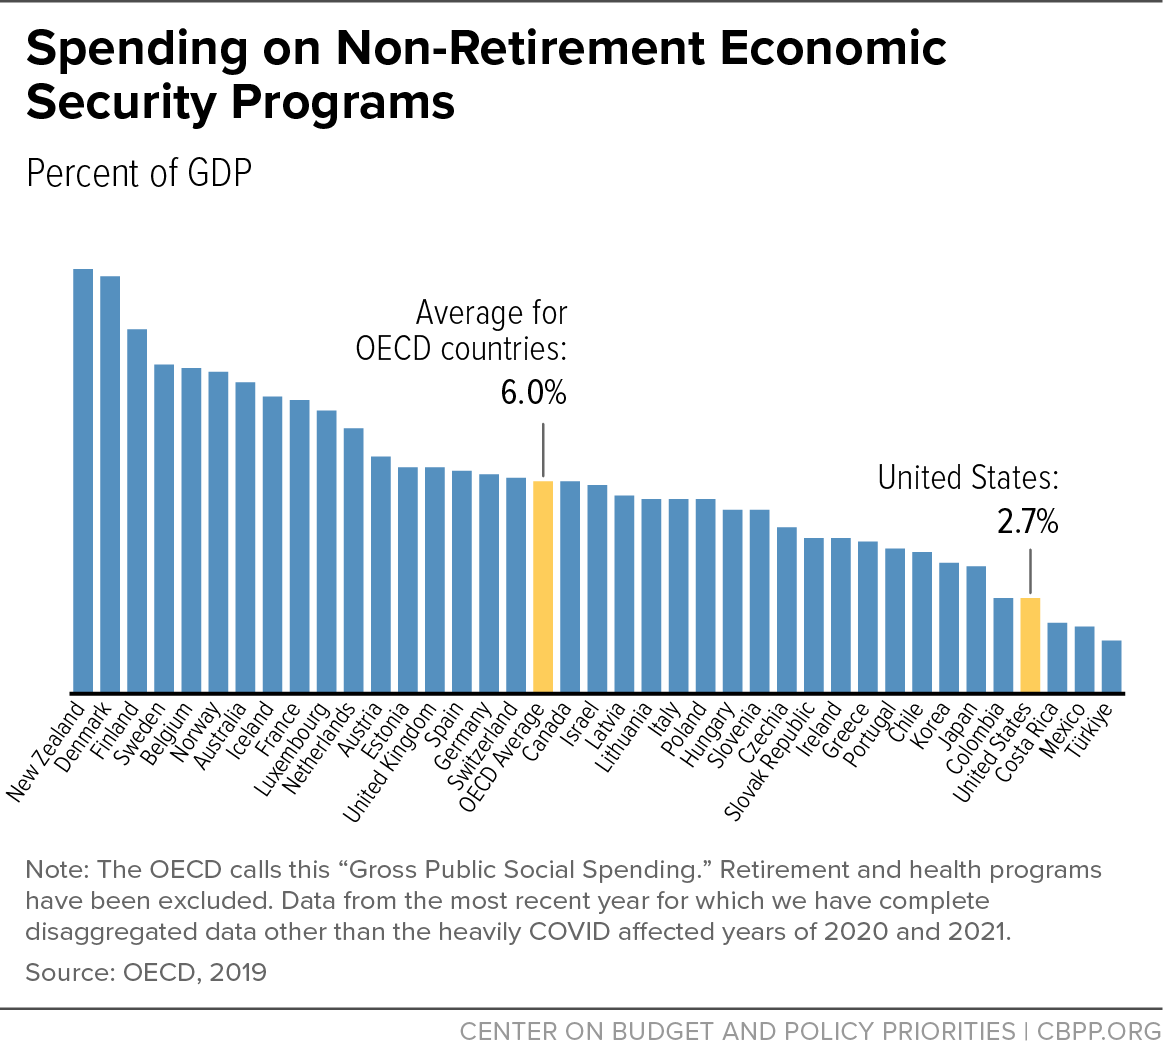
The relatively low incomes of these households reflect, in part, a lack of investment in them. The U.S. spends only 2.7 percent of its economy on economic security programs outside of retirement, which is less than half the OECD average. These programs include disability benefits, child care and family benefits, unemployment benefits, housing, and other benefits. They, for example, help a parent working in a low-paying job afford rent and a working-age person afford groceries when they lose their job.
In addition, the U.S. underinvests in other public services that would support a strong economy and benefit all its residents, such as education and scientific research. For example, public spending on non-defense research and development is below its 1960s, 1970s, and 1980s averages as a percent of GDP and increasing it would grow the economy in the long run.
Raising Additional Revenue Is the Key to Addressing Both Fiscal and Investment Deficits Without Making Either One Worse
Taking away food assistance and health coverage from people who need it, cutting how much we spend on public schools or college financial aid, and retreating on our investments in life-saving medical care or other basic research would, in the short term, reduce our fiscal deficit, but at the expense of increasing our investment deficit and hardship while reducing future widespread prosperity.
In some cases, such as the harmful 2025 Republican reconciliation law in which expensive tax cuts tilted to the wealthy were partially offset by cuts to food assistance and health care, policymakers have enacted laws that made both deficits worse.
Neither approach is good for the country. Policymakers should instead search for solutions that improve both deficits ― and raising federal revenue has to be a key element of those solutions.
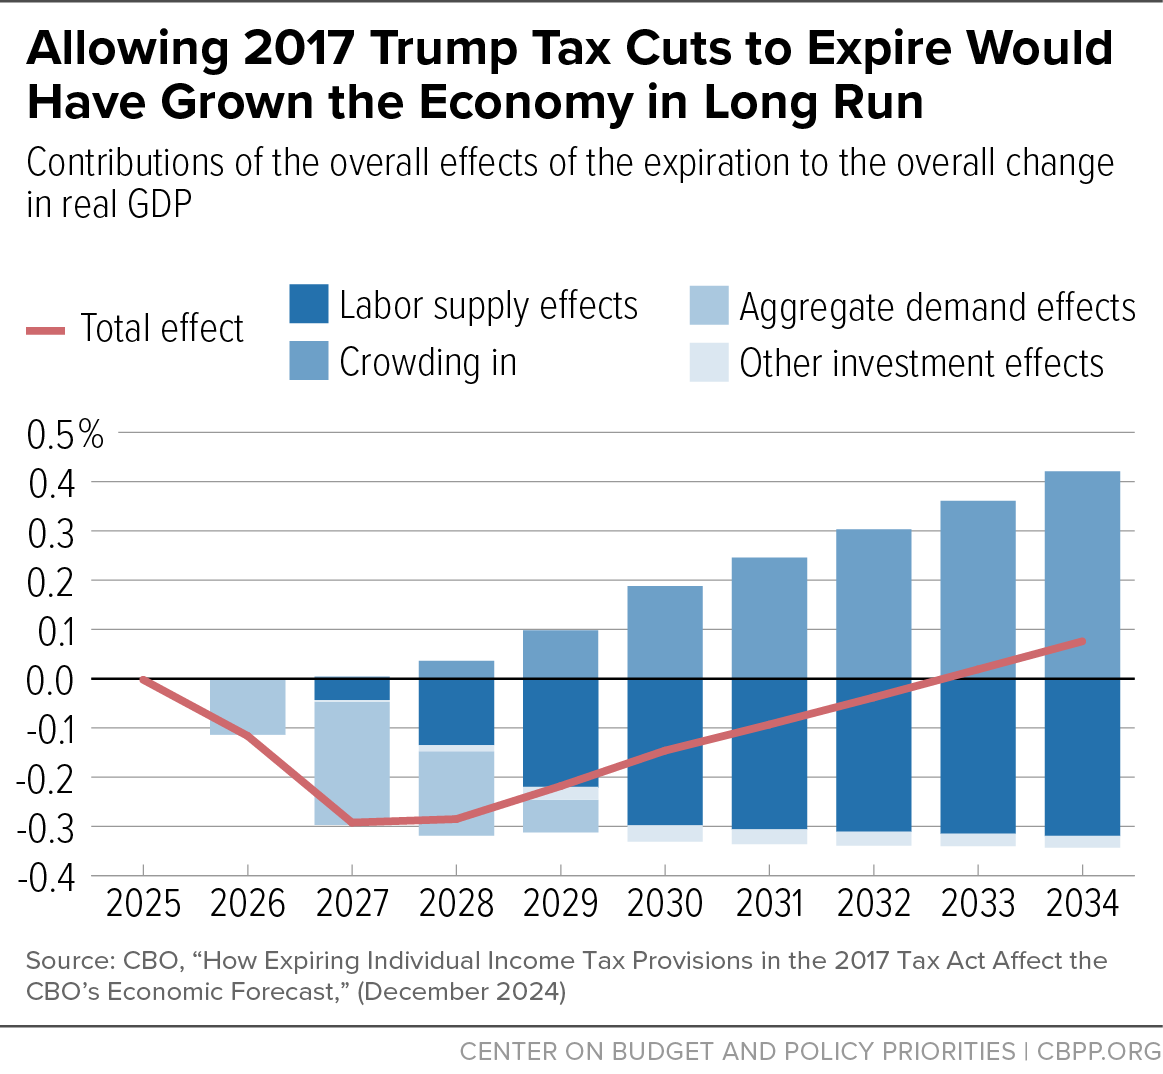
The main argument against raising revenue is that it will hinder economic growth, but analyses of extending the expiring individual provisions of the 2017 tax law and the 2025 Republican reconciliation law have found that, in the long run, tax increases can grow the economy by reducing deficits, interest rates, and debt.
U.S. Faces a Substantial Fiscal Deficit and Growing Debt
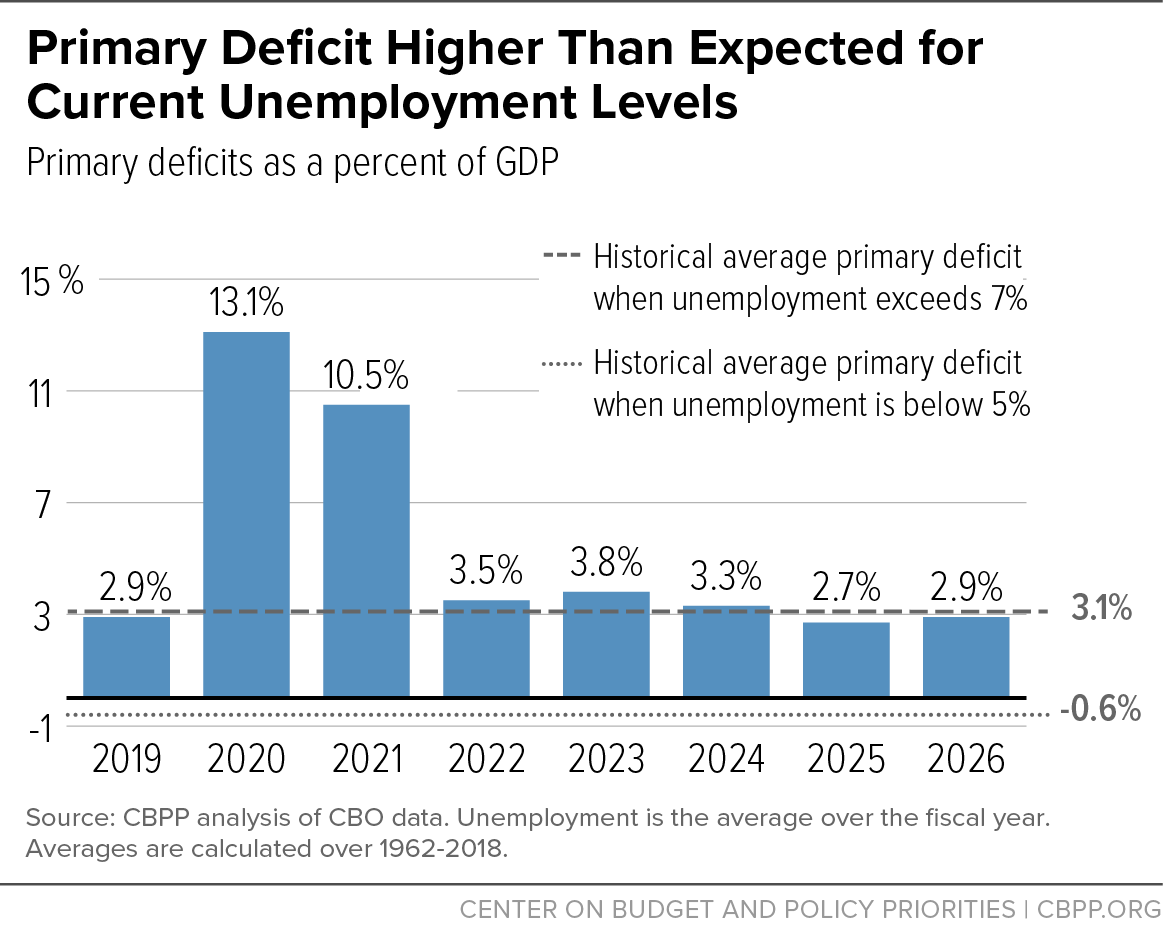
The U.S. recorded a deficit of $2.0 trillion in fiscal year 2026, amounting to 6.2 percent of GDP, because revenue ($5.4 trillion or 16.7 percent of GDP) was less than program costs ($6.3 trillion or 19.6 percent of GDP) and net interest payments ($1.1 trillion or 3.3 percent of GDP). The primary deficit — that is, the difference between revenues and program spending while excluding interest costs — was $922 billion and 2.9 percent of GDP. This is generally a preferred measure for evaluating a government’s current fiscal choices since interest payments reflect past debt accumulation; they are not costs that policymakers can choose.
Deficits at this level are especially high for an economy where unemployment is low (Figure 1), since employed people pay more in taxes and are less reliant on economic security programs, such as unemployment insurance. With the exception of pandemic-affected fiscal years 2020 and 2021, each fiscal year since 2019 has had an unemployment rate under 5 percent and a primary deficit around 3 percent. This is an abnormal combination. Over the 1962-2018 period, an unemployment rate below 5 percent typically meant a primary surplus. A primary deficit of 3 percent of GDP was the average fiscal balance when the unemployment rate exceeded 7 percent over that same period. In other words, since 2019, we have been persistently running recession-level deficits even when the economy is strong.

When the federal government runs deficits, it takes on debt, which the government must then service by paying interest. Those interest-related costs are the annual budgetary cost of taking on debt. Debt held by the public as a percent of the economy is approaching historically high levels and is projected to reach 121 percent by 2036, according to CBPP estimates. Interest costs as a percent of the economy are already at a record high.
One reason debt levels have grown is the one-time costs of the responses to the Great Recession and the COVID-19 pandemic. Importantly, however, these events are not ongoing drivers of the upward trajectory of our projected debt and interest, which is largely the result of the ongoing annual mismatch between revenue and programmatic (i.e. non-interest) costs. In fact, if revenue equaled programmatic costs, we could generally expect the debt ratio to fall after one-time events that pushed up the debt conclude, as a result of subsequent GDP growth.
One reasonable measure of the size of our fiscal challenge is the amount of non-interest deficit reduction (that is, the increases in revenue and/or cuts to programs) as a percent of GDP required to keep the debt from rising as a percent of the economy (i.e., to “stabilize the debt”). Known as the “fiscal gap,” we estimate it is currently 2.4 percent of GDP. That is $9.5 trillion of primary deficit reduction over ten years and is roughly similar in magnitude to having programmatic spending match revenue (i.e., to have a primary balance). This approximates reducing the overall deficit from its current projected average of 6.2 percent of GDP over the next decade to 3.4 percent after taking into account interest savings.
Growing Debt Presents Costs and Risks
An environment like the early 2010s was an inappropriate time to be overly concerned with reducing deficits since the unemployment rate exceeded 6 percent and the 5-year Treasury rate — which is roughly the average maturity of U.S. debt — was routinely below 1 percent.[1]
We and several leading economists explained at the time that the focus on reducing deficits was deeply misguided because the economy was weak and unemployment unacceptably high.[2] For example, then-CBPP chief economist Chad Stone told Congress in 2011, “the economic situation today cries out for significant fiscal stimulus" and recommended temporarily expanding or extending enhancements to unemployment insurance, providing more aid to states and local governments, and cutting taxes for the households with incomes at the bottom end of the income distribution.[3]
But that environment has changed.
The 5-year Treasury rate averaged 4.8 percent in September, which has notably increased the fiscal cost of the Treasury’s debt. The 10-year Treasury rate — changes in which affect the cost of credit for mortgages, auto loans, student loan payments, and more — has grown from less than 2 percent when Stone testified to a 5.0 percent average in September 2026.[4] Indeed, the elevated cost of consumer borrowing is a leading potential explanation for U.S. residents’ pessimistic view of the economy.[5]
This summer, we have seen a surge in interest rates on long-term debt across developed countries, including the U.S., France, and Japan. Economists and market participants have pointed to several factors, including inflation (in part owing to the U.S.’s war with Iran that has expanded throughout the Middle East and the uncertainty about if and when the conflict will be resolved and, in part, the Trump tariff regime); the AI investment boom which creates competition for investors’ funds; and these countries’ fiscal trajectories.
Although the extent to which each of these countries’ rise in borrowing costs reflects fiscal concerns is unclear, recent events have shown strong bond market reactions to fiscal policy in other advanced economies. In the United Kingdom, former Prime Minister Liz Truss released a large, deficit-financed tax cut plan that resulted in such a surge in U.K. government bond yields that it led to her resignation weeks later. Japan has long been held as the example of a country that could sustain high debt levels (though this frequently relies on a debt concept serious U.S. budget analysts do not use).[6] Japanese borrowing costs surged this summer to a 30-year high after the prime minister announced a $2.3 trillion increase in public and private investment over 14 years (after several years of falling deficits), prompting the U.S. federal government to intervene in currency markets to support the yen.[7] Indeed, investors believe that part of the reason the U.S. intervened was to prevent Japan from selling off its own supply of U.S. Treasury bonds, which would increase U.S. rates.[8]
While a resolution to the conflict in the Middle East that results in lower oil prices will help with inflation and uncertainty, there is growing concern among economists that high and rising U.S. debt will continue to exert upward pressure on interest rates in ways that increase costs both for the federal government and for households through higher interest rates for mortgages, car loans, credit card balances, and other forms of both business and consumer credit.
More generally, federal deficits and debt create present-day costs and potential risks to the economy and to people. Some of these costs are economic and some are political.
Economic Costs and Risks: Higher Consumer Interest Rates and Potential Fiscal Crisis
Standard economic theory suggests that, all else being equal, a high and rising debt ratio will, over time, put upward pressure on longer-term interest rates and reduce private investment.[9] Importantly, other factors affect interest rates, such as demographics or the demand by foreign central banks for Treasury securities. So there have been times, such as in the 2010s, when longer-term interest rates were low despite rising debt. But careful decomposition still shows that, all things being equal, higher debt means higher interest rates, even when interest rates are falling because of other factors.[10]
Most analysts predict a small effect, with the Congressional Budget Office (CBO) estimating that every percentage point increase in the forecasted debt-to-GDP ratio increases the interest rate on a 10-year Treasury by 2 basis points.[11] But the increase in the debt-to-GDP ratio since 2015 resulting from tax cuts and spending increases (49 percentage points of GDP) suggests that deficit-increasing legislation has raised the 10-year Treasury interest rate by around 1 percentage point.[12]
Higher interest rates on U.S. debt feed through to the interest rates consumers and businesses pay throughout the economy. For example, the 30-year mortgage rate closely tracks the 10-year Treasury rate.[13] Illustrative analysis from the Budget Lab at Yale finds that the legislation increasing the debt-to-GDP ratio since 2015 has increased the amount someone buying a house at the median price must pay in interest annually by $2,500, or by about $76,000 over the lifetime of the 30-year mortgage.[14] Consumers and businesses paying more in interest is the direct economic cost of higher debt.
Higher interest rates can also deter private sector investment, which reduces overall growth in income and wealth. Indeed, given current interest rates, the growth-reducing effects of additional debt can be so large that deficit-financed tax cuts intended to incentivize increases in the supply of labor and capital can actually shrink the economy in the long run. For example, CBO found that extending the expiring 2017 individual tax cuts would shrink the economy by the end of the ten-year budget window.[15] Similarly, the Budget Lab at Yale and the Penn Wharton Budget Model both found that because of the costs of debt, the 2025 Republican reconciliation law, which made permanent the expiring 2017 tax cuts and only partially offset their cost by significantly cutting health care and SNAPs, would shrink the economy in the long run despite the modest supply-side benefits of tax cuts.[16]
Importantly, the effects of higher interest rates on investment are not uniform across all types of investment — they fall more heavily on residential construction than business investment, as a wide array of research shows.[17] Indeed, CBO assumes that an increase in mortgage rates — which as discussed move closely with 10-year Treasury interest rates — will permanently reduce the number of homes.[18]
Higher deficits also raise the risk of a sudden fiscal and financial crisis resulting from a lack of confidence in the real value of Treasury bonds when, for example, markets expect higher inflation from the sheer amount of Treasury issuance.[19] This not only could cause investors to demand dramatically higher interest rates for Treasury bonds, but also lead to a financial crisis as banks, pension funds, and other holders of Treasury bonds see their portfolios suddenly lose value as higher interest rates reduce the value of the Treasury bonds they hold.
It is impossible to know with any certainty the risk of this kind of crisis or whether it would occur at all. CBO views the risk as low in the short term since “no tipping point can be identified at which the debt-to-GDP ratio would become so high that it would make a crisis likely or imminent, nor is there a specific tipping point beyond which interest costs would become so high in relation to GDP that they were unsustainable.”[20] But even though a rising debt need not induce a sudden crisis, an unexpected panic among investors and those holding Treasury securities would be quite harmful; it is a risk that should not be ignored.
The sheer uncertainty of when a fiscal crisis could hit and its negative potential consequences means policymakers should take steps to make the fiscal outlook more sustainable. Certainly, they should not take actions to exacerbate it, such as through large deficit-financed legislation, except during times when it is both necessary and temporary, such as during a recession.
Political Costs: Higher Deficits as an Excuse for Deep and Harmful Budget Cuts
Some policymakers have used higher deficits and debt as an excuse to push for deep and harmful budget cuts to public services. These cuts can have especially detrimental effects on families with the lowest incomes, people with disabilities, children, and many others already struggling to afford their basic needs, when supports such as health coverage and food assistance through SNAP are targeted for cuts. The 2025 Republican reconciliation law is an extreme example. It included $1.4 trillion in tax cuts over ten years just for people making over $500,000, while proponents of the law argued that $1.3 trillion in cuts to SNAP and health care were necessary because of the federal budget outlook.[21] A better choice would have been not to enact the tax cuts for rich households or the cuts to SNAP and health care.
Despite far better choices available to policymakers, the risk remains that lawmakers who refuse to raise revenue or who, worse yet, take actions to reduce revenue will then cite the ensuing deficits to promote harmful cuts. The results include higher poverty and the attendant long-term impacts on children and the economy; more people without access to health coverage; and less public investment in areas such as infrastructure, education, and research, which would also hurt economic growth.
Also, in a future recession or disaster, debt concerns could dissuade policymakers from responding with robust but temporary measures to bolster the economy and mitigate harm; this failure could prolong the downturn and slow the recovery — and, ironically, harm long-term economic growth.
Fiscal Deficits Are Driven by Decisions to Cut Taxes Against a Long-Expected Backdrop of an Aging Population
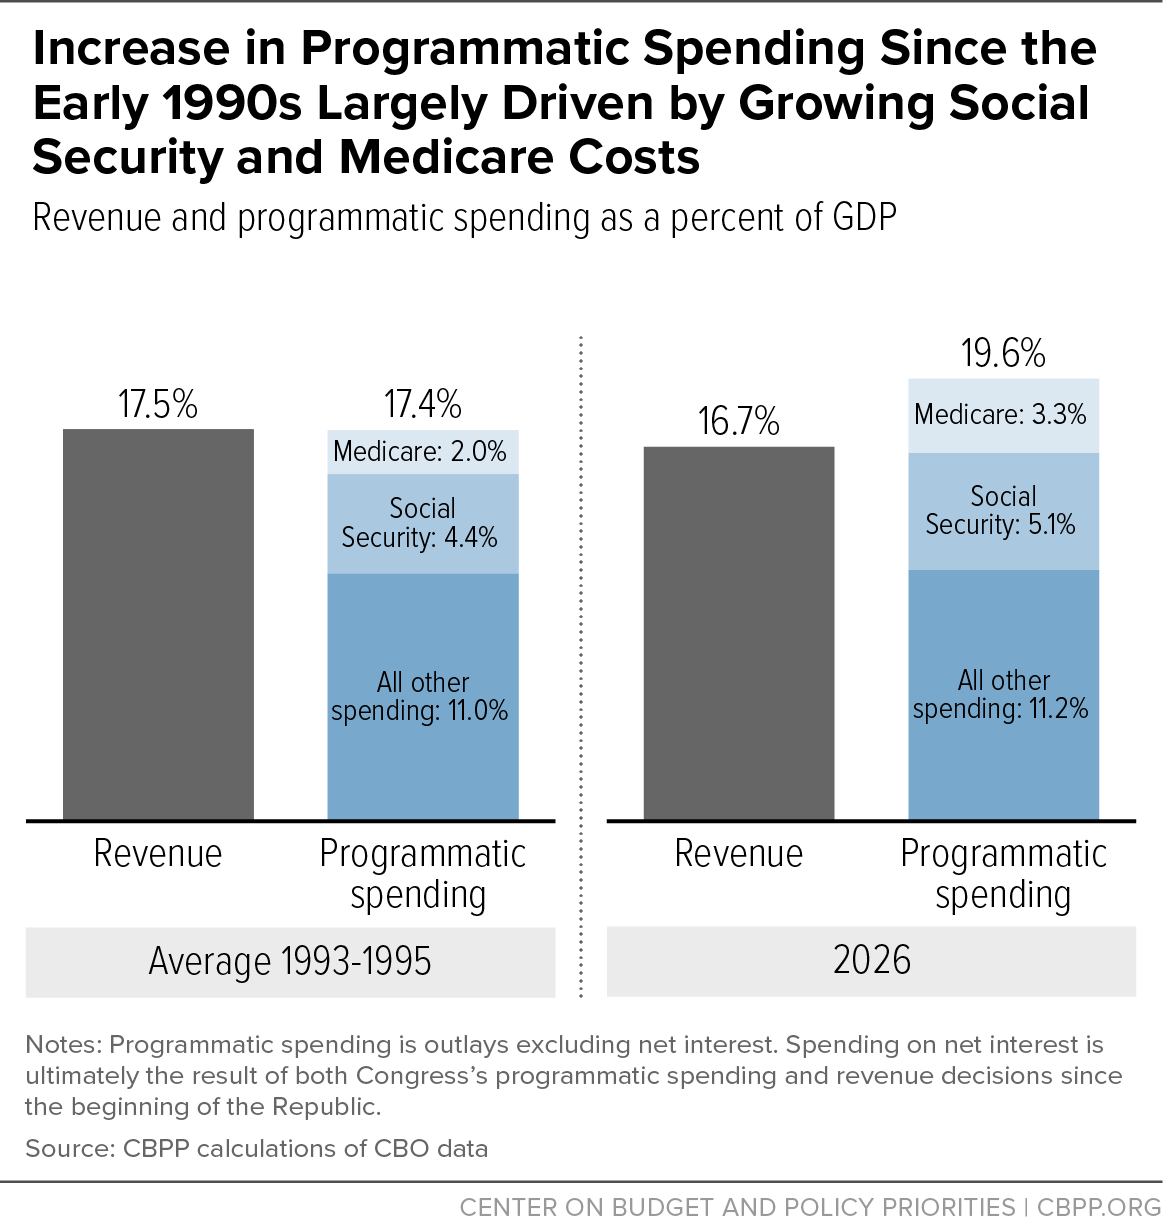
Policymakers may rightfully ask why deficits are so high and projected to grow. It is helpful to compare the federal budget of 2026 to those of 1993-1995 (Figure 2), when revenue and program costs matched, known as a primary balance, since that is a roughly appropriate fiscal goal for today and over the longer term. What has changed since then?[22]

Revenue as a percent of GDP was somewhat higher than it was in 2026: 17.5 percent then as opposed to 16.7 percent last year. This reflects last year’s revenue level being particularly low — 2025 revenue was closer to its early 1990s average (17.3 percent) as was CBO’s February 2026 projection for 2027 (17.7 percent). And even those revenue levels — essentially matching the early 1990s average — were low given the stronger economy: the unemployment rate has been under 4.5 percent since 2022, but it averaged 6.4 percent between 1993 and 1995. As the economy strengthened later in the 1990s, revenue levels began to exceed 19 percent and topped out at 20.0 percent of GDP in 2000. (See Table 1 and interactive chart, "Revenue in 2026 Is in Line With a Much Weaker Economy, Despite Low Unemployment.")
There is no current expectation that we will reach anything like 20 percent of GDP, no matter how strong the economy grows. The tax system of the 1990s was not an accident — it reflected the hard work of Administrations and Congresses under George H.W. Bush and Bill Clinton to bring the earlier Reagan-era deficits to more reasonable levels. The tax cuts advanced by the George W. Bush and both Trump Administrations brought revenue down sharply as a share of GDP.
Programmatic spending, on the other hand, was lower in 1993-1995 (17.4 percent then as opposed to 19.6 percent today); it has grown by 2.2 percentage points of GDP. Increased spending on Social Security and Medicare as the population has aged can account for almost the entire increase in programmatic spending, rising by a combined 2.0 percent of GDP relative to the 1993-1995 average. And key components of spending have shrunk over that period such as defense and non-defense discretionary spending.
| Table 1 | ||||
|---|---|---|---|---|
2026 Falls Close to the Bottom of Revenues in the Last 60 Years, Even at Comparable Levels of Employment | ||||
| Ranking (of years since 1967) | Year | Revenue as a Percent of GDP | Unemployment Rate | Hypothetical Additional Revenue Over the 2027-2036 Budget Window* (in trillions) |
| 1 | 2000 | 20.0% | 4.0% | $9.3 |
| 2 | 1998 | 19.3% | 4.6% | $6.4 |
| 3 | 1999 | 19.3% | 4.3% | $6.4 |
| 4 | 2022 | 19.2% | 3.8% | $5.9 |
| 5 | 2001 | 19.1% | 4.3% | $5.8 |
| 6 | 1981 | 19.1% | 7.4% | $5.8 |
| 7 | 1969 | 19.1% | 3.4% | $5.6 |
| 8 | 1997 | 18.7% | 5.1% | $4.1 |
| 9 | 1982 | 18.6% | 9.1% | $3.9 |
| 10 | 1980 | 18.5% | 6.8% | $3.4 |
| 11 | 1970 | 18.4% | 4.0% | $3.0 |
| 12 | 1996 | 18.3% | 5.5% | $2.4 |
| 13 | 1979 | 18.1% | 5.8% | $1.6 |
| 14 | 2007 | 18.0% | 4.5% | $ 1.1 |
| 15 | 1987 | 17.9% | 6.4% | $1.0 |
| 48 | 2026 | 16.7% | 4.2% | N/A |
*Additional revenue is calculated by raising each year in the 2027-2036 CBO baseline to match the historical year’s revenue level Source: CBPP calculations of CBO data | ||||
The demographic reality undergirding these trends is obvious: in the mid-1990s, members of the baby boom generation (those born between 1946 and 1964) were in their “prime working years”; today, they are in their “prime retirement years,” now that even the youngest baby boomers are becoming eligible for Social Security and soon for Medicare. In 1995, 12.7 percent of the U.S. population was 65 years of age or older; in 2025, the last year for which we have data, some 18.9 percent of the U.S. population was 65 or older. As people live longer, the share of even older populations also has grown: the share of the population over the age of 75 has grown from 5.6 to 8.2 percent, and the share of the population age 80 and older has grown from 3.1 to 4.4 percent.
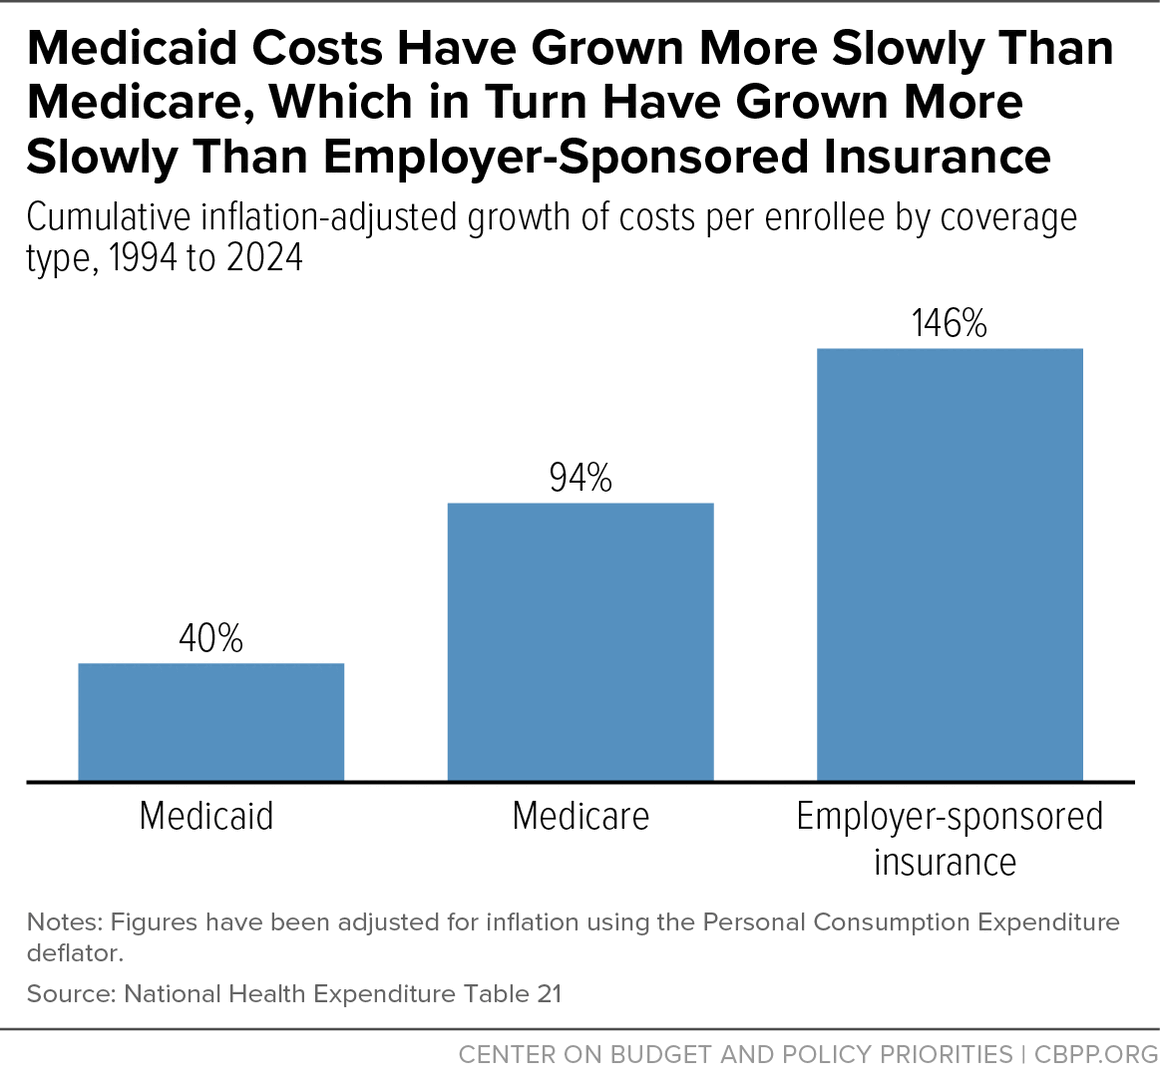
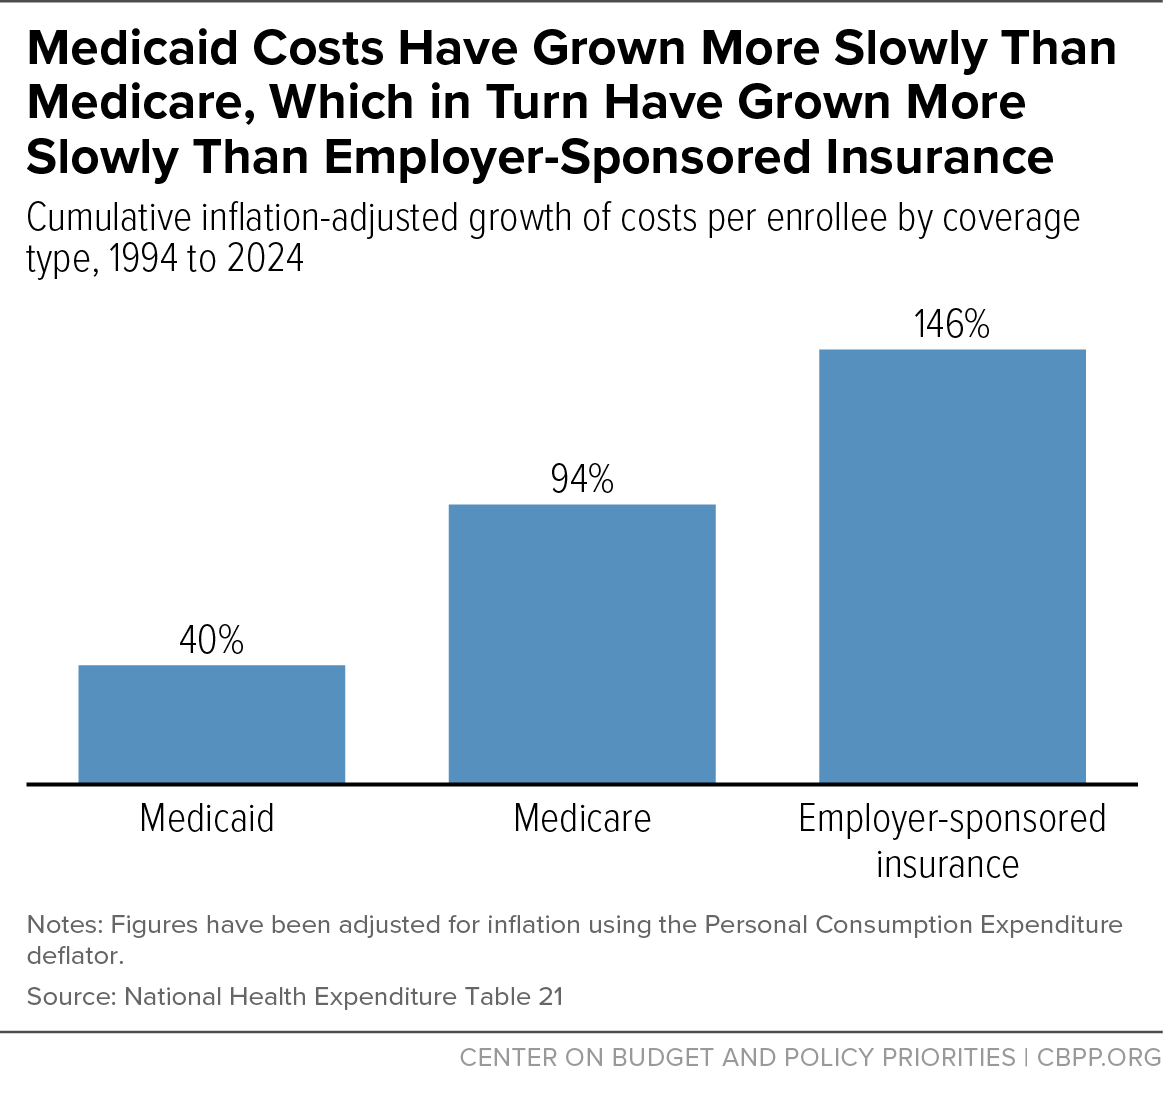
To be sure, Medicaid spending has also risen substantially, from 1.1 percent to 2.2 percent of GDP. Some of this reflects the fact that Medicaid, like Medicare, has been subject to overall health care inflation. But the inflation-adjusted increase in Medicaid costs per enrollee between 1994 and 2024 (40 percent) was much lower than it was for employer-provided insurance (146 percent) and Medicare (94 percent).[23] (See Figure 3.)The increase also reflects higher enrollment: the share of people receiving coverage from Medicaid rose from an average of 12.1 percent between 1993 and 1995 to 17.1 percent in 2025.[24] A big driver of the increased Medicaid enrollment was the expansion in eligibility, effective in 2014, included in the Affordable Care Act — a positive result for people with low incomes who would otherwise be uninsured. The cost of expanding eligibility raised Medicaid spending as a share of the economy, but did not result in a rapid growth rate; CBO projected it would grow by less than 0.2 percent of GDP over the decade even before the cuts from the 2025 Republican reconciliation law.[25]
This population aging and the resulting bump in Social Security and Medicare spending was both predictable and predicted — the question was whether the federal government should let revenue rise above its historical percent of GDP to finance these long-expected costs or, instead, cut the retirement and health programs that would cause federal spending to rise.
Importantly, doing nothing would have kept the overall fiscal deficits and debt in check, given that revenue began to exceed its historic average as a percent of GDP in the late 1990s, and CBO projected that it would continue to rise further.
Much of this projected increase in revenue as a percent of GDP was a result of “real bracket creep,” meaning the projections assumed that a rise in inflation-adjusted incomes from a growing economy would put more income in higher tax brackets (which are adjusted for inflation), generating more federal revenue.[26],[27] Families would still see rising after-tax incomes, since the increase in their tax payments from higher tax brackets would only be a fraction of their real income gains. And the federal budget would be, likewise, financially better off and so better able to sustain, or even improve, the important investments and protections it provides.
The aging of the population and its upward pressure on federal spending were well understood in the late 1990s and included in CBO projections, but the projected increase in revenue was even larger — this caused CBO to initially project persistent surpluses that would lead the U.S. to pay off its debt. Letting the increase in revenue as a share of the economy from real economic growth address the added costs of population aging would have been an elegant solution to our long-term fiscal outlook. It would not have required proactive tax increases or spending cuts (though Congress would still have needed to rebalance the mix of payroll and income taxes to keep the Social Security and Medicare trust funds solvent).
Instead, policymakers took actions that made our fiscal outlook unsustainable — large temporary tax cuts were enacted under President George W. Bush and later most were made permanent under President Barack Obama. And then, still more temporary tax cuts were enacted during the first Trump Administration. Those Trump tax cuts that were scheduled to expire were permanently extended in the July 2025 reconciliation law, and yet more temporary tax cuts were added on top.
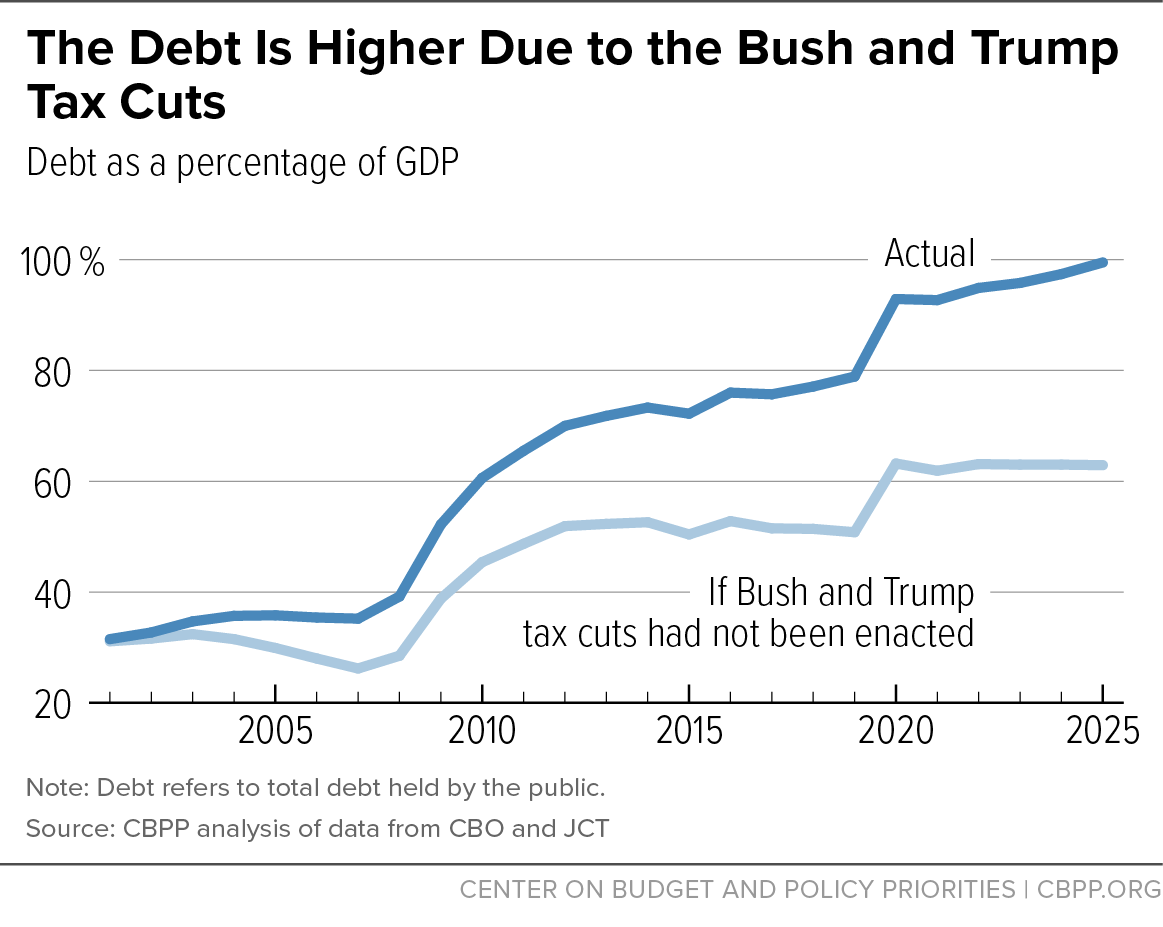
We estimate that if the Bush tax cuts and their extensions and the 2017 Trump tax cuts had not been enacted, the deficit would be $540 billion, or less than one-third the current deficit ($2 trillion). (See Figure 4.) The ratio of debt held by the public would be considerably lower as well — 63 percent of GDP in 2025, compared to the actual 99 percent — despite subsequent temporary events that pushed up the level of debt including the Great Recession and the COVID-19 pandemic. Most importantly, the debt would not be on a continually upward trajectory, as it is now.

The question now is how much of the U.S. fiscal imbalance should be addressed through proactive tax increases and how much should be addressed through proactive cuts to the public services the federal government provides.
The U.S. Faces a Substantial Investment Deficit, Complicating Efforts to Reduce the Fiscal Deficit
A key consideration for policymakers who want to address our fiscal deficit is not to worsen our investment deficit. We already don’t do enough to support economic security, scientific and medical research, education, and other areas that strengthen our economy and benefit everyone in our nation. We should increase investment in these areas where it makes sense.
For example, federal spending on non-defense research (such as medical and energy research) as a share of the economy has been stuck around 0.3 percent of GDP since 2014. That is below its average in the 1960s (0.7 percent), 1970s (0.6 percent), 1980s (0.4 percent), and 1990s (0.4 percent).[28] The returns on federal investment in this area are so strong that CBO finds $1 of additional investment will increase the present value of GDP by $2 to $5, even if it is deficit financed (though this is not sufficient to “pay for itself” through the resulting higher revenue collections).[29]
One area of particular underinvestment as a nation is economic security programs. We spend less than other advanced economies on programs that ensure people with low and moderate incomes have adequate food, housing, and other essentials. This means that addressing our fiscal outlook by cutting these already insufficient programs will result in higher poverty and hardship.
The U.S. spends 2.7 percent of its economy on economic security programs outside of retirement, which is less than half the OECD average (6.0 percent).[30] (See Figure 5.) This OECD category includes disability benefits, child care and family benefits, unemployment benefits, housing, and other benefits (we will cover public health spending below) at the federal, state, and local levels. This low percentage puts us near the bottom (35 out of 38) among OECD countries, sitting only above Costa Rica, Mexico, and Türkiye. It is well below the other highest income countries, including Australia (8.8 percent), the U.K. (6.4 percent), Germany (6.3 percent), Switzerland (6.1 percent), and Canada (6.0 percent).
This is an important category of investment because these supports help working-age people and their children afford the basics when someone is between jobs or is working a low-paying job. The very low U.S. benefit level reflects a unique hole in the U.S. social contract — a hole that got larger with the deep cuts in food assistance enacted in the 2025 reconciliation law.[31]
A predictable result of this lack of public economic security spending is that people with incomes at the bottom of the distribution in the U.S. have incomes similar to — or even lower than — people in other major advanced economies, despite living in a country where the average and median income is much higher. (See textbox, ”The U.S. Is a Rich Country but People With the Lowest Incomes Do Not Share in Its Prosperity.”) People of color are overrepresented among people with incomes at the lower end of both income and wealth distributions due to historical and continuing racial discrimination, which has locked people out of opportunities for economic prosperity through education, employment, housing, and more.
There are many other reasons for the relatively low incomes of U.S. households with incomes in the bottom of the distribution, including the structure of our labor market institutions, such as the low share of workers covered by a collective bargaining agreement.[32] But the underinvestment in economic security programs that reduce poverty and hardship in other rich countries is a key one. In particular, we provide much smaller supports to families with children and to adults who are between jobs. Paid parental leave and a cash child benefit are not fully available to families with low incomes, and in some cases, are totally unavailable. And our unemployment insurance system provides benefits to a small share of those who are looking for work, provides low benefits, and provides benefits for less time than in many other wealthy nations.[33]
The U.S. investment deficit is particularly complicated when it comes to health care. Total U.S. spending on health care (combined public and private) substantially exceeds the OECD average (17.2 percent of GDP compared to 9.3 percent).[34] Even just public spending on health care (8.4 percent of GDP) is the fourth highest in the OECD and is higher than in countries where health care is financed exclusively or almost exclusively by the government, including the U.K. (8.0 percent) and Canada (7.8 percent).[35] Nevertheless, the U.S. health care system also uniquely excludes a large fraction of people from health insurance among wealthy countries: the OECD average uninsured rate is just 2 percent, with all of the rich countries mentioned above reporting an uninsured rate of 0 percent.[36] Among the 38 OECD countries, the U.S. uninsured rate of 8 percent is smaller only than Mexico’s (22 percent). CBO projects it will grow to over 10 percent over the next decade, reflecting congressional Republicans’ refusal to extend enhancements to the Affordable Care Act’s premium tax credits and the cuts to health care included in the 2025 Republican reconciliation law.[37]
The reason we call these policies “investments” is that they have a proven track record of improving people’s lives in the short term and paying off in the long term. For example, research has shown that Medicaid saves lives. One study estimates that the Medicaid expansion included in the Affordable Care Act saved over 27,000 lives between 2010 and 2022, while the decision of some states to refuse the ACA expansion cost almost 13,000 lives.[38]
In particular, investing in children in families with low incomes has enormous payoffs in improving their longer-term educational, health, and employment outcomes. A 2019 report by the National Academy of Sciences, for example, found that stronger income assistance for children with low incomes — through policies such as the Child Tax Credit and food assistance through SNAP — was linked with healthier birthweights, better childhood nutrition, higher school enrollment, higher reading and math test scores, higher high school graduation rates, less alcohol and drug use, and higher rates of college entry.[39]
And there are, of course, other important areas of investment in the federal budget, such as medical and scientific research, education, and infrastructure, that can improve quality of life for everyone in our nation in the long term. For example, a 10 percent reduction in National Institutes of Health funding will result in 20 fewer new, beneficial drugs in the long run, according to the Congressional Budget Office.[40]
Additional Revenue Is the Key to Addressing Both Fiscal and Investment Deficits Without Making Either One Worse
The key goal for policymakers is to address both our fiscal and investment deficits instead of addressing one by exacerbating the other. And there is no magical way to address both deficits: we will have to raise revenue to solve both challenges.
Making our fiscal trajectory sustainable to avoid the harms of higher interest rates and higher interest costs would be counterproductive if it came from taking away food assistance and health care coverage from people who need it, cutting investments in public schools or college access, or retreating on our investments in life-saving medical care or other basic research. Similarly, trillions of dollars in unpaid-for investments in people could be vulnerable to being rolled back later if the costs of financing debt become so great that large-scale deficit reduction becomes necessary. Neither approach is good for the country.
And policymakers should certainly avoid an outcome like the harmful 2025 Republican reconciliation law, which financed expensive and regressive tax cuts with a combination of harmful cuts to food assistance and health care and higher deficits, making both deficits worse.
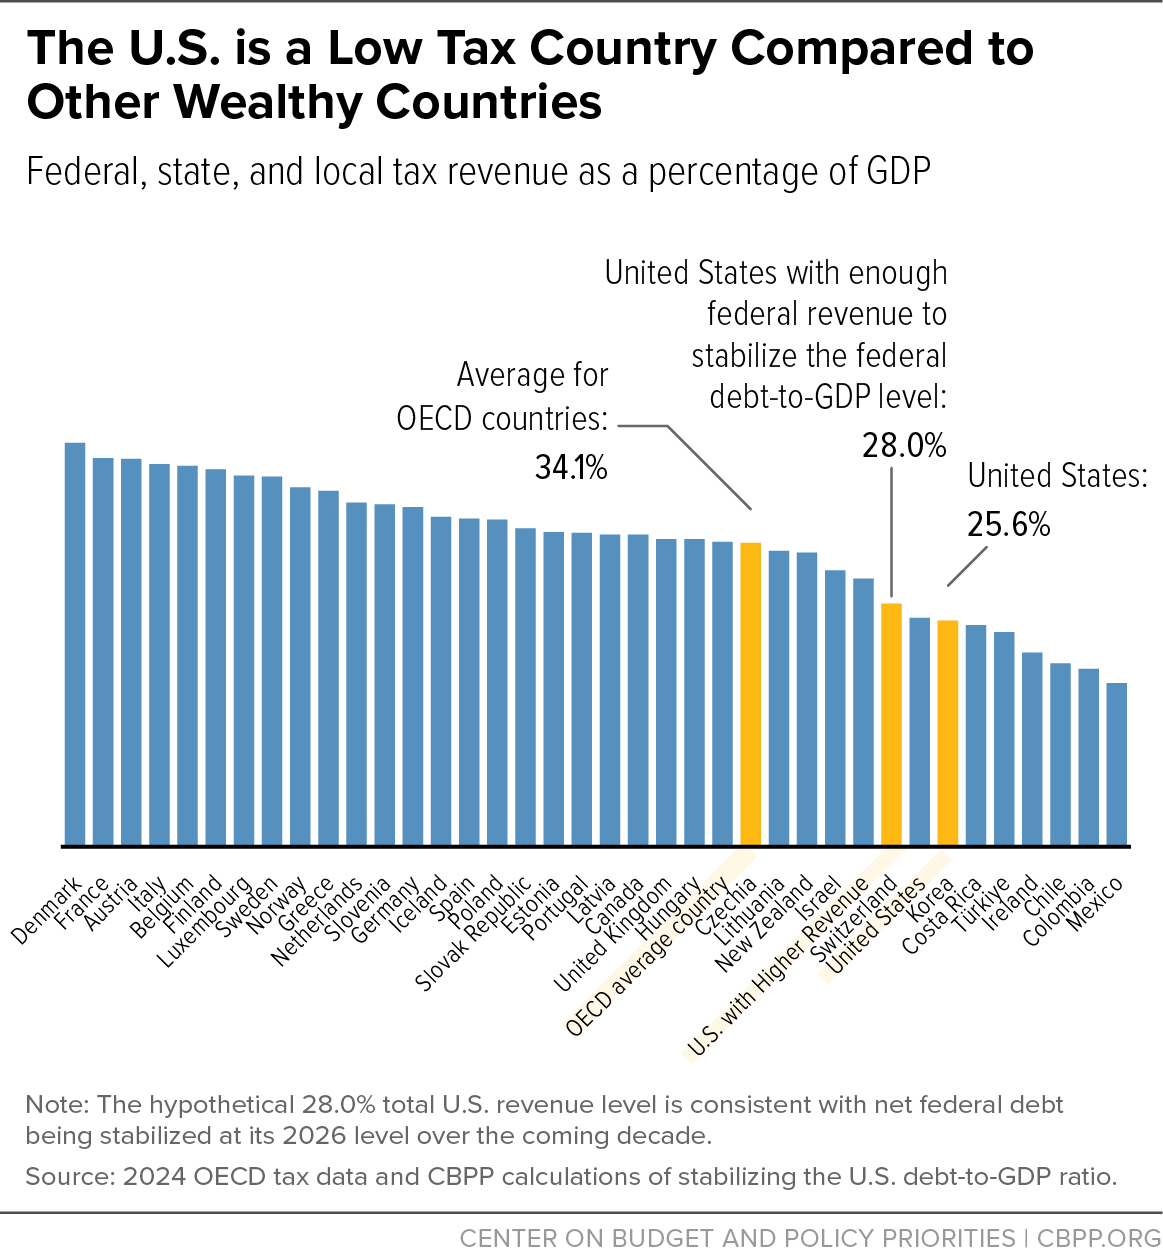
The U.S. has ample ability to raise revenue. U.S. federal, state, and local tax revenue equaled 25.6 percent of the economy in 2024, which is far below the GDP-weighted average of other OECD countries (34 percent).[41] (See Figure 6.) The U.S. tax-to-GDP ratio ranks it 31 among 38 advanced industrial countries in the OECD and far behind Canada (35 percent), Australia (30 percent), Japan (34 percent), and New Zealand (33 percent), and even farther behind France, Italy, Germany, and Spain, just to name a few.[42]
The U.S. could address many of its fiscal and investment needs while still staying well below the revenue-to-GDP ratio of other advanced economies. For example, eliminating the fiscal gap with just revenue by increasing the tax-to-GDP ratio from 25.6 percent to 28.0 percent would move the U.S. above Switzerland from the 31st highest tax OECD country to the 30th, and still keep federal revenue below its 2000 level as a percent of GDP. Moreover, the higher levels of pre-tax inequality in the U.S. relative to OECD countries would allow us to raise a larger share of revenue from the highest-income households than these other countries do.
The main argument against raising revenue is that it will hinder economic growth, but studies addressing this topic have generally found contradictory or inconclusive results.[43] A previous CBPP analysis of more than two dozen economic studies concluded that “the effect of tax increases on growth depends on many different factors, such as the type of tax, the country, the state of the economy, monetary policy, the time frame studied, and what the revenue is used for.”[44]

In other words, the details of how and for what we raise revenue matter. It is beyond the focus of this paper to answer those important questions precisely. But it is important to note that using additional revenue for deficit reduction can be pro-growth. The CBO estimate of extending the 2017 tax law’s individual provisions and the Budget Lab and Penn Wharton analyses of 2025 Republican reconciliation law show that the projected economic benefit of tax cuts was smaller than the projected economic costs of higher debt and interest rates. (See Figure 7.)
It is also important to note that the effect on economic growth is only one dimension of an appropriate cost-benefit analysis of a tax policy.[45] The benefits of past economic growth have not been shared equitably, and focusing on the overall growth rate masks these inequities.[46] Improvements in well-being and opportunity — such as income growth among people with incomes in the bottom half or three-quarters of the income distribution, longer and healthier lives, safer communities, and a healthier environment — may not always show up in aggregate economic statistics.

Significant Deficit Reduction Through Spending Cuts Would be Harmful — and Politically Unpopular
The need for additional revenue becomes even clearer when one walks through the challenges of addressing the fiscal gap by cutting public services, to the detriment of people who rely on them. Social Security benefits are modest, currently averaging $24,000 per year, and make up the largest source of income for most retirees. The public is very supportive of Social Security and proposals to cut benefits significantly are very unpopular.[47] Medicare benefits are already, in some respects, less comprehensive than a typical employer-sponsored health plan and have exhibited more cost growth restraint than private coverage. Leaders of both parties have taken cuts to both programs off the table and, in fact, policymakers on a bipartisan basis increased Social Security for some beneficiaries in late 2024 without paying for those increases.
The scope for savings outside of these programs is also limited. Social Security and Medicare make up almost half (48 percent) of projected federal programmatic spending over the next decade. Security spending — defense, supports for veterans, and homeland security — make up another 22 percent and command largely bipartisan support. It would require reducing spending on the rest of the budget by 41 percent to stabilize the debt-to GDP ratio at its current level if Social Security, Medicare, security spending, and revenue were off the table.
The magnitude of these required spending cuts would be both exceedingly harsh and unrealistic. The harmful 2025 Republican reconciliation law will cut Medicaid by 17 percent and SNAP by 20 percent by the end of the budget window. These cuts will increase poverty and hardship and leave millions more people without health coverage. Those cuts are also highly unpopular. Further cuts to these programs would only compound that harm.
Similarly, President Trump proposed a 7 percent cut to non-defense discretionary spending in his fiscal year 2027 budget, relative to the previous fiscal year. House Republicans have proposed a much smaller 2 percent cut (neither figure is adjusted for inflation). Even the House’s cuts — which include a 10 percent cut to Title I funding for schools and a 20 percent cut to the National Science Foundation — are often unpopular with the public and with many policymakers and unlikely to become law.
There is simply no getting around the basic math: addressing our nation’s twin fiscal and investment deficits will require raising revenue as a percent of the economy above the historical average.
End Notes
[1] Federal Reserve Economic Database, "Unemployment Rate," last accessed September 13, 2026 https://fred.stlouisfed.org/series/UNRATE; Federal Reserve Economic Database, "Market Yield on U.S. Treasury Securities at 5-Year Constant Maturity, Quoted on an Investment Basis," last accessed September 13, 2026, https://fred.stlouisfed.org/series/DGS5.
[2] See, e.g., J. Bradford Delong and Lawrence H. Summers, "Fiscal Policy in a Depressed Economy," Brookings Papers on Economic Activity, Spring 2012, https://www.brookings.edu/wp-content/uploads/2012/03/2012a_DeLong.pdf; Christina D. Romer, "Fiscal Policy in the Crisis: Lessons and Policy Implications," April 16, 2012, https://eml.berkeley.edu/~cromer/Lectures/Lessons%20for%20Fiscal%20Policy.pdf; Olivier Blanchard, "Transcript of a WEO Conference," April 16, 2023, https://www.imf.org/en/news/articles/2015/09/28/04/54/tr041613.
[3] Testimony of Chad Stone, "Policy Prescriptions for the Economy," before the Senate Budget Committee, September 15, 2011, https://www.cbpp.org/testimony-chad-stone-chief-economist-on-policy-prescriptions-for-the-economy
[4] Federal Reserve Economic Database, "Market Yield on U.S. Treasury Securities at 10-Year Constant Maturity, Quoted on an Investment Basis," last updated October 19, 2026, https://fred.stlouisfed.org/series/DGS10. The figure is the average yield for September 2026.
[5] Marijun A. Bolhuis et al., “The Cost of Money is Part of the Cost of Living: New Evidence on the Consumer Sentiment Anomaly,” NBER Working Paper 32163, National Bureau of Economic Research, February 2024, https://www.nber.org/papers/w32163.
[6] The widely reported figure of Japanese debt exceeding 200 percent of GDP is a gross number and netting out the government’s financial assets results in a figure that is similar to or lower than of the U.S. One IMF analysis places Japanese debt at between 89-137 percent of GDP depending on the precise concept. Budget analysts across the political spectrum in the U.S. do not use gross debt, but at the very least net out the Social Security trust fund’s holdings of U.S. Treasuries and those of other trust funds (“debt held by the public”) and sometimes also net out other financial assets like student loans (“debt net of financial assets”). Rahul Anand and Shujaat Khan, "Japan’s Debt Beyond the Headlines," International Monetary Fund, September 2026, https://www.imf.org/en/publications/fandd/issues/2026/09/japans-debt-beyond-the-headlines-anand
[7] Ian Smith, "Japan’s borrowing costs soar to 30-year high on debt fears," Financial Times, July 7, 2026, https://www.ft.com/content/851aa883-073f-4423-a43e-9b09fdbe7c86?syn-25a6b1a6=1.
[8] Ian Smith et al., "Scott Bessent’s yen intervention signals new era of US ‘currency activism," Financial Times, August 4, 2026, https://www.ft.com/content/1be83506-b897-4c26-97cc-445d7354ee6f?syn-25a6b1a6=1
[9] Andre R. Nevy and Jeffrey Shafer, "Revisiting the Relationship Between Debt and Long-Term Interest Rates: Working Paper 2024-05," Congressional Budget Office, December 20, 2024, https://www.cbo.gov/publication/60314.
[10] Jack Salmon, "The Impact of Public Debt on Interest Rates," The Mercatus Center, May 14, 2025, https://www.mercatus.org/research/policy-briefs/impact-public-debt-interest-rates; Ernie Tedeschi, "Deficits are Raising Interest Rates. But Other Factors are Lowering Them," February 19, 2019, https://medium.com/bonothesauro/deficits-are-raising-interest-rates-but-other-factors-are-lowering-them-6d1e68776b7a.
[11] Nevy and Shafer.
[12] Abhi Gupta, "The Impact of Deficits on Costs for Households" Yale Budget Lab, March 9, 2026, https://budgetlab.yale.edu/research/impact-deficits-costs-households.
[13] Nathaniel Drake, "What Determines the Rate on a 30-Year Mortgage?," Fannie Mae, December 11, 2024, https://www.fanniemae.com/research-and-insights/publications/housing-insights/rate-30-year-mortgage.
[14] Gupta.
[15] Congressional Budget Office (CBO), "How the Expiring Individual Income Tax Provisions in the 2017 Tax Act Affect CBO’s Economic Forecast," December 2024, https://www.cbo.gov/system/files/2024-12/60986-Expiring-Provisions-2017-Tax-Act.pdf.
[16] Budget Lab, “Long-term Impacts of the One Big Beautiful Bill Act, as Enacted on July 4, 2025,” July 30, 2025, https://budgetlab.yale.edu/research/long-term-impacts-one-big-beautiful-bill-act-enacted-july-4-2025; Penn Wharton Budget Model, "President Trump-Signed Reconciliation Bill: Budget, Economic, and Distributional Effects," July 8, 2025, https://budgetmodel.wharton.upenn.edu/issues/2025/7/8/president-trump-signed-reconciliation-bill-budget-economic-and-distributional-effects.
[17] Ben S. Bernanke and Mark Gertler, "Inside the Black Box: The Credit Channel of Monetary Policy Transmission," Journal of Economic Perspective, Vol. 9, No. 4, 1995, https://www.jstor.org/stable/2138389; Justin Bloesh and Jacob P. Weber, "Structural Changes in Investment and the Waning Power of Monetary Policy," New York Federal Reserve No. 1990, March 2026, https://www.newyorkfed.org/medialibrary/media/research/staff_reports/sr1190.pdf; Nitish Sinha and Michael Smolyansky, "How sensitive is the economy to large interest rate increases? Evidence from the taper tantrum," Federal Reserve Board Finance and Economics Discussion Series, December 2022, https://www.federalreserve.gov/econres/feds/files/2022085pap.pdf; Claudio Raddatz and Roberto Rigobon, "Monetary Policy and Sectoral Shocks: Did the FED react properly to the High-Tech Crisis?," NBER Working Paper 9835, National Bureau of Economic Research, July 2003, https://www.nber.org/papers/w9835.
[18] CBO, "The Outlook for Housing Starts," September 2024, https://www.cbo.gov/publication/60727.
[19] CBO, "The Long-Term Budget Outlook: 2025 to 2055," March 2025, https://www.cbo.gov/publication/61270.
[20] CBO, March 2025.
[21] Brendan Duke, "Republican Megabill Trades Essential Support to Low-Income People for Skewed Tax Cuts," CBPP, February 11, 2026, https://www.cbpp.org/research/federal-tax/republican-megabill-trades-essential-support-to-low-income-people-for-skewed.
[22] Importantly, the 1993-1995 period is mostly representative of the 30 years. The 1962-1995 average had revenue at 17.5 percent of GDP and programmatic spending at 18 percent.
[23] Centers on Medicare and Medicaid Service, National Health Expenditure Tables, Table 21 Expenditures, Enrollment and Per Enrollee Estimates of Health Insurance: United States, Calendar Years 1987-2024,” https://www.cms.gov/data-research/statistics-trends-and-reports/national-health-expenditure-data/historical. Figures have been adjusted for inflation using the Personal Consumption Expenditure deflator.
[24] U.S. Census Bureau, Health Insurance Historical Tables – Original Series, Table HI-1, https://www.census.gov/data/tables/time-series/demo/health-insurance/historical-series/original.html and Health Insurance Historical Tables – HHI Series, Table HHI-01, https://www.census.gov/data/tables/time-series/demo/health-insurance/historical-series/hic.html.
[25] CBO, “The Budget and Economic Outlook: 2025 to 2035,” January 2025, https://www.cbo.gov/system/files/2025-01/51118-2025-01-Budget-Projections.xlsx
[26] The term “bracket creep” refers to when tax brackets are not indexed for inflation, so as prices rise, more income is taxed at higher rates even when there is no inflation-adjusted economic growth. The U.S. now indexes its tax brackets for inflation. This leaves “real bracket creep” from inflation-adjusted economic growth as the main force raising revenue as a share of the economy over time.
[27] One reason revenue as a share of GDP was expected to rise dramatically in CBO projections from the late 1990s to 2012 was that the Alternative Minimum Tax (AMT) was not indexed to inflation. CBO projected AMT would recapture growing amounts of revenue as the years passed, purely from inflation. In our analysis, however, we measure projected revenue relative to a hypothetical AMT that had been indexed for inflation (rather than the actual, unindexed AMT), which still shows considerable growth in projected revenue as a share of the economy because of real bracket creep.
[28] U.S. Office of Management and Budget Historical Tables, “Table 9.7 Summary of Outlays for the Conduct of Research and Development: 1949-2027,” https://www.whitehouse.gov/omb/information-resources/budget/historical-tables/.
[29] Sheila Campbell et al., "Estimating the Economic Effects of Federally Funded R&D," Congressional Budget Office Working Paper 2026-08, July 2026, https://www.cbo.gov/system/files/2026-07/62387-Nondefense-Research.pdf. See also, Chuck Marr and Josephine Cureton, “Administration’s Proposed Cuts to Non-Defense R&D Pose Long-Term Risk to Rising Living Standards,” CBPP, October 6, 2025, https://www.cbpp.org/research/federal-budget/administrations-proposed-cuts-to-non-defense-rd-pose-long-term-risk-to.
[30] Organization for Economic Cooperation and Development (OECD), “Social Expenditure Database,” https://www.oecd.org/en/data/datasets/social-expenditure-database-socx.html. The exact concept is “gross public social spending less old age and survivors and health programs for 2019.”
[31] Overall, 2019 gross U.S. public social spending (18.2 percent of GDP) is not that much lower than the OECD average (20.3 percent), but this is entirely attributable to above average spending on health and retirement programs (15.5 percent) relative to the OECD average (14.2 percent). The U.S. delivers a particularly large amount of its benefits through the tax code, so its net public social spending (23 percent) is higher than the OECD average (20.0 percent). The additional tax benefits carried in the net figure (which does not exist for social spending outside of retirement and health) mostly do not accrue to low-income households. For example, the refundable portions of the Child Tax Credit and Earned Income Tax Credits are carried in the gross figures cited above while the exclusion for employer-sponsored health insurance is not.
[32] Arindrajit Dube, “The Wage Standard: What’s Wrong in the Labor Market and How to Fix It,” Dutton, 2026.
[33] Organization for Economic Cooperation and Development (OECD), “Benefit Reforms for Inclusive Societies in the United States,” May 2023, https://www.oecd.org/en/publications/benefit-reforms-for-inclusive-societies-in-the-united-states_32d8f005-en/full-report/component-7.html.
[34] OECD, "Health at a Glance 2025: OECD Indicators," 2025, https://www.oecd.org/content/dam/oecd/en/publications/reports/2025/11/health-at-a-glance-2025_a894f72e/8f9e3f98-en.pdf.
[35] OECD, “Social Expenditure Database,” https://www.oecd.org/en/data/datasets/social-expenditure-database-socx.html. The exact concept is gross public social spending on health programs for 2019.
[36] OECD, "Health at a Glance 2025: OECD Indicators."
[37] CBO, "Federal Subsidies for Health Insurance, 2026 to 2036," July 23, 2026, https://www.cbo.gov/publication/62539.
[38] Angela Wyse and Bruce Meyer, "Saved by Medicaid: New Evidence on Health Insurance and Mortality from the Universe of Low-Income Adults," National Bureau of Economic Research Working Paper No. 33719, May 2025, https://www.nber.org/papers/w33719.
[39] National Academies of Sciences, Engineering, and Medicine, “A Roadmap to Reducing Child Poverty,” National Academies Press, 2019, https://www.nap.edu/read/25246.
[40] CBO, "Re: How Changes to Funding for the NIH and Changes in the FDA’s Review Times Would Affect the Development of New Drugs," July 18, 2025, https://www.cbo.gov/system/files/2025-07/61373-Drugs.pdf.
[41] Revenue share of GDP data are from 2024 or 2023, depending on availability. GDP weighting is purchasing power parity current dollars from 2024 and excludes the United States. Organization for Economic Co-operation and Development, “Revenue Statistics 2025,” December 9, 2025, https://www.oecd.org/en/publications/2025/12/revenue-statistics-2025_07ca0a8e.html; World Development Indicators, “GDP, PPP (current international $),” https://data.worldbank.org/indicator/NY.GDP.MKTP.PP.CD.
[42] These figures, from OECD, include tax collections by all levels of government; in the United States, that means federal, state, and local governments. They exclude charges for public services and other items that the OECD classifies as non-tax receipts. The data are from https://www.oecd.org/en/publications/revenue-statistics-2023_9d0453d5-en.html.
[43] Republican Study Committee, "Beautiful Bill, Beautiful Future: RSC Gets the Download from Director Hassett," May 21, 2025, https://rsc-pfluger.house.gov/media/press-releases/beautiful-bill-beautiful-future-rsc-gets-download-director-hassett.
[44] Chye-Ching Huang and Nathaniel Frentz, “What Really Is the Evidence on Taxes and Growth?” CBPP, February 18, 2014, https://www.cbpp.org/research/what-really-is-the-evidence-on-taxes-and-growth.
[45] The inadequacy of GDP as a measure of national well-being is the theme of Mismeasuring Our Lives: Why GDP Doesn’t Add Up, by Amartya Sen, Jean Paul Fitoussi, and Joseph Stiglitz, New Press, 2010, https://wcfia.harvard.edu/publications/mismeasuring-our-lives-why-gdp-doesnt-add.
[46] Austen Clemens, “GDP 2.0: Measuring who prospers when the U.S. economy grows,” Washington Center for Equitable Growth, July 11, 2023, https://equitablegrowth.org/gdp-2-0-measuring-who-prospers-when-the-u-s-economy-grows/. The analysis points out that growth has increasingly been tilted toward the rich, making aggregate GDP growth a misleading way of measuring the effect of growth on the entire income distribution.
[47] National Academy of Social Insurance, “Social Security at 90: A Bipartisan Roadmap for the Program’s Future,” January 2025, https://www.nasi.org/wp-content/uploads/2025/01/NASI_SocialSecurityat90.pdf.