Deficit Reduction Deal Without Substantial New Revenues Would Almost Certainly Force Deep Cuts in Housing Assistance
The figures in Tables 1a and 1b showing the estimated effects of sequestration on housing assistance and community development programs have been updated and posted here: https://www.cbpp.org/cms/index.cfm?fa=view&id=3892
Any major legislation to reduce federal budget deficits that does not include substantial new revenues would almost certainly require deep cuts in programs that serve low-income families, including housing and community development programs. Such cuts would come on top of the ten-year spending cuts that President Obama and Congress enacted last year — and they could be far deeper than the across-the-board cuts (“sequester”) that are scheduled to take effect in early January unless policymakers overturn them.
In last year’s Budget Control Act (BCA), the President and Congress set binding “caps” on total funding (or “budget authority”) for discretionary programs in each fiscal year from 2012 to 2021.[1] The caps, coming on top of the spending cuts that policymakers enacted in annual appropriations bills beginning in fiscal year 2011, will cut discretionary funding by a total of $1.5 trillion over ten years, thereby shrinking non-defense discretionary spending to its lowest level on record as a share of Gross Domestic Product (GDP) in data that go back to 1962.[2] The caps have already forced substantial reductions in housing and community development assistance (see Figure 2 below), and they will likely put intense pressure on the budget of the federal Department of Housing and Urban Development (HUD) over the next decade. If the HUD budget fell in proportion to the BCA caps, that would mean a $2.5 billion annual funding cut by 2021, which is equivalent to eliminating housing voucher assistance for more than 300,000 low-income families, or to reducing funding for the three large block grants — CDBG, HOME, and the Native American Housing Block Grant — by 55 percent.
Policymakers agree, however, that they must do much more than implement these funding caps to address projected long-term deficits and debt. Consequently, they included in the BCA a mechanism — known as “sequestration” — to compel themselves to agree on further steps to reduce deficits. Sequestration requires more than $1 trillion in additional spending reductions for defense and non-defense discretionary programs over the decade, beginning with across-the-board cuts in January 2013. In part because the scheduled cuts are harsh, indiscriminate, and unpopular, the President and Congress will try, in the coming weeks, to hammer out a framework under which to replace these cuts with a more balanced and comprehensive package of spending cuts and tax increases.
To understand what’s at stake for housing assistance and community development programs, consider that policymakers broadly agree that, as part of their deficit reduction efforts, they should largely or entirely avoid cuts in Social Security benefits for current retirees and limit or avoid them for current Medicare beneficiaries. Also, many lawmakers oppose cutting defense funding below the BCA caps. If, however, policymakers limit their deficit reduction efforts in this way, then they must achieve the lion’s share of their savings from three remaining major areas of the budget: non-defense discretionary spending — which comprises just one-sixth of spending and has already taken sizeable cuts under the BCA caps — low-income entitlement programs such as Medicaid and SNAP (food stamps) and revenues.
If, then, forthcoming deficit reduction does not include significant new revenues, it almost certainly will force very deep cuts in low-income programs (whether entitlements or low-income programs that are funded through non-defense discretionary spending) — and there is no reason to expect housing assistance and community development programs to avoid such cuts. Indeed, these cuts could be much deeper than those required under sequestration.
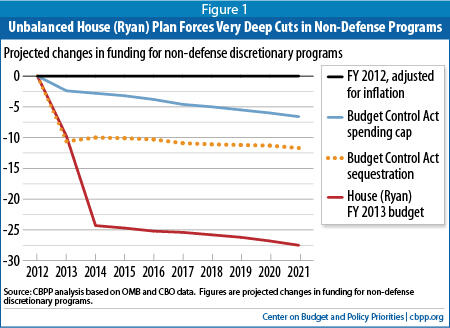
The House-passed budget of Budget Committee Chairman Paul Ryan illustrates the consequences of a deficit reduction approach that forgoes new revenues. Under the Ryan budget, non-defense discretionary funding would fall by 24 percent in 2014 and 28 percent by 2021, compared to the 2012 level as adjusted for inflation. These cuts are more than twice as deep as the cuts required by sequestration, and more than four times as deep as those under the BCA caps (see Figure 1).
The cuts required by the Ryan budget would prove devastating to low-income families and communities. If all non-defense discretionary programs were cut by the same percentage, as many as 1.2 million households containing low-income seniors, people with disabilities, and families with children would lose federal rental assistance by 2021, and communities would lose more than $1.3 billion in funds for affordable housing and economic development. (See Tables 1 and 2 of the appendix for state-by-state estimates of the cuts in housing and community development programs under the BCA spending caps, sequestration, and the Ryan budget.)[3]
Congress Has Already Made Deep Cuts in Housing and Community Development Aid
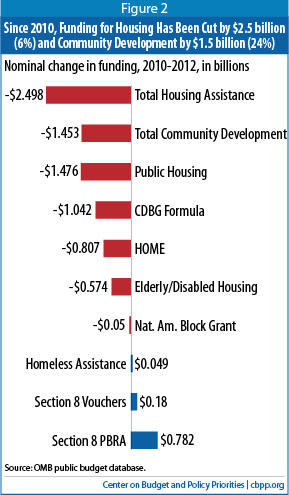
Figure 2 shows the impact to date on housing assistance and community development programs. From 2010 to 2012, funding for housing assistance fell by $2.5 billion, or 5.9 percent just in “nominal terms” — i.e., not counting the additional losses due to the effects of inflation — while funds for community development programs fell by $1.5 billion, or 24 percent.[5] Policymakers cut funds for public housing and housing and community development block grant programs most sharply.
To its credit, Congress mitigated the immediate effect of these cuts on low-income families in two ways. First, lawmakers targeted a larger share of resources to areas where they are needed to prevent the end of rental assistance to the low-income households that now receive it, such as by renewing Housing Choice vouchers and Section 8 project-based rental assistance (see Figure 2). Second, lawmakers cut the price tag of HUD’s fiscal 2012 budget by $1.8 billion through one-time savings measures in housing assistance programs — including the rescission of more than $400 million in unused funds and requirements that housing agencies spend down $1.4 billion in funding reserves in lieu of receiving new funding to cover the cost of operating public housing and renewing housing vouchers for low-income families.
While these measures helped to protect low-income families from immediate harm from budget cuts, policymakers for the most part cannot repeat them in future years. As a result, policymakers would need to allocate significant new funding just to sustain current program service levels. If policymakers do not do so, HUD and housing agencies will have no choice but to substantially reduce the number of low-income families that they assist.
The BCA Caps Will Continue to Put Great Pressure on Housing and Community Development Programs in Future Years
Under the BCA caps, nominal funding for non-defense discretionary programs will rise modestly from fiscal years 2013 through 2021, but by less than CBO’s projected rate of inflation. Thus, funding will continue to shrink in real (inflation-adjusted) terms. (See Figure 1.)
A real cut in non-defense discretionary spending will likely put serious pressure on HUD’s budget over the coming decade, forcing the President and Congress to make tough decisions from a menu of poor options.[6] By fiscal year 2021, the caps for non-defense discretionary programs fall 6.6 percent below the enacted 2012 funding level, adjusted for inflation. If HUD’s budget fell proportionally, that would mean a $2.5 billion annual funding cut by 2021, which is equivalent to eliminating housing voucher assistance for more than 300,000 low-income families, or to reducing funding for the three large block grants –CDBG, HOME, and the Native American Housing Block Grant – by 55 percent.
Moreover, these figures probably understate the potential impact on low-income families and communities. First, they assume that the cost of renewing HUD rental assistance for the more than 4.6 million households that now receive it will grow at the expected general rate of inflation. These programs rely largely on private market rental housing, however, where rents and utility costs have grown somewhat more than the general inflation rate over the past two decades. If these trends continue, the number of households losing rental assistance under the funding cuts described above would be greater than these estimates suggest. If one assumes that rental assistance renewal costs will continue to grow at a rate consistent with recent history, for example, the HUD budget shortfall would grow to $4.5 billion by 2021, which is equivalent to eliminating housing voucher assistance for well over 500,000 low-income families.
Second, no funds would be available to address the roughly $26 billion backlog in capital repairs required to maintain public housing in good condition. Current funding levels are insufficient to address these needs; indeed, the backlog of capital repair needs will likely grow under current funding levels. If these repairs are not made, public housing residents — most of whom are elderly or disabled — will have to live in deteriorating conditions, and hundreds of thousands of affordable apartments likely will eventually be lost to disrepair. Unless policymakers can devise a strategy to address these needs that relies less on appropriated funds, therefore, a large loss of public housing assistance will likely compound the problems outlined above.
Finally, as noted above, one-time savings measures absorbed $1.8 billion in funding cuts in HUD’s 2012 budget, and policymakers for the most part cannot repeat these savings. If the President and Congress do not provide new funding in future years to offset these one-time funding cuts, then the impact of the BCA caps on low-income families will be much more severe, sharply increasing, for example, the number of families losing rental assistance.[7]
Four Keys to Sustaining Housing and Community Development Aid Under the BCA Spending Caps
HUD’s budget thus faces serious challenges under the BCA caps, although the outcome is not written in stone. The pressure on HUD could ease somewhat if rental assistance renewal costs grow at a somewhat lower rate than our analysis assumes. For instance, no cuts in rental assistance or other programs would be required under our analysis if rental assistance costs grow at a rate that’s somewhat below the projected overall rate of inflation.
In addition, policymakers can, and should, take important steps to avoid deep cuts in assistance for low-income families and communities:
- Prioritize low-income programs in making discretionary funding decisions, including by passing a HUD funding bill for fiscal year 2013 that’s modeled on the Senate appropriations bill that covers HUD. The Senate HUD funding bill, which the Senate Appropriations Committee approved in April, has weaknesses, but it also has many strengths and it improves on the President’s budget request. Senate appropriators wrote the bill within a framework that adheres to the BCA caps, prioritizes scarce resources to avert cuts in the number of families receiving rental assistance, provides modest funding increases for other priorities such as assistance for homeless individuals and families, and avoids one-time budget savings or gimmicks that would exacerbate the budget challenge in future years.[8]
- Pass comprehensive rental assistance reform legislation, such as the Affordable Housing and Self-Sufficiency Act (AHSSIA). This legislation, the most recent version of which was circulated in April by the House Financial Services Committee’s Republican leadership, would streamline the major rental assistance programs, cut the costs of operating these programs, and encourage housing agencies to serve more families within available funds.[9] The Congressional Budget Office (CBO) estimates that, when fully implemented, AHSSIA would reduce funding needs for HUD rental assistance programs by some $700 million per year, not counting additional savings associated with reduced administrative burdens for housing authorities and private owners. In light of the likely gap between HUD funding under the BCA caps and rental assistance renewal costs outlined above, savings of this magnitude would help mitigate the impact of funding cuts on low-income families.
- Embrace public housing reforms that enable agencies to access more private capital to meet capital repair needs. The Obama Administration has proposed to let housing agencies convert public housing properties to “project-based” rental assistance contracts, and Congress approved a limited demonstration of the concept in the 2012 appropriations law. Project-based rental assistance contracts would make it easier for housing agencies to raise private capital to rehabilitate developments and preserve affordable rental housing for the long term. The Administration and Congress should make this option available to more housing agencies by adopting AHSSIA’s expanded demonstration.
- Prevent further cuts in funding for non-defense discretionary programs by adopting a balanced approach to addressing the nation’s remaining fiscal challenges. See the discussion below.
Sequestration Would Cause Hundreds of Thousands of Low-Income Families to Lose Rental Aid, But Alternatives that Lack Substantial New Revenues Would Force Even Deeper Cuts
Along with setting ten-year caps on discretionary spending, the BCA created a Joint Select Committee on Deficit Reduction (the “supercommittee”) to develop legislation to reduce deficits by another $1.2 trillion over ten years, and it created a backup mechanism of annual spending cuts, known as “sequestration,” that would take effect if the supercommittee failed to meet its charge. Because the supercommittee failed, sequestration is scheduled to occur starting in January 2013 and to run through 2021.
Sequestration requires cuts in non-defense discretionary funding in each fiscal year from 2013 to 2021 below the BCA spending caps.[10] Figure 1 shows the effects of these cuts, compared to the cuts under the BCA caps. The first round of sequestration cuts, in January 2013, will apply to every non-exempt program, including nearly every discretionary housing and community development program. (In fiscal years 2014 to 2021, the funding cuts will not occur on an across-the-board basis; that is, the Administration and Congress will have the power to distribute the funding cuts however they wish by making the cuts when they write the annual appropriations bills for these years.)
The Office of Management and Budget recently released estimates showing that funding for non-defense discretionary programs would fall by 8.2 percent under sequestration in January 2013. Table 1 in the appendix shows the estimated effects of a 2013 sequester on housing and community development programs in each state, which would be harsh. For instance, states would lose Housing Choice vouchers for up to 180,000 low-income families, and funding for the three major block grants would fall by $375 million — on top of the $1.9 billion in cuts that policymakers have enacted since 2010. These cuts would grow larger in subsequent years, unless policymakers acted to prevent sequestration from continuing.
Sequestration’s harsh and indiscriminate effects have received much attention, and policymakers face great pressure to prevent it from occurring. If policymakers do so, however, they likely will couple this action with an agreement to cut projected deficits by much more than sequestration would achieve.
Without Revenues, Any Plan to Replace Sequestration Will Force as Deep --- Or Deeper ---Cuts Than Sequestration Itself
Policymakers need to achieve about $2 trillion in additional deficit reduction, on top of that achieved through the BCA caps (for a total of nearly $4 trillion including the BCA savings) in order to “stabilize” the federal debt over the next decade so it does not continue to grow as a share of the economy and, thus, risk serious financial and economic problems.[11] Moreover, as noted above, many policymakers argue that Social Security, Medicare, and defense should contribute little (or nothing) to the effort. If policymakers largely avoid those spending categories, they will need to include very substantial new revenues in their deficit reduction package to prevent very deep cuts to low-income programs, including housing and community development assistance.
The House-passed Ryan budget illustrates the point. It includes no new revenues and would impose a massive $5.3 trillion in spending cuts that over ten years. These cuts include severe cuts in non-defense discretionary programs, as well as in Medicaid and food stamps.[12]
Under the Ryan budget, funding for non-defense discretionary programs would fall by 24 percent in 2014 and 28 percent by 2021, compared to the 2012 level as adjusted for inflation. These cuts are more than twice as deep as the cuts that sequestration would require and more than four times as deep as those the BCA caps require (see Figure 2).
Such cuts would almost certainly prove devastating to low-income families in every state, as Table 2 in the Appendix indicates. We estimate, for example, that if all non-defense discretionary programs were reduced by the same percentage, up to 1.2 million low-income families would lose rental assistance by 2021 under the Ryan plan, and communities would lose $1.3 billion for affordable housing and community development and $539 million for homeless assistance. These very deep cuts would come at a time when the number of poor households (particularly families with children) struggling to afford housing and avoid homelessness has been rising markedly. For instance, the latest American Housing Survey reveals that the number of poor renter households paying housing costs of more than 50 percent of their income — a housing cost burden that’s associated with increased risks of homelessness — has risen by 14 percent over the past two years.[13]
Conclusion
Bipartisan deficit reduction commissions — including the Bowles-Simpson commission — have supported the principle that deficit reduction should be crafted so the most vulnerable Americans aren’t made to bear greater hardships than they already do. An important part of sustaining the safety net for individuals and families is preventing further cuts to housing assistance and community development programs.
The risk of sequestration has received much attention in recent months. But the greater risk to housing assistance, community development, and other low-income programs lies in the decisions that the President and Congress will make about how to replace sequestration with a long-term deficit reduction package. Policymakers can avoid even deeper cuts in housing assistance and community development programs than the Budget Control Act makes likely — and preserve more of this critical part of the safety net — only through a balanced approach that includes significant new revenues.
Appendix I: Methods and Sources
Last September, the White House Office of Management and Budget released OMB Sequestration Report Pursuant to the Sequestration Transparency Act of 2012, which provided estimates of the funding reductions required in January 2013 under sequestration for each affected program. We used OMB’s estimates to calculate the potential funding reductions in each state. Our calculations, the results of which are shown in Tables 1a and 1b, assume that state shares of total program funding in 2013 will equal those in 2012. For public housing, state allocations in 2012 were estimated from actual allocations of capital and operating funds in 2011, as reported in Tables 18-28 and 18-30 of Analytical Perspectives, Budget of the United States Government, Fiscal Year 2013. For all other programs, actual 2012 allocations were used, as reported by HUD. For HOPWA, state funding figures are FY 2012 formula allocations; competitive grant awards for FY 2012 would also be reduced under sequestration, but are not included here. Funding figures for Homeless Assistance combine ESG formula allocations for FY 2012 and competitive CoC grants for FY 2011. OMB estimates that funding for Housing Choice Vouchers will be cut by $1.5 billion under sequestration. To estimate the number of families losing voucher assistance under sequestration, each state’s share of the funding cut was assumed to be in proportion to its share of housing assistance payments in 2012, as reported to HUD’s Voucher Management System (VMS). To calculate the number of families potentially affected, the estimated funding cut for each state was divided by the projected average per-voucher cost in that state in 2013, which was also derived from VMS data.
Potential cuts in funding and families served in 2014 and 2021 under the Budget Control Act (BCA) spending caps, sequestration, and the House (Ryan) budget were estimated as follows. The BCA establishes discretionary spending caps in each fiscal year from 2012 to 2021, including separate caps for defense and non-defense programs. Under sequestration, the BCA spending caps for non-defense discretionary programs would be replaced by a series of reduced caps. The House (Ryan) budget also specifies spending limits for non-defense discretionary programs over the same period.
To estimate the impact of the BCA spending caps on non-defense discretionary funding in 2014 and 2021, we compared the caps to the 2012 funding level, adjusted for inflation; the source for the latter was the Congressional Budget Office (CBO) baseline for such programs released in March 2012. Potential cuts under sequestration and the Ryan budget were also estimated in comparison to the CBO March 2012 baseline. These comparisons yielded estimates of the percentage cut in each year under each scenario, which formed the basis of Figure 1 and the figures in Tables 2a – 2g.
To estimate the potential impact of each budget scenario on the HUD budget, we performed two sets of calculations. In the first, we constructed a HUD baseline based on the enacted budget for fiscal year 2012 (net budget authority); figures for fiscal years 2013 to 2021 were then derived using the inflators implicit in the CBO March 2012 baseline for non-defense discretionary programs. Comparisons between the HUD baseline and potential HUD budgets under each of the three scenarios, in which it was assumed that HUD funding would be reduced by the same percentage as funding for non-defense discretionary programs overall, formed the basis of certain figures cited in the report, e.g., that HUD funding would be reduced by $2.5 billion (in 2012 dollars) by 2021 under the BCA spending caps. The resulting percentage cuts to the HUD budget under each scenario were also applied to calculate funding reductions at the program level, under the simplifying assumption that each program would cut by the same percentage as the HUD budget overall. These calculations are the basis of the estimates provided in Tables 2a – 2g.
To estimate potential reductions in the number of families using Housing Choice vouchers, we divided the estimated funding cuts by projected per-voucher costs in each state in 2014 and 2021. For these estimates, we assumed that per-voucher costs would grow at the same rate as the CBO baseline. In effect, we assumed that state and local housing agencies would absorb funding reductions entirely by reducing the number of families receiving housing vouchers. When faced with budget shortfalls, housing agencies may take steps to reduce costs that do not require reducing the number of families assisted. However, most such steps — such as reducing payment standards (that is, reducing the maximum amount of voucher subsidy available to families, thereby requiring them either to pay more out-of-pocket or to move to a lower-cost apartment, if available) — also increase hardships for low-income families. More importantly, such steps are likely to result in limited savings over the longer term, making significant reductions in the number of families served unavoidable.
For public housing and Section 8 project-based rental assistance, it is more difficult to predict the impact of funding cuts with precision. In the short run, funding reductions will not necessarily result in increased hardships for low-income residents or in fewer families being served. Over the long term, however, such consequences are unavoidable. Accordingly, we did not attempt to estimate the number of affordable housing units that would be lost under budget reduction scenarios in 2013 or 2014, but did make such estimates for 2021 (see Table 2c). For the Section 8 project-based rental assistance (PBRA) program, we assumed that the number of assisted units that would be lost in 2021 was proportional to the percentage reduction in funding, e.g., under the House (Ryan) budget plan. If HUD has insufficient funds to cover PBRA rental assistance contracts, then it will be forced either to reduce payment amounts to owners or to stop payment on some share of PBRA contracts. We assume that few owners would accept reduced payments, and owners who are no longer receiving any assistance payments would either raise tenant rents or evict formerly-assisted tenants. The results, shown in Table 2c, are conservative, as the calculations assume that per-unit PBRA costs will grow at the CBO inflation rate, rather than, for instance, at a rate consistent with recent program and market cost trends.
For public housing, we also assumed that the number of housing units lost in 2021 would be in proportion to the real percentage cut in funding. In this case, the estimates probably overstate the impact in 2021, as some housing agencies would continue to fill available units, at least over the short term, even if operating and capital funds were severely inadequate. Over the longer term, however, agencies would be unable to maintain the units in adequate condition, so the primary uncertainty is not the magnitude of the potential loss of units, but the timing of those losses.
The report offers a second set of estimates of the potential impacts on the HUD budget under more realistic cost assumptions for Housing Choice Voucher renewals, the public housing Operating Fund, and the Section 8 project-based rental assistance program. In recent years, per-unit costs in the Section 8 programs have roughly followed the path of the Consumer Price Indices for residential rents and utilities, which, over the past two decades, have grown at a rate about 0.5 percent higher than the general rate of inflation (CPI-U). In this set of calculations, we assumed accordingly that per-unit costs in the two Section 8 programs would grow at the CPI-U rate plus 0.5 percent from 2013 to 2021, using CPI-U projections recently published by CBO. In addition, we assumed that Housing Choice voucher renewal costs would grow an additional 1 percent per year due to the issuance of new “tenant protection” vouchers every year to replace public and private assisted housing that is no longer available. For public housing, we modeled operating costs based on HUD data released with the FY 2013 budget request and inflation factors relevant to the operating funding formula. We also assumed a 1 percent reduction per year in the number of assisted units, which is consistent with recent trends, and offsets in part the 1 percent increase per year for tenant protection vouchers described above. (Note that we assumed no similar offset in the Section 8 project-based rental assistance program, as losses of assisted units, e.g., due to owners exiting the program, are generally offset by an increase in the number of renewal units due to the expiration of original multiyear assistance contracts.) Using these assumptions, we calculated that the HUD budget shortfall would grow to $4.5 billion by 2021 under the BCA spending caps, as cited in the report.
Appendix II: Estimates of State Impacts Under Various Budget Scenarios
This appendix includes two sets of tables showing estimates of state-by-state impacts of various budget scenarios in 2013, 2014, and 2021. The first set (Tables 1a and 1b) show estimates of the effects of sequestration in 2013 on various housing and community development programs. These estimates are based on those released by the White House Office of Management and Budget in September.
The second set includes CBPP estimates of the effects of the BCA spending caps, sequestration, and the House (Ryan) budget in 2014 and 2021. Table 2a shows estimates of the impact on the number of families served by the Housing Choice Voucher program. Tables 2b, 2d, 2e, 2f, and 2g show the estimated dollar impacts on public housing, HOME, homeless assistance grants, Native American Housing Block Grant, and CDBG formula grant programs, respectively. Table 2c provides estimates of the number of households that could lose assistance in 2021 from public housing and the Section 8 project-based rental assistance programs under the BCA caps, sequestration, and the House (Ryan) budget.
The methods and sources used in creating these tables are explained in Appendix I.
| Table 1a Cuts in Housing and Community Development Block Grant Funding Due to Sequestration, 2013 | ||||||
| State | CDBG Formula Grants | HOME | Native American Housing Grants | |||
| 2012 Actual | 2013 Estimated sequestration cut | 2012 Actual | 2013 Estimated sequestration cut | 2012 Actual | 2013 Estimated sequestration cut | |
| Alabama | $39,246,037 | -$3,212,198 | $13,800,040 | -$1,126,890 | $2,015,847 | -$162,463 |
| Alaska | $3,843,406 | -$314,574 | $3,628,693 | -$296,313 | $99,308,089 | -$8,003,538 |
| Arizona | $46,405,177 | -$3,798,157 | $15,226,793 | -$1,243,396 | $74,169,100 | -$5,977,511 |
| Arkansas | $23,433,880 | -$1,918,009 | $9,179,710 | -$749,601 | $0 | $0 |
| California | $351,573,471 | -$28,775,482 | $131,050,655 | -$10,701,390 | $45,859,761 | -$3,695,976 |
| Colorado | $32,933,094 | -$2,695,498 | $12,988,108 | -$1,060,588 | $1,838,640 | -$148,182 |
| Connecticut | $34,325,990 | -$2,809,504 | $11,467,021 | -$936,379 | $76,464 | -$6,162 |
| Delaware | $6,233,818 | -$510,224 | $4,142,103 | -$338,238 | $0 | $0 |
| District of Columbia | $13,904,983 | -$1,138,091 | $4,343,097 | -$354,650 | $0 | $0 |
| Florida | $123,354,155 | -$10,096,255 | $47,858,026 | -$3,908,011 | $1,422,479 | -$114,642 |
| Georgia | $72,331,774 | -$5,920,190 | $25,827,065 | -$2,108,998 | $0 | $0 |
| Hawaii | $12,204,143 | -$998,881 | $5,571,482 | -$454,958 | $0 | $0 |
| Idaho | $10,660,286 | -$872,520 | $3,976,218 | -$324,692 | $4,870,883 | -$392,559 |
| Illinois | $146,421,200 | -$11,984,239 | $43,593,785 | -$3,559,800 | $0 | $0 |
| Indiana | $59,842,592 | -$4,897,979 | $19,506,227 | -$1,592,848 | $1,062,156 | -$85,602 |
| Iowa | $32,857,042 | -$2,689,274 | $8,817,328 | -$720,009 | $1,432,152 | -$115,421 |
| Kansas | $23,399,317 | -$1,915,180 | $8,114,471 | -$662,615 | $1,428,692 | -$115,143 |
| Kentucky | $38,294,674 | -$3,134,331 | $14,055,736 | -$1,147,769 | $0 | $0 |
| Louisiana | $45,354,000 | -$3,712,121 | $14,605,721 | -$1,192,680 | $588,408 | -$47,422 |
| Maine | $16,106,214 | -$1,318,257 | $4,708,728 | -$384,507 | $3,926,247 | -$316,428 |
| Massachusetts | $42,440,741 | -$3,473,677 | $12,899,979 | -$1,053,392 | $0 | $0 |
| Maryland | $88,974,486 | -$7,282,358 | $25,171,557 | -$2,055,470 | $1,128,094 | -$90,916 |
| Michigan | $111,620,816 | -$9,135,908 | $30,838,799 | -$2,518,248 | $12,839,502 | -$1,034,774 |
| Minnesota | $47,038,219 | -$3,849,970 | $13,486,827 | -$1,101,313 | $17,853,406 | -$1,438,860 |
| Mississippi | $27,513,192 | -$2,251,892 | $9,472,960 | -$773,547 | $3,030,375 | -$244,227 |
| Missouri | $56,650,547 | -$4,636,717 | $18,430,106 | -$1,504,973 | $281,587 | -$22,694 |
| Montana | $7,347,866 | -$601,406 | $3,890,397 | -$317,684 | $29,241,598 | -$2,356,668 |
| Nebraska | $16,398,847 | -$1,342,208 | $5,583,112 | -$455,908 | $7,946,793 | -$640,456 |
| Nevada | $17,633,337 | -$1,443,248 | $8,515,508 | -$695,363 | $14,757,408 | -$1,189,344 |
| New Hampshire | $10,831,576 | -$886,540 | $3,782,193 | -$308,848 | $0 | $0 |
| New Jersey | $77,708,633 | -$6,360,273 | $25,676,951 | -$2,096,739 | $0 | $0 |
| New Mexico | $14,165,369 | -$1,159,403 | $5,682,237 | -$464,003 | $74,063,814 | -$5,969,026 |
| New York | $281,664,304 | -$23,053,577 | $100,863,556 | -$8,236,359 | $6,182,289 | -$498,249 |
| North Carolina | $65,385,998 | -$5,351,694 | $25,894,752 | -$2,114,525 | $17,695,091 | -$1,426,101 |
| North Dakota | $4,925,059 | -$403,105 | $3,421,865 | -$279,424 | $11,296,724 | -$910,437 |
| Ohio | $135,321,183 | -$11,075,728 | $40,793,446 | -$3,331,129 | $0 | $0 |
| Oklahoma | $24,942,864 | -$2,041,516 | $11,137,072 | -$909,436 | $95,468,551 | -$7,694,098 |
| Oregon | $30,258,808 | -$2,476,614 | $12,885,177 | -$1,052,183 | $17,026,758 | -$1,372,238 |
| Pennsylvania | $167,973,974 | -$13,748,284 | $42,358,448 | -$3,458,924 | $0 | $0 |
| Rhode Island | $14,662,008 | -$1,200,052 | $5,113,794 | -$417,584 | $561,831 | -$45,280 |
| South Carolina | $32,602,287 | -$2,668,422 | $12,019,586 | -$981,500 | $1,254,641 | -$101,115 |
| South Dakota | $6,552,541 | -$536,310 | $3,373,459 | -$275,471 | $33,118,200 | -$2,669,095 |
| Tennessee | $44,563,668 | -$3,647,434 | $18,163,195 | -$1,483,178 | $168,354 | -$13,568 |
| Texas | $215,435,097 | -$17,632,868 | $67,626,569 | -$5,522,279 | $1,578,424 | -$127,210 |
| Utah | $18,142,062 | -$1,484,886 | $6,312,640 | -$515,480 | $12,617,777 | -$1,016,905 |
| Vermont | $6,837,137 | -$559,604 | $3,340,710 | -$272,797 | $0 | $0 |
| Virginia | $48,666,534 | -$3,983,244 | $18,940,130 | -$1,546,621 | $0 | $0 |
| Washington | $48,830,368 | -$3,996,654 | $19,806,562 | -$1,617,373 | $36,696,288 | -$2,957,464 |
| West Virginia | $19,137,316 | -$1,566,345 | $6,436,376 | -$525,584 | $0 | $0 |
| Wisconsin | $54,535,888 | -$4,463,637 | $18,234,014 | -$1,488,961 | $21,094,136 | -$1,700,040 |
| Wyoming | $3,196,119 | -$261,595 | $3,500,000 | -$285,804 | $3,724,721 | -$300,186 |
| U.S. Territories | $73,983,925 | -$6,055,415 | $18,069,960 | -$1,475,565 | $0 | $0 |
| Total | $2.95 billion | $241 million | $1 billion | $82 million | $658 million | -$53 million |
| Table 1b: Cuts in Federal Rental Assistance Due to Sequestration, 2013 | ||||||||
| State | Housing Choice Vouchers | Public Housing | Homeless Assistance | HOPWA | ||||
| 2012 Number of families assisted | 2013 Estimated number of families cut under sequestration | 2012 Estimated funding | 2013 Estimated funding cut under sequestration | 2012 Actual funding | 2013 Estimated funding cut under sequestration | 2012 Actual funding | 2013 Estimated funding cut under sequestration | |
| Alabama | 29,054 | -2,428 | $192,314,645 | -$15,782,265 | $22,258,870 | -$1,771,307 | $2,001,172 | -$164,096 |
| Alaska | 4,185 | -350 | $12,643,027 | -$1,037,548 | $3,954,161 | -$314,662 | $0 | $0 |
| Arizona | 20,763 | -1,735 | $30,013,500 | -$2,463,052 | $39,593,590 | -$3,150,761 | $2,498,250 | -$204,857 |
| Arkansas | 20,979 | -1,753 | $50,092,324 | -$4,110,817 | $8,492,503 | -$675,813 | $863,949 | -$70,844 |
| California | 306,341 | -25,602 | $204,663,891 | -$16,795,704 | $310,151,984 | -$24,681,139 | $39,343,180 | -$3,226,141 |
| Colorado | 29,571 | -2,471 | $30,077,819 | -$2,468,331 | $23,129,181 | -$1,840,564 | $2,000,579 | -$164,047 |
| Connecticut | 33,767 | -2,822 | $82,070,160 | -$6,735,072 | $35,567,628 | -$2,830,385 | $3,228,628 | -$264,747 |
| Delaware | 4,377 | -366 | $15,508,699 | -$1,272,718 | $6,030,395 | -$479,884 | $843,369 | -$69,156 |
| District of Columbia | 10,212 | -853 | $57,769,751 | -$4,740,864 | $21,953,527 | -$1,747,008 | $13,623,582 | -$1,117,134 |
| Florida | 92,937 | -7,767 | $177,928,052 | -$14,601,632 | $91,233,624 | -$7,260,149 | $39,830,359 | -$3,266,089 |
| Georgia | 52,148 | -4,358 | $211,280,924 | -$17,338,729 | $39,903,382 | -$3,175,414 | $11,003,662 | -$902,300 |
| Hawaii | 9,021 | -754 | $29,090,436 | -$2,387,301 | $12,776,088 | -$1,016,690 | $654,789 | -$53,693 |
| Idaho | 6,772 | -566 | $1,944,346 | -$159,562 | $4,730,200 | -$376,418 | $0 | $0 |
| Illinois | 79,355 | -6,632 | $243,710,732 | -$20,000,075 | $104,140,457 | -$8,287,244 | $7,446,663 | -$610,626 |
| Indiana | 35,952 | -3,005 | $51,090,137 | -$4,192,703 | $25,441,219 | -$2,024,550 | $1,875,715 | -$153,809 |
| Iowa | 21,122 | -1,765 | $10,709,981 | -$878,913 | $11,664,367 | -$928,222 | $409,416 | -$33,572 |
| Kansas | 11,136 | -931 | $43,026,796 | -$3,530,986 | $10,486,035 | -$834,453 | $386,858 | -$31,722 |
| Kentucky | 31,328 | -2,618 | $88,621,136 | -$7,272,677 | $21,975,020 | -$1,748,719 | $1,068,558 | -$87,622 |
| Louisiana | 45,385 | -3,793 | $102,280,230 | -$8,393,608 | $33,035,205 | -$2,628,861 | $7,403,964 | -$607,125 |
| Maine | 12,145 | -1,015 | $122,948,354 | -$10,089,734 | $12,100,762 | -$962,949 | $0 | $0 |
| Maryland | 42,161 | -3,524 | $125,999,160 | -$10,340,097 | $51,896,356 | -$4,129,786 | $10,155,324 | -$832,737 |
| Massachusetts | 75,182 | -6,283 | $190,278,167 | -$15,615,142 | $73,205,748 | -$5,825,535 | $4,024,706 | -$330,026 |
| Michigan | 51,599 | -4,312 | $88,201,324 | -$7,238,225 | $74,116,802 | -$5,898,034 | $3,770,636 | -$309,192 |
| Minnesota | 30,954 | -2,587 | $73,420,995 | -$6,025,280 | $28,506,049 | -$2,268,442 | $1,162,156 | -$95,297 |
| Mississippi | 21,642 | -1,809 | $53,353,470 | -$4,378,443 | $8,438,499 | -$671,515 | $2,125,613 | -$174,300 |
| Missouri | 38,807 | -3,243 | $65,007,376 | -$5,334,818 | $32,588,611 | -$2,593,322 | $3,043,016 | -$249,527 |
| Montana | 5,526 | -462 | $10,224,981 | -$839,111 | $3,465,582 | -$275,783 | $0 | $0 |
| Nebraska | 11,537 | -964 | $22,988,823 | -$1,886,573 | $7,362,608 | -$585,898 | $358,165 | -$29,370 |
| Nevada | 13,699 | -1,145 | $19,424,335 | -$1,594,054 | $10,618,372 | -$844,984 | $1,377,451 | -$112,951 |
| New Hampshire | 9,284 | -776 | $14,583,896 | -$1,196,825 | $7,093,149 | -$564,456 | $0 | $0 |
| New Jersey | 64,014 | -5,350 | $210,842,860 | -$17,302,780 | $46,478,310 | -$3,698,631 | $15,002,866 | -$1,230,235 |
| New Mexico | 12,237 | -1,023 | $16,043,242 | -$1,316,586 | $10,374,008 | -$825,538 | $608,287 | -$49,880 |
| New York | 222,794 | -18,620 | $1,213,291,672 | -$99,568,553 | $215,706,769 | -$17,165,419 | $60,548,848 | -$4,965,006 |
| North Carolina | 54,978 | -4,595 | $182,272,191 | -$14,958,133 | $28,258,057 | -$2,248,707 | $4,262,603 | -$349,533 |
| North Dakota | 6,720 | -562 | $5,062,947 | -$415,490 | $2,476,415 | -$197,067 | $0 | $0 |
| Ohio | 91,563 | -7,652 | $258,699,664 | -$21,230,139 | $92,250,086 | -$7,341,037 | $3,708,886 | -$304,129 |
| Oklahoma | 22,943 | -1,917 | $47,102,360 | -$3,865,446 | $9,370,546 | -$745,685 | $1,114,664 | -$91,402 |
| Oregon | 31,986 | -2,673 | $24,724,567 | -$2,029,017 | $23,137,403 | -$1,841,218 | $1,469,070 | -$120,464 |
| Pennsylvania | 74,813 | -6,252 | $377,768,888 | -$31,001,533 | $102,571,574 | -$8,162,396 | $10,373,339 | -$850,614 |
| Rhode Island | 9,042 | -756 | $42,392,298 | -$3,478,916 | $7,317,618 | -$582,318 | $877,009 | -$71,915 |
| South Carolina | 23,782 | -1,988 | $68,905,628 | -$5,654,727 | $12,439,653 | -$989,917 | $3,916,073 | -$321,118 |
| South Dakota | 5,657 | -473 | $4,144,229 | -$340,095 | $2,261,057 | -$179,929 | $0 | $0 |
| Tennessee | 33,007 | -2,759 | $149,794,579 | -$12,292,864 | $23,681,494 | -$1,884,516 | $3,553,468 | -$291,384 |
| Texas | 148,047 | -12,373 | $243,177,927 | -$19,956,351 | $95,230,049 | -$7,578,175 | $18,050,218 | -$1,480,118 |
| Utah | 10,297 | -861 | $7,022,069 | -$576,265 | $8,956,073 | -$712,702 | $516,074 | -$42,318 |
| Vermont | 6,030 | -504 | $6,795,214 | -$557,648 | $4,350,369 | -$346,192 | $0 | $0 |
| Virginia | 44,050 | -3,681 | $96,232,506 | -$7,897,303 | $27,806,301 | -$2,212,758 | $2,681,436 | -$219,878 |
| Washington | 48,483 | -4,040 | $63,009,141 | -$5,170,833 | $45,638,519 | -$3,631,802 | $2,542,971 | -$208,524 |
| West Virginia | 13,279 | -1,110 | $24,465,553 | -$2,007,761 | $8,027,256 | -$638,789 | $339,564 | -$27,844 |
| Wisconsin | 26,511 | -2,216 | $34,605,354 | -$2,839,882 | $28,388,100 | -$2,259,056 | $1,042,438 | -$85,480 |
| Wyoming | 2,306 | -193 | $2,441,514 | -$200,362 | $669,908 | -$53,310 | $0 | $0 |
| U.S. Territories | 32,791 | -2,740 | $336,788,131 | -$27,638,455 | $29,052,039 | -$2,311,890 | $7,692,426 | -$630,779 |
| Total | 2,142,134 | -179,025 | $5.8 billion | $479 million | $1.96 billion | $156 million | $298,800,000 | -$24,501,600 |
| Table 2a: Estimated Cuts in Housing Choice Vouchers under BCA Caps, Sequestration, House (Ryan) | |||||||
| State | 2012 Number of Families Assisted | 2014 | 2021 | ||||
| BCA cap | BCA sequestration | House (Ryan) | BCA cap | BCA sequestration | House (Ryan) | ||
| Alabama | 29,054 | -827 | -2,896 | -7,047 | -1,921 | -3,407 | -7,993 |
| Alaska | 4,185 | -119 | -417 | -1,015 | -277 | -491 | -1,151 |
| Arizona | 20,763 | -591 | -2,069 | -5,036 | -1,373 | -2,435 | -5,712 |
| Arkansas | 20,979 | -597 | -2,091 | -5,089 | -1,387 | -2,460 | -5,771 |
| California | 306,341 | -8,722 | -30,531 | -74,306 | -20,256 | -35,920 | -84,272 |
| Colorado | 29,571 | -842 | -2,947 | -7,173 | -1,955 | -3,467 | -8,135 |
| Connecticut | 33,767 | -961 | -3,365 | -8,190 | -2,233 | -3,959 | -9,289 |
| Delaware | 4,377 | -125 | -436 | -1,062 | -289 | -513 | -1,204 |
| District of Columbia | 10,212 | -291 | -1,018 | -2,477 | -675 | -1,197 | -2,809 |
| Florida | 92,937 | -2,646 | -9,262 | -22,543 | -6,145 | -10,897 | -25,566 |
| Georgia | 52,148 | -1,485 | -5,197 | -12,649 | -3,448 | -6,115 | -14,346 |
| Hawaii | 9,021 | -257 | -899 | -2,188 | -596 | -1,058 | -2,482 |
| Idaho | 6,772 | -193 | -675 | -1,643 | -448 | -794 | -1,863 |
| Illinois | 79,355 | -2,259 | -7,909 | -19,248 | -5,247 | -9,305 | -21,830 |
| Indiana | 35,952 | -1,024 | -3,583 | -8,721 | -2,377 | -4,216 | -9,890 |
| Iowa | 21,122 | -601 | -2,105 | -5,123 | -1,397 | -2,477 | -5,811 |
| Kansas | 11,136 | -317 | -1,110 | -2,701 | -736 | -1,306 | -3,063 |
| Kentucky | 31,328 | -892 | -3,122 | -7,599 | -2,071 | -3,673 | -8,618 |
| Louisiana | 45,385 | -1,292 | -4,523 | -11,009 | -3,001 | -5,322 | -12,485 |
| Maine | 12,145 | -346 | -1,210 | -2,946 | -803 | -1,424 | -3,341 |
| Maryland | 42,161 | -1,200 | -4,202 | -10,227 | -2,788 | -4,944 | -11,598 |
| Massachusetts | 75,182 | -2,141 | -7,493 | -18,236 | -4,971 | -8,815 | -20,682 |
| Michigan | 51,599 | -1,469 | -5,142 | -12,516 | -3,412 | -6,050 | -14,194 |
| Minnesota | 30,954 | -881 | -3,085 | -7,508 | -2,047 | -3,630 | -8,515 |
| Mississippi | 21,642 | -616 | -2,157 | -5,250 | -1,431 | -2,538 | -5,954 |
| Missouri | 38,807 | -1,105 | -3,868 | -9,413 | -2,566 | -4,550 | -10,676 |
| Montana | 5,526 | -157 | -551 | -1,340 | -365 | -648 | -1,520 |
| Nebraska | 11,537 | -328 | -1,150 | -2,798 | -763 | -1,353 | -3,174 |
| Nevada | 13,699 | -390 | -1,365 | -3,323 | -906 | -1,606 | -3,769 |
| New Hampshire | 9,284 | -264 | -925 | -2,252 | -614 | -1,089 | -2,554 |
| New Jersey | 64,014 | -1,823 | -6,380 | -15,527 | -4,233 | -7,506 | -17,610 |
| New Mexico | 12,237 | -348 | -1,220 | -2,968 | -809 | -1,435 | -3,366 |
| New York | 222,794 | -6,343 | -22,204 | -54,041 | -14,732 | -26,124 | -61,289 |
| North Carolina | 54,978 | -1,565 | -5,479 | -13,336 | -3,635 | -6,447 | -15,124 |
| North Dakota | 6,720 | -191 | -670 | -1,630 | -444 | -788 | -1,849 |
| Ohio | 91,563 | -2,607 | -9,125 | -22,209 | -6,054 | -10,736 | -25,188 |
| Oklahoma | 22,943 | -653 | -2,287 | -5,565 | -1,517 | -2,690 | -6,311 |
| Oregon | 31,986 | -911 | -3,188 | -7,759 | -2,115 | -3,751 | -8,799 |
| Pennsylvania | 74,813 | -2,130 | -7,456 | -18,147 | -4,947 | -8,772 | -20,581 |
| Rhode Island | 9,042 | -257 | -901 | -2,193 | -598 | -1,060 | -2,487 |
| South Carolina | 23,782 | -677 | -2,370 | -5,769 | -1,573 | -2,789 | -6,542 |
| South Dakota | 5,657 | -161 | -564 | -1,372 | -374 | -663 | -1,556 |
| Tennessee | 33,007 | -940 | -3,290 | -8,006 | -2,183 | -3,870 | -9,080 |
| Texas | 148,047 | -4,215 | -14,755 | -35,910 | -9,789 | -17,359 | -40,727 |
| Utah | 10,297 | -293 | -1,026 | -2,498 | -681 | -1,207 | -2,833 |
| Vermont | 6,030 | -172 | -601 | -1,463 | -399 | -707 | -1,659 |
| Virginia | 44,050 | -1,254 | -4,390 | -10,685 | -2,913 | -5,165 | -12,118 |
| Washington | 48,343 | -1,376 | -4,818 | -11,726 | -3,197 | -5,668 | -13,299 |
| West Virginia | 13,279 | -378 | -1,323 | -3,221 | -878 | -1,557 | -3,653 |
| Wisconsin | 26,511 | -755 | -2,642 | -6,431 | -1,753 | -3,109 | -7,293 |
| Wyoming | 2,306 | -66 | -230 | -559 | -152 | -270 | -634 |
| U.S. Territories | 32,791 | -934 | -3,268 | -7,954 | -2,168 | -3,845 | -9,021 |
| Total | 2,142,134 | -60,990 | -213,490 | -519,597 | -141,644 | -251,177 | -589,285 |
| Table 2b: Estimated Cuts in Public Housing under BCA Caps, Sequestration, House (Ryan) | |||||||
| State | 2012 actual | 2014 | 2021 | ||||
| BCA cap | BCA sequestration | House (Ryan) | BCA cap | BCA sequestration | House (Ryan) | ||
| Alabama | $192,314,645 | -$5,475,493 | -$19,166,556 | -$46,647,962 | -$12,716,411 | -$22,549,991 | -$52,904,314 |
| Alaska | $12,643,027 | -$359,966 | -$1,260,036 | -$3,066,701 | -$835,994 | -$1,482,467 | -$3,478,002 |
| Arizona | $30,013,500 | -$854,530 | -$2,991,220 | -$7,280,093 | -$1,984,581 | -$3,519,254 | -$8,256,488 |
| Arkansas | $50,092,324 | -$1,426,205 | -$4,992,326 | -$12,150,426 | -$3,312,252 | -$5,873,611 | -$13,780,022 |
| California | $204,663,891 | -$5,827,095 | -$20,397,312 | -$49,643,402 | -$13,532,980 | -$23,998,011 | -$56,301,499 |
| Colorado | $30,077,819 | -$856,362 | -$2,997,630 | -$7,295,695 | -$1,988,834 | -$3,526,796 | -$8,274,182 |
| Connecticut | $82,070,160 | -$2,336,663 | -$8,179,316 | -$19,906,990 | -$5,426,721 | -$9,623,195 | -$22,576,884 |
| Delaware | $15,508,699 | -$441,556 | -$1,545,635 | -$3,761,800 | -$1,025,481 | -$1,818,484 | -$4,266,327 |
| District of Columbia | $57,769,751 | -$1,644,793 | -$5,757,477 | -$14,012,667 | -$3,819,906 | -$6,773,833 | -$15,892,024 |
| Florida | $177,928,052 | -$5,065,885 | -$17,732,752 | -$43,158,340 | -$11,765,127 | -$20,863,081 | -$48,946,670 |
| Georgia | $211,280,924 | -$6,015,492 | -$21,056,782 | -$51,248,434 | -$13,970,517 | -$24,773,896 | -$58,121,795 |
| Hawaii | $29,090,436 | -$828,249 | -$2,899,225 | -$7,056,194 | -$1,923,545 | -$3,411,020 | -$8,002,560 |
| Idaho | $1,944,346 | -$55,359 | -$193,778 | -$471,622 | -$128,566 | -$227,986 | -$534,875 |
| Illinois | $243,710,732 | -$6,938,819 | -$24,288,818 | -$59,114,629 | -$16,114,872 | -$28,576,476 | -$67,042,991 |
| Indiana | $51,090,137 | -$1,454,615 | -$5,091,770 | -$12,392,456 | -$3,378,230 | -$5,990,611 | -$14,054,513 |
| Iowa | $10,709,981 | -$304,930 | -$1,067,383 | -$2,597,820 | -$708,175 | -$1,255,806 | -$2,946,235 |
| Kansas | $43,026,796 | -$1,225,039 | -$4,288,157 | -$10,436,607 | -$2,845,059 | -$5,045,138 | -$11,836,348 |
| Kentucky | $88,621,136 | -$2,523,180 | -$8,832,203 | -$21,495,999 | -$5,859,891 | -$10,391,335 | -$24,379,009 |
| Louisiana | $102,280,230 | -$2,912,075 | -$10,193,502 | -$24,809,157 | -$6,763,070 | -$11,992,941 | -$28,136,523 |
| Maine | $122,948,354 | -$3,500,528 | -$12,253,339 | -$29,822,430 | -$8,129,708 | -$14,416,397 | -$33,822,168 |
| Maryland | $125,999,160 | -$3,587,390 | -$12,557,390 | -$30,562,436 | -$8,331,436 | -$14,774,122 | -$34,661,422 |
| Massachusetts | $190,278,167 | -$5,417,511 | -$18,963,595 | -$46,153,992 | -$12,581,753 | -$22,311,203 | -$52,344,094 |
| Michigan | $88,201,324 | -$2,511,227 | -$8,790,363 | -$21,394,169 | -$5,832,132 | -$10,342,109 | -$24,263,522 |
| Minnesota | $73,420,995 | -$2,090,408 | -$7,317,319 | -$17,809,043 | -$4,854,813 | -$8,609,031 | -$20,197,564 |
| Mississippi | $53,353,470 | -$1,519,055 | -$5,317,340 | -$12,941,451 | -$3,527,889 | -$6,255,999 | -$14,677,139 |
| Missouri | $65,007,376 | -$1,850,860 | -$6,478,797 | -$15,768,230 | -$4,298,479 | -$7,622,486 | -$17,883,041 |
| Montana | $10,224,981 | -$291,121 | -$1,019,047 | -$2,480,178 | -$676,106 | -$1,198,937 | -$2,812,815 |
| Nebraska | $22,988,823 | -$654,527 | -$2,291,123 | -$5,576,183 | -$1,520,089 | -$2,695,571 | -$6,324,053 |
| Nevada | $19,424,335 | -$553,041 | -$1,935,877 | -$4,711,579 | -$1,284,394 | -$2,277,614 | -$5,343,488 |
| New Hampshire | $14,583,896 | -$415,226 | -$1,453,467 | -$3,537,479 | -$964,330 | -$1,710,045 | -$4,011,920 |
| New Jersey | $210,842,860 | -$6,003,020 | -$21,013,124 | -$51,142,177 | -$13,941,551 | -$24,722,530 | -$58,001,286 |
| New Mexico | $16,043,242 | -$456,776 | -$1,598,909 | -$3,891,459 | -$1,060,826 | -$1,881,162 | -$4,413,375 |
| New York | $1,213,291,672 | -$34,544,276 | -$120,919,665 | -$294,296,793 | -$80,226,422 | -$142,265,383 | -$333,767,422 |
| North Carolina | $182,272,191 | -$5,189,569 | -$18,165,700 | -$44,212,058 | -$12,052,375 | -$21,372,456 | -$50,141,710 |
| North Dakota | $5,062,947 | -$144,150 | -$504,586 | -$1,228,072 | -$334,777 | -$593,660 | -$1,392,779 |
| Ohio | $258,699,664 | -$7,365,577 | -$25,782,652 | -$62,750,354 | -$17,105,984 | -$30,334,014 | -$71,166,334 |
| Oklahoma | $47,102,360 | -$1,341,076 | -$4,694,338 | -$11,425,178 | -$3,114,547 | -$5,523,021 | -$12,957,505 |
| Oregon | $24,724,567 | -$703,946 | -$2,464,112 | -$5,997,207 | -$1,634,861 | -$2,899,097 | -$6,801,543 |
| Pennsylvania | $377,768,888 | -$10,755,660 | -$37,649,387 | -$91,631,860 | -$24,979,192 | -$44,295,561 | -$103,921,382 |
| Rhode Island | $42,392,298 | -$1,206,974 | -$4,224,922 | -$10,282,702 | -$2,803,104 | -$4,970,739 | -$11,661,803 |
| South Carolina | $68,905,628 | -$1,961,849 | -$6,867,306 | -$16,713,793 | -$4,556,243 | -$8,079,579 | -$18,955,420 |
| South Dakota | $4,144,229 | -$117,993 | -$413,024 | -$1,005,227 | -$274,029 | -$485,935 | -$1,140,046 |
| Tennessee | $149,794,579 | -$4,264,882 | -$14,928,900 | -$36,334,267 | -$9,904,859 | -$17,564,270 | -$41,207,363 |
| Texas | $243,177,927 | -$6,923,649 | -$24,235,717 | -$58,985,391 | -$16,079,641 | -$28,514,002 | -$66,896,421 |
| Utah | $7,022,069 | -$199,929 | -$699,837 | -$1,703,277 | -$464,320 | -$823,378 | -$1,931,718 |
| Vermont | $6,795,214 | -$193,470 | -$677,228 | -$1,648,251 | -$449,320 | -$796,778 | -$1,869,312 |
| Virginia | $96,232,506 | -$2,739,887 | -$9,590,771 | -$23,342,217 | -$6,363,177 | -$11,283,811 | -$26,472,839 |
| Washington | $63,009,141 | -$1,793,967 | -$6,279,648 | -$15,283,537 | -$4,166,350 | -$7,388,182 | -$17,333,341 |
| West Virginia | $24,465,553 | -$696,572 | -$2,438,298 | -$5,934,380 | -$1,617,734 | -$2,868,726 | -$6,730,290 |
| Wisconsin | $34,605,354 | -$985,268 | -$3,448,856 | -$8,393,897 | -$2,288,208 | -$4,057,676 | -$9,519,673 |
| Wyoming | $2,441,514 | -$69,514 | -$243,327 | -$592,215 | -$161,440 | -$286,281 | -$671,642 |
| U.S. Territories | $336,788,131 | -$9,588,875 | -$33,565,143 | -$81,691,541 | -$22,269,424 | -$39,490,333 | -$92,647,884 |
| Total | $5.8 billion | -$166 million | -$582 million | -$1.4 billion | -$386 million | -$684 million | -$1.6 billion |
| Table 2c: Estimated Cuts in Public Housing and Section 8 Project-Based Rental Assistance in 2021 under BCA Caps, Sequestration, House (Ryan) | |||||||||
| State | Public Housing | Section 8 Project-Based Rental Assistance | |||||||
| 2012 Number of Units | BCA cap | BCA sequestration | House (Ryan) | 2012 Number of Units | BCA cap | BCA sequestration | House (Ryan) | ||
| Alabama | 39,760 | -2,629 | -4,662 | -10,938 | 16,695 | -1,104 | -1,958 | -4,593 | |
| Alaska | 1,258 | -83 | -148 | -346 | 1,289 | -85 | -151 | -355 | |
| Arizona | 6,526 | -432 | -765 | -1,795 | 8,083 | -534 | -948 | -2,224 | |
| Arkansas | 14,148 | -936 | -1,659 | -3,892 | 10,781 | -713 | -1,264 | -2,966 | |
| California | 37,587 | -2,485 | -4,407 | -10,340 | 101,545 | -6,714 | -11,907 | -27,934 | |
| Colorado | 8,130 | -538 | -953 | -2,237 | 16,165 | -1,069 | -1,895 | -4,447 | |
| Connecticut | 15,718 | -1,039 | -1,843 | -4,324 | 23,673 | -1,565 | -2,776 | -6,512 | |
| Delaware | 2,448 | -162 | -287 | -673 | 4,658 | -308 | -546 | -1,281 | |
| District of Columbia | 8,196 | -542 | -961 | -2,255 | 10,550 | -698 | -1,237 | -2,902 | |
| Florida | 35,057 | -2,318 | -4,111 | -9,644 | 42,273 | -2,795 | -4,957 | -11,629 | |
| Georgia | 42,034 | -2,779 | -4,929 | -11,563 | 27,358 | -1,809 | -3,208 | -7,526 | |
| Hawaii | 5,323 | -352 | -624 | -1,464 | 3,178 | -210 | -373 | -874 | |
| Idaho | 828 | -55 | -97 | -228 | 3,750 | -248 | -440 | -1,032 | |
| Illinois | 54,333 | -3,593 | -6,371 | -14,947 | 61,287 | -4,052 | -7,186 | -16,860 | |
| Indiana | 16,053 | -1,061 | -1,882 | -4,416 | 29,827 | -1,972 | -3,497 | -8,205 | |
| Iowa | 4,035 | -267 | -473 | -1,110 | 12,100 | -800 | -1,419 | -3,329 | |
| Kansas | 9,009 | -596 | -1,056 | -2,478 | 11,568 | -765 | -1,356 | -3,182 | |
| Kentucky | 22,797 | -1,507 | -2,673 | -6,271 | 23,290 | -1,540 | -2,731 | -6,407 | |
| Louisiana | 21,791 | -1,441 | -2,555 | -5,995 | 15,903 | -1,052 | -1,865 | -4,375 | |
| Maine | 4,053 | -268 | -475 | -1,115 | 8,182 | -541 | -959 | -2,251 | |
| Maryland | 19,179 | -1,268 | -2,249 | -5,276 | 24,135 | -1,596 | -2,830 | -6,639 | |
| Massachusetts | 35,403 | -2,341 | -4,151 | -9,739 | 57,401 | -3,796 | -6,731 | -15,791 | |
| Michigan | 23,474 | -1,552 | -2,752 | -6,458 | 54,741 | -3,620 | -6,419 | -15,059 | |
| Minnesota | 20,990 | -1,388 | -2,461 | -5,774 | 30,473 | -2,015 | -3,573 | -8,383 | |
| Mississippi | 13,297 | -879 | -1,559 | -3,658 | 17,262 | -1,141 | -2,024 | -4,749 | |
| Missouri | 17,443 | -1,153 | -2,045 | -4,798 | 25,119 | -1,661 | -2,945 | -6,910 | |
| Montana | 1,994 | -132 | -234 | -549 | 4,292 | -284 | -503 | -1,181 | |
| Nebraska | 7,242 | -479 | -849 | -1,992 | 6,470 | -428 | -759 | -1,780 | |
| Nevada | 3,709 | -245 | -435 | -1,020 | 3,218 | -213 | -377 | -885 | |
| New Hampshire | 4,100 | -271 | -481 | -1,128 | 5,868 | -388 | -688 | -1,614 | |
| New Jersey | 39,681 | -2,624 | -4,653 | -10,916 | 44,219 | -2,924 | -5,185 | -12,164 | |
| New Mexico | 4,468 | -295 | -524 | -1,229 | 5,304 | -351 | -622 | -1,459 | |
| New York | 231,673 | -15,319 | -27,165 | -63,732 | 103,755 | -6,861 | -12,166 | -28,542 | |
| North Carolina | 35,821 | -2,369 | -4,200 | -9,854 | 25,513 | -1,687 | -2,992 | -7,018 | |
| North Dakota | 1,809 | -120 | -212 | -498 | 3,233 | -214 | -379 | -889 | |
| Ohio | 44,942 | -2,972 | -5,270 | -12,363 | 74,086 | -4,899 | -8,687 | -20,381 | |
| Oklahoma | 12,961 | -857 | -1,520 | -3,565 | 13,421 | -887 | -1,574 | -3,692 | |
| Oregon | 5,666 | -375 | -664 | -1,559 | 9,802 | -648 | -1,149 | -2,696 | |
| Pennsylvania | 64,006 | -4,232 | -7,505 | -17,608 | 60,174 | -3,979 | -7,056 | -16,553 | |
| Rhode Island | 9,469 | -626 | -1,110 | -2,605 | 15,517 | -1,026 | -1,819 | -4,269 | |
| South Carolina | 15,154 | -1,002 | -1,777 | -4,169 | 17,992 | -1,190 | -2,110 | -4,949 | |
| South Dakota | 1,647 | -109 | -193 | -453 | 5,445 | -360 | -638 | -1,498 | |
| Tennessee | 34,610 | -2,289 | -4,058 | -9,521 | 31,950 | -2,113 | -3,746 | -8,789 | |
| Texas | 54,530 | -3,606 | -6,394 | -15,001 | 50,918 | -3,367 | -5,970 | -14,007 | |
| Utah | 1,759 | -116 | -206 | -484 | 4,117 | -272 | -483 | -1,133 | |
| Vermont | 1,798 | -119 | -211 | -495 | 3,496 | -231 | -410 | -962 | |
| Virginia | 19,540 | -1,292 | -2,291 | -5,375 | 29,530 | -1,953 | -3,463 | -8,123 | |
| Washington | 14,658 | -969 | -1,719 | -4,032 | 16,010 | -1,059 | -1,877 | -4,404 | |
| West Virginia | 6,507 | -430 | -763 | -1,790 | 10,956 | -724 | -1,285 | -3,014 | |
| Wisconsin | 12,440 | -823 | -1,459 | -3,422 | 31,448 | -2,079 | -3,687 | -8,651 | |
| Wyoming | 714 | -47 | -84 | -196 | 2,216 | -147 | -260 | -610 | |
| U.S. Territories | 59,109 | -3,908 | -6,931 | -16,260 | 20,535 | -1,358 | -2,408 | -5,649 | |
| Total | 1,168,877 | -77,290 | -137,058 | -321,549 | 1,240,771 | -82,043 | -145,487 | -341,327 | |
| Table 2d: Estimated Cuts in HOME Grants under BCA Caps, Sequestration, House (Ryan) | ||||||||
| State | 2012 actual | 2014 | 2021 | |||||
| BCA cap | BCA sequestration | House (Ryan) | BCA cap | BCA sequestration | House (Ryan) | |||
| Alabama | $13,800,040 | -$392,908 | -$1,375,346 | -$3,347,346 | -$912,499 | -$1,618,134 | -$3,796,287 | |
| Alaska | $3,628,693 | -$103,314 | -$361,645 | -$880,178 | -$239,940 | -$425,485 | -$998,226 | |
| Arizona | $15,226,793 | -$433,530 | -$1,517,540 | -$3,693,421 | -$1,006,840 | -$1,785,429 | -$4,188,776 | |
| Arkansas | $9,179,710 | -$261,360 | -$914,873 | -$2,226,636 | -$606,989 | -$1,076,373 | -$2,525,269 | |
| California | $131,050,655 | -$3,731,213 | -$13,060,834 | -$31,787,729 | -$8,665,456 | -$15,366,438 | -$36,051,050 | |
| Colorado | $12,988,108 | -$369,791 | -$1,294,427 | -$3,150,404 | -$858,812 | -$1,522,930 | -$3,572,931 | |
| Connecticut | $11,467,021 | -$326,484 | -$1,142,832 | -$2,781,448 | -$758,233 | -$1,344,574 | -$3,154,491 | |
| Delaware | $4,142,103 | -$117,932 | -$412,812 | -$1,004,711 | -$273,888 | -$485,685 | -$1,139,461 | |
| District of Columbia | $4,343,097 | -$123,655 | -$432,844 | -$1,053,464 | -$287,178 | -$509,253 | -$1,194,753 | |
| Florida | $47,858,026 | -$1,362,591 | -$4,769,650 | -$11,608,473 | -$3,164,514 | -$5,611,627 | -$13,165,383 | |
| Georgia | $25,827,065 | -$735,336 | -$2,573,990 | -$6,264,629 | -$1,707,762 | -$3,028,371 | -$7,104,832 | |
| Hawaii | $5,571,482 | -$158,629 | -$555,268 | -$1,351,422 | -$368,403 | -$653,288 | -$1,532,673 | |
| Idaho | $3,976,218 | -$113,209 | -$396,280 | -$964,474 | -$262,919 | -$466,234 | -$1,093,828 | |
| Illinois | $43,593,785 | -$1,241,182 | -$4,344,665 | -$10,574,136 | -$2,882,550 | -$5,111,620 | -$11,992,323 | |
| Indiana | $19,506,227 | -$555,372 | -$1,944,039 | -$4,731,443 | -$1,289,809 | -$2,287,217 | -$5,366,016 | |
| Iowa | $8,817,328 | -$251,043 | -$878,757 | -$2,138,737 | -$583,028 | -$1,033,882 | -$2,425,581 | |
| Kansas | $8,114,471 | -$231,031 | -$808,708 | -$1,968,251 | -$536,553 | -$951,468 | -$2,232,230 | |
| Kentucky | $14,055,736 | -$400,188 | -$1,400,830 | -$3,409,368 | -$929,407 | -$1,648,115 | -$3,866,627 | |
| Louisiana | $14,605,721 | -$415,847 | -$1,455,642 | -$3,542,773 | -$965,773 | -$1,712,604 | -$4,017,924 | |
| Maine | $4,708,728 | -$134,065 | -$469,284 | -$1,142,152 | -$311,355 | -$552,125 | -$1,295,336 | |
| Maryland | $12,899,979 | -$367,282 | -$1,285,644 | -$3,129,027 | -$852,985 | -$1,512,596 | -$3,548,687 | |
| Massachusetts | $25,171,557 | -$716,673 | -$2,508,660 | -$6,105,629 | -$1,664,418 | -$2,951,509 | -$6,924,506 | |
| Michigan | $30,838,799 | -$878,028 | -$3,073,471 | -$7,480,279 | -$2,039,152 | -$3,616,025 | -$8,483,522 | |
| Minnesota | $13,486,827 | -$383,991 | -$1,344,131 | -$3,271,373 | -$891,789 | -$1,581,408 | -$3,710,125 | |
| Mississippi | $9,472,960 | -$269,710 | -$944,099 | -$2,297,767 | -$626,380 | -$1,110,759 | -$2,605,940 | |
| Missouri | $18,430,106 | -$524,733 | -$1,836,790 | -$4,470,418 | -$1,218,653 | -$2,161,035 | -$5,069,984 | |
| Montana | $3,890,397 | -$110,766 | -$387,727 | -$943,657 | -$257,245 | -$456,171 | -$1,070,219 | |
| Nebraska | $5,583,112 | -$158,960 | -$556,427 | -$1,354,243 | -$369,172 | -$654,652 | -$1,535,872 | |
| Nevada | $8,515,508 | -$242,450 | -$848,677 | -$2,065,527 | -$563,070 | -$998,492 | -$2,342,552 | |
| New Hampshire | $3,782,193 | -$107,685 | -$376,943 | -$917,411 | -$250,090 | -$443,484 | -$1,040,453 | |
| New Jersey | $25,676,951 | -$731,062 | -$2,559,029 | -$6,228,217 | -$1,697,836 | -$3,010,769 | -$7,063,536 | |
| New Mexico | $5,682,237 | -$161,782 | -$566,306 | -$1,378,287 | -$375,726 | -$666,275 | -$1,563,141 | |
| New York | $100,863,556 | -$2,871,740 | -$10,052,313 | -$24,465,528 | -$6,669,396 | -$11,826,828 | -$27,746,806 | |
| North Carolina | $25,894,752 | -$737,263 | -$2,580,735 | -$6,281,047 | -$1,712,237 | -$3,036,308 | -$7,123,452 | |
| North Dakota | $3,421,865 | -$97,426 | -$341,032 | -$830,010 | -$226,264 | -$401,233 | -$941,329 | |
| Ohio | $40,793,446 | -$1,161,452 | -$4,065,576 | -$9,894,884 | -$2,697,383 | -$4,783,265 | -$11,221,970 | |
| Oklahoma | $11,137,072 | -$317,090 | -$1,109,948 | -$2,701,415 | -$736,416 | -$1,305,885 | -$3,063,725 | |
| Oregon | $12,885,177 | -$366,861 | -$1,284,169 | -$3,125,437 | -$852,006 | -$1,510,861 | -$3,544,615 | |
| Pennsylvania | $42,358,448 | -$1,206,010 | -$4,221,548 | -$10,274,492 | -$2,800,865 | -$4,966,770 | -$11,652,491 | |
| Rhode Island | $5,113,794 | -$145,598 | -$509,653 | -$1,240,405 | -$338,139 | -$599,622 | -$1,406,766 | |
| South Carolina | $12,019,586 | -$342,216 | -$1,197,902 | -$2,915,478 | -$794,770 | -$1,409,365 | -$3,306,498 | |
| South Dakota | $3,373,459 | -$96,048 | -$336,207 | -$818,268 | -$223,063 | -$395,557 | -$928,013 | |
| Tennessee | $18,163,195 | -$517,134 | -$1,810,189 | -$4,405,676 | -$1,201,004 | -$2,129,738 | -$4,996,558 | |
| Texas | $67,626,569 | -$1,925,432 | -$6,739,832 | -$16,403,543 | -$4,471,668 | -$7,929,602 | -$18,603,561 | |
| Utah | $6,312,640 | -$179,731 | -$629,133 | -$1,531,198 | -$417,410 | -$740,193 | -$1,736,560 | |
| Vermont | $3,340,710 | -$95,115 | -$332,943 | -$810,325 | -$220,898 | -$391,717 | -$919,004 | |
| Virginia | $18,940,130 | -$539,255 | -$1,887,620 | -$4,594,130 | -$1,252,377 | -$2,220,838 | -$5,210,287 | |
| Washington | $19,806,562 | -$563,923 | -$1,973,971 | -$4,804,292 | -$1,309,668 | -$2,322,433 | -$5,448,636 | |
| West Virginia | $6,436,376 | -$183,254 | -$641,465 | -$1,561,211 | -$425,592 | -$754,702 | -$1,770,599 | |
| Wisconsin | $18,234,014 | -$519,150 | -$1,817,247 | -$4,422,854 | -$1,205,687 | -$2,138,042 | -$5,016,040 | |
| Wyoming | $3,500,000 | -$99,650 | -$348,819 | -$848,962 | -$231,430 | -$410,395 | -$962,824 | |
| U.S. Territories | $18,069,960 | -$514,479 | -$1,800,897 | -$4,383,061 | -$1,194,839 | -$2,118,806 | -$4,970,910 | |
| Total | $1 billion | -$29 million | -$100 million | -$244 million | -$66 million | -118 million | -$276 million | |
| Table 2e: Estimated Cuts in Homeless Assistance Grants under BCA Caps, Sequestration, Ryan | |||||||
| State | 2012 actual | 2014 | 2021 | ||||
| BCA cap | BCA sequestration | House (Ryan) | BCA cap | BCA sequestration | House (Ryan) | ||
| Alabama | $22,258,870 | -$633,744 | -$2,218,374 | -$5,399,126 | -$1,471,822 | -$2,609,980 | -$6,123,248 |
| Alaska | $3,954,161 | -$112,581 | -$394,082 | -$959,124 | -$261,461 | -$463,648 | -$1,087,760 |
| Arizona | $39,593,590 | -$1,127,290 | -$3,945,996 | -$9,603,846 | -$2,618,045 | -$4,642,575 | -$10,891,899 |
| Arkansas | $8,492,503 | -$241,795 | -$846,384 | -$2,059,947 | -$561,549 | -$995,795 | -$2,336,224 |
| California | $310,151,984 | -$8,830,503 | -$30,910,518 | -$75,230,661 | -$20,508,163 | -$36,367,093 | -$85,320,480 |
| Colorado | $23,129,181 | -$658,523 | -$2,305,112 | -$5,610,229 | -$1,529,370 | -$2,712,029 | -$6,362,664 |
| Connecticut | $35,567,628 | -$1,012,665 | -$3,544,758 | -$8,627,306 | -$2,351,836 | -$4,170,508 | -$9,784,387 |
| Delaware | $6,030,395 | -$171,695 | -$601,004 | -$1,462,736 | -$398,747 | -$707,098 | -$1,658,916 |
| District of Columbia | $21,953,527 | -$625,051 | -$2,187,943 | -$5,325,061 | -$1,451,632 | -$2,574,177 | -$6,039,250 |
| Florida | $91,233,624 | -$2,597,561 | -$9,092,570 | -$22,129,685 | -$6,032,636 | -$10,697,664 | -$25,097,684 |
| Georgia | $39,903,382 | -$1,136,111 | -$3,976,870 | -$9,678,989 | -$2,638,529 | -$4,678,900 | -$10,977,121 |
| Hawaii | $12,776,088 | -$363,755 | -$1,273,297 | -$3,098,976 | -$844,793 | -$1,498,069 | -$3,514,606 |
| Idaho | $4,730,200 | -$134,676 | -$471,423 | -$1,147,360 | -$312,775 | -$554,643 | -$1,301,242 |
| Illinois | $104,140,457 | -$2,965,039 | -$10,378,897 | -$25,260,375 | -$6,886,074 | -$12,211,064 | -$28,648,257 |
| Indiana | $25,441,219 | -$724,351 | -$2,535,535 | -$6,171,038 | -$1,682,248 | -$2,983,128 | -$6,998,688 |
| Iowa | $11,664,367 | -$332,102 | -$1,162,500 | -$2,829,316 | -$771,282 | -$1,367,714 | -$3,208,780 |
| Kansas | $10,486,035 | -$298,554 | -$1,045,064 | -$2,543,499 | -$693,368 | -$1,229,548 | -$2,884,629 |
| Kentucky | $21,975,020 | -$625,663 | -$2,190,085 | -$5,330,275 | -$1,453,053 | -$2,576,697 | -$6,045,163 |
| Louisiana | $33,035,205 | -$940,563 | -$3,292,371 | -$8,013,040 | -$2,184,385 | -$3,873,567 | -$9,087,737 |
| Maine | $12,100,762 | -$344,527 | -$1,205,992 | -$2,935,168 | -$800,138 | -$1,418,884 | -$3,328,829 |
| Maryland | $51,896,356 | -$1,477,569 | -$5,172,120 | -$12,588,013 | -$3,431,540 | -$6,085,144 | -$14,276,298 |
| Massachusetts | $73,205,748 | -$2,084,280 | -$7,295,867 | -$17,756,832 | -$4,840,580 | -$8,583,792 | -$20,138,351 |
| Michigan | $74,116,802 | -$2,110,219 | -$7,386,665 | -$17,977,818 | -$4,900,821 | -$8,690,619 | -$20,388,975 |
| Minnesota | $28,506,049 | -$811,611 | -$2,840,984 | -$6,914,445 | -$1,884,904 | -$3,342,497 | -$7,841,800 |
| Mississippi | $8,438,499 | -$240,257 | -$841,002 | -$2,046,848 | -$557,978 | -$989,462 | -$2,321,368 |
| Missouri | $32,588,611 | -$927,848 | -$3,247,862 | -$7,904,714 | -$2,154,855 | -$3,821,201 | -$8,964,882 |
| Montana | $3,465,582 | -$98,670 | -$345,389 | -$840,614 | -$229,154 | -$406,359 | -$953,356 |
| Nebraska | $7,362,608 | -$209,625 | -$733,776 | -$1,785,879 | -$486,837 | -$863,308 | -$2,025,398 |
| Nevada | $10,618,372 | -$302,321 | -$1,058,253 | -$2,575,599 | -$702,118 | -$1,245,065 | -$2,921,034 |
| New Hampshire | $7,093,149 | -$201,953 | -$706,921 | -$1,720,519 | -$469,020 | -$831,712 | -$1,951,272 |
| New Jersey | $46,478,310 | -$1,323,309 | -$4,632,144 | -$11,273,808 | -$3,073,283 | -$5,449,847 | -$12,785,834 |
| New Mexico | $10,374,008 | -$295,364 | -$1,033,899 | -$2,516,326 | -$685,960 | -$1,216,412 | -$2,853,812 |
| New York | $215,706,769 | -$6,141,503 | -$21,497,873 | -$52,321,970 | -$14,263,167 | -$25,292,851 | -$59,339,311 |
| North Carolina | $28,258,057 | -$804,550 | -$2,816,268 | -$6,854,292 | -$1,868,506 | -$3,313,419 | -$7,773,579 |
| North Dakota | $2,476,415 | -$70,507 | -$246,806 | -$600,681 | -$163,748 | -$290,374 | -$681,243 |
| Ohio | $92,250,086 | -$2,626,502 | -$9,193,873 | -$22,376,239 | -$6,099,848 | -$10,816,850 | -$25,377,305 |
| Oklahoma | $9,370,546 | -$266,794 | -$933,892 | -$2,272,926 | -$619,608 | -$1,098,750 | -$2,577,767 |
| Oregon | $23,137,403 | -$658,757 | -$2,305,931 | -$5,612,223 | -$1,529,913 | -$2,712,993 | -$6,364,926 |
| Pennsylvania | $102,571,574 | -$2,920,370 | -$10,222,538 | -$24,879,826 | -$6,782,335 | -$12,027,103 | -$28,216,669 |
| Rhode Island | $7,317,618 | -$208,344 | -$729,292 | -$1,774,966 | -$483,862 | -$858,033 | -$2,013,022 |
| South Carolina | $12,439,653 | -$354,176 | -$1,239,767 | -$3,017,370 | -$822,547 | -$1,458,620 | -$3,422,055 |
| South Dakota | $2,261,057 | -$64,376 | -$225,343 | -$548,443 | -$149,508 | -$265,122 | -$622,000 |
| Tennessee | $23,681,494 | -$674,248 | -$2,360,157 | -$5,744,198 | -$1,565,890 | -$2,776,791 | -$6,514,601 |
| Texas | $95,230,049 | -$2,711,346 | -$9,490,863 | -$23,099,061 | -$6,296,892 | -$11,166,267 | -$26,197,071 |
| Utah | $8,956,073 | -$254,993 | -$892,585 | -$2,172,391 | -$592,202 | -$1,050,151 | -$2,463,748 |
| Vermont | $4,350,369 | -$123,862 | -$433,569 | -$1,055,228 | -$287,659 | -$510,106 | -$1,196,754 |
| Virginia | $27,806,301 | -$791,688 | -$2,771,245 | -$6,744,714 | -$1,838,635 | -$3,260,448 | -$7,649,304 |
| Washington | $45,638,519 | -$1,299,399 | -$4,548,448 | -$11,070,108 | -$3,017,753 | -$5,351,377 | -$12,554,814 |
| West Virginia | $8,027,256 | -$228,548 | -$800,016 | -$1,947,096 | -$530,786 | -$941,242 | -$2,208,238 |
| Wisconsin | $28,388,100 | -$808,253 | -$2,829,229 | -$6,885,835 | -$1,877,105 | -$3,328,667 | -$7,809,353 |
| Wyoming | $669,908 | -$19,073 | -$66,765 | -$162,493 | -$44,296 | -$78,551 | -$184,287 |
| U.S. Territories | $29,052,039 | -$827,156 | -$2,895,398 | -$7,046,881 | -$1,921,006 | -$3,406,518 | -$7,991,998 |
| Total | $1.96 billion | -$56 million | -$195 million | -$476 million | -$130 million | -$230 million | -$539 million |
| Table 2f: Estimated Cuts in Native American Housing Block Grants under BCA Caps, Sequestration, House (Ryan) | |||||||
| State | 2012 actual | 2014 | 2021 | ||||
| BCA cap | BCA sequestration | House (Ryan) | BCA cap | BCA sequestration | House (Ryan) | ||
| Alabama | $2,015,847 | -$57,394 | -$200,904 | -$488,965 | -$133,294 | -$236,370 | -$554,544 |
| Alaska | $99,308,089 | -$2,827,454 | -$9,897,291 | -$24,088,233 | -$6,566,544 | -$11,644,441 | -$27,318,909 |
| Arizona | $74,169,100 | -$2,111,708 | -$7,391,877 | -$17,990,504 | -$4,904,280 | -$8,696,751 | -$20,403,362 |
| Arkansas | $0 | $0 | $0 | $0 | $0 | $0 | $0 |
| California | $45,859,761 | -$1,305,698 | -$4,570,498 | -$11,123,773 | -$3,032,383 | -$5,377,319 | -$12,615,676 |
| Colorado | $1,838,640 | -$52,349 | -$183,243 | -$445,982 | -$121,576 | -$215,591 | -$505,796 |
| Connecticut | $76,464 | -$2,177 | -$7,621 | -$18,547 | -$5,056 | -$8,966 | -$21,035 |
| Delaware | $0 | $0 | $0 | $0 | $0 | $0 | $0 |
| District of Columbia | $0 | $0 | $0 | $0 | $0 | $0 | $0 |
| Florida | $1,422,479 | -$40,500 | -$141,768 | -$345,037 | -$94,059 | -$166,794 | -$391,313 |
| Georgia | $0 | $0 | $0 | $0 | $0 | $0 | $0 |
| Hawaii | $0 | $0 | $0 | $0 | $0 | $0 | $0 |
| Idaho | $4,870,883 | -$138,682 | -$485,444 | -$1,181,484 | -$322,077 | -$571,139 | -$1,339,943 |
| Illinois | $0 | $0 | $0 | $0 | $0 | $0 | $0 |
| Indiana | $1,062,156 | -$30,241 | -$105,857 | -$257,637 | -$70,233 | -$124,544 | -$292,191 |
| Iowa | $1,432,152 | -$40,776 | -$142,732 | -$347,384 | -$94,698 | -$167,928 | -$393,974 |
| Kansas | $1,428,692 | -$40,677 | -$142,387 | -$346,544 | -$94,469 | -$167,522 | -$393,022 |
| Kentucky | $0 | $0 | $0 | $0 | $0 | $0 | $0 |
| Louisiana | $588,408 | -$16,753 | -$58,642 | -$142,725 | -$38,907 | -$68,994 | -$161,867 |
| Maine | $3,926,247 | -$111,786 | -$391,300 | -$952,353 | -$259,615 | -$460,375 | -$1,080,081 |
| Maryland | $0 | $0 | $0 | $0 | $0 | $0 | $0 |
| Massachusetts | $1,128,094 | -$32,119 | -$112,429 | -$273,631 | -$74,593 | -$132,275 | -$310,330 |
| Michigan | $12,839,502 | -$365,560 | -$1,279,617 | -$3,114,358 | -$848,986 | -$1,505,505 | -$3,532,051 |
| Minnesota | $17,853,406 | -$508,314 | -$1,779,315 | -$4,330,533 | -$1,180,520 | -$2,093,414 | -$4,911,338 |
| Mississippi | $3,030,375 | -$86,279 | -$302,015 | -$735,050 | -$200,377 | -$355,329 | -$833,633 |
| Missouri | $281,587 | -$8,017 | -$28,064 | -$68,302 | -$18,619 | -$33,018 | -$77,462 |
| Montana | $29,241,598 | -$832,553 | -$2,914,290 | -$7,092,860 | -$1,933,541 | -$3,428,744 | -$8,044,144 |
| Nebraska | $7,946,793 | -$226,257 | -$791,997 | -$1,927,579 | -$525,465 | -$931,807 | -$2,186,103 |
| Nevada | $14,757,408 | -$420,166 | -$1,470,760 | -$3,579,566 | -$975,803 | -$1,730,390 | -$4,059,652 |
| New Hampshire | $0 | $0 | $0 | $0 | $0 | $0 | $0 |
| New Jersey | $0 | $0 | $0 | $0 | $0 | $0 | $0 |
| New Mexico | $74,063,814 | -$2,108,710 | -$7,381,384 | -$17,964,965 | -$4,897,318 | -$8,684,405 | -$20,374,399 |
| New York | $6,182,289 | -$176,019 | -$616,142 | -$1,499,580 | -$408,791 | -$724,909 | -$1,700,701 |
| North Carolina | $17,695,091 | -$503,806 | -$1,763,537 | -$4,292,132 | -$1,170,052 | -$2,074,851 | -$4,867,787 |
| North Dakota | $11,296,724 | -$321,635 | -$1,125,860 | -$2,740,140 | -$746,973 | -$1,324,605 | -$3,107,644 |
| Ohio | $0 | $0 | $0 | $0 | $0 | $0 | $0 |
| Oklahoma | $95,468,551 | -$2,718,136 | -$9,514,633 | -$23,156,912 | -$6,312,662 | -$11,194,233 | -$26,262,681 |
| Oregon | $17,026,758 | -$484,778 | -$1,696,929 | -$4,130,021 | -$1,125,859 | -$1,996,485 | -$4,683,933 |
| Pennsylvania | $0 | $0 | $0 | $0 | $0 | $0 | $0 |
| Rhode Island | $561,831 | -$15,996 | -$55,993 | -$136,278 | -$37,150 | -$65,878 | -$154,555 |
| South Carolina | $1,254,641 | -$35,722 | -$125,041 | -$304,327 | -$82,961 | -$147,114 | -$345,142 |
| South Dakota | $33,118,200 | -$942,926 | -$3,300,642 | -$8,033,171 | -$2,189,873 | -$3,883,298 | -$9,110,568 |
| Tennessee | $168,354 | -$4,793 | -$16,779 | -$40,836 | -$11,132 | -$19,740 | -$46,313 |
| Texas | $1,578,424 | -$44,940 | -$157,310 | -$382,864 | -$104,370 | -$185,079 | -$434,213 |
| Utah | $12,617,777 | -$359,247 | -$1,257,519 | -$3,060,576 | -$834,325 | -$1,479,506 | -$3,471,056 |
| Vermont | $0 | $0 | $0 | $0 | $0 | $0 | $0 |
| Virginia | $0 | $0 | $0 | $0 | $0 | $0 | $0 |
| Washington | $36,696,288 | -$1,044,800 | -$3,657,243 | -$8,901,075 | -$2,426,467 | -$4,302,849 | -$10,094,873 |
| West Virginia | $0 | $0 | $0 | $0 | $0 | $0 | $0 |
| Wisconsin | $21,094,136 | -$600,582 | -$2,102,294 | -$5,116,607 | -$1,394,806 | -$2,473,408 | -$5,802,838 |
| Wyoming | $3,724,721 | 32,791 | -$371,215 | -$903,471 | -$246,290 | -$436,745 | -$1,024,643 |
| U.S. Territories | $0 | $0 | $0 | $0 | $0 | $0 | $0 |
| Total | $658 million | -$19 million | -$66 million | -$160 million | -$43 million | -$77 million | -$181 million |
| Table 2g: Estimated Cuts in CDBG Formula Grants under BCA Caps, Sequestration, House (Ryan) | |||||||
| State | 2012 actual | 2014 | 2021 | ||||
| BCA cap | BCA sequestration | House (Ryan) | BCA cap | BCA sequestration | House (Ryan) | ||
| Alabama | $39,246,037 | -$1,117,395 | -$3,911,358 | -$9,519,543 | -$2,595,064 | -$4,601,822 | -$10,796,290 |
| Alaska | $3,843,406 | -$109,428 | -$383,043 | -$932,259 | -$254,137 | -$450,661 | -$1,057,292 |
| Arizona | $46,405,177 | -$1,321,227 | -$4,624,855 | -$11,256,069 | -$3,068,447 | -$5,441,272 | -$12,765,715 |
| Arkansas | $23,433,880 | -$667,199 | -$2,335,479 | -$5,684,137 | -$1,549,517 | -$2,747,756 | -$6,446,484 |
| California | $351,573,471 | -$10,009,836 | -$35,038,686 | -$85,277,883 | -$23,247,074 | -$41,223,999 | -$96,715,220 |
| Colorado | $32,933,094 | -$937,656 | -$3,282,194 | -$7,988,272 | -$2,177,633 | -$3,861,593 | -$9,059,647 |
| Connecticut | $34,325,990 | -$977,314 | -$3,421,014 | -$8,326,134 | -$2,269,736 | -$4,024,919 | -$9,442,822 |
| Delaware | $6,233,818 | -$177,486 | -$621,278 | -$1,512,079 | -$412,198 | -$730,951 | -$1,714,876 |
| District of Columbia | $13,904,983 | -$395,896 | -$1,385,805 | -$3,372,801 | -$919,438 | -$1,630,439 | -$3,825,156 |
| Florida | $123,354,155 | -$3,512,082 | -$12,293,782 | -$29,920,862 | -$8,156,540 | -$14,463,980 | -$33,933,801 |
| Georgia | $72,331,774 | -$2,059,397 | -$7,208,764 | -$17,544,841 | -$4,782,790 | -$8,481,314 | -$19,897,928 |
| Hawaii | $12,204,143 | -$347,471 | -$1,216,295 | -$2,960,245 | -$806,974 | -$1,431,006 | -$3,357,268 |
| Idaho | $10,660,286 | -$303,515 | -$1,062,431 | -$2,585,766 | -$704,890 | -$1,249,979 | -$2,932,565 |
| Illinois | $146,421,200 | -$4,168,836 | -$14,592,701 | -$35,516,019 | -$9,681,801 | -$17,168,723 | -$40,279,372 |
| Indiana | $59,842,592 | -$1,703,810 | -$5,964,062 | -$14,515,457 | -$3,956,969 | -$7,016,886 | -$16,462,247 |
| Iowa | $32,857,042 | -$935,490 | -$3,274,615 | -$7,969,825 | -$2,172,604 | -$3,852,676 | -$9,038,725 |
| Kansas | $23,399,317 | -$666,214 | -$2,332,034 | -$5,675,753 | -$1,547,232 | -$2,743,704 | -$6,436,976 |
| Kentucky | $38,294,674 | -$1,090,308 | -$3,816,542 | -$9,288,780 | -$2,532,157 | -$4,490,269 | -$10,534,577 |
| Louisiana | $45,354,000 | -$1,291,298 | -$4,520,092 | -$11,001,095 | -$2,998,940 | -$5,318,016 | -$12,476,545 |
| Maine | $16,106,214 | -$458,569 | -$1,605,185 | -$3,906,733 | -$1,064,990 | -$1,888,546 | -$4,430,698 |
| Maryland | $42,440,741 | -$1,208,353 | -$4,229,750 | -$10,294,453 | -$2,806,307 | -$4,976,419 | -$11,675,129 |
| Massachusetts | $88,974,486 | -$2,533,240 | -$8,867,419 | -$21,581,707 | -$5,883,255 | -$10,432,767 | -$24,476,213 |
| Michigan | $111,620,816 | -$3,178,016 | -$11,124,408 | -$27,074,815 | -$7,380,697 | -$13,088,179 | -$30,706,048 |
| Minnesota | $47,038,219 | -$1,339,250 | -$4,687,946 | -$11,409,620 | -$3,110,306 | -$5,515,500 | -$12,939,861 |
| Mississippi | $27,513,192 | -$783,343 | -$2,742,033 | -$6,673,617 | -$1,819,253 | -$3,226,079 | -$7,568,672 |
| Missouri | $56,650,547 | -$1,612,928 | -$5,645,934 | -$13,741,192 | -$3,745,901 | -$6,642,600 | -$15,584,140 |
| Montana | $7,347,866 | -$209,205 | -$732,307 | -$1,782,303 | -$485,863 | -$861,579 | -$2,021,343 |
| Nebraska | $16,398,847 | -$466,900 | -$1,634,350 | -$3,977,715 | -$1,084,340 | -$1,922,859 | -$4,511,200 |
| Nevada | $17,633,337 | -$502,048 | -$1,757,382 | -$4,277,153 | -$1,165,968 | -$2,067,610 | -$4,850,799 |
| New Hampshire | $10,831,576 | -$308,392 | -$1,079,502 | -$2,627,314 | -$716,216 | -$1,270,064 | -$2,979,685 |
| New Jersey | $77,708,633 | -$2,212,484 | -$7,744,636 | -$18,849,055 | -$5,138,324 | -$9,111,781 | -$21,377,061 |
| New Mexico | $14,165,369 | -$403,310 | -$1,411,756 | -$3,435,961 | -$936,656 | -$1,660,970 | -$3,896,787 |
| New York | $281,664,304 | -$8,019,415 | -$28,071,365 | -$68,320,671 | -$18,624,474 | -$33,026,749 | -$77,483,734 |
| North Carolina | $65,385,998 | -$1,861,640 | -$6,516,531 | -$15,860,069 | -$4,323,515 | -$7,666,882 | -$17,987,197 |
| North Dakota | $4,925,059 | -$140,224 | -$490,844 | -$1,194,625 | -$325,659 | -$577,491 | -$1,354,847 |
| Ohio | $135,321,183 | -$3,852,802 | -$13,486,446 | -$32,823,591 | -$8,947,835 | -$15,867,182 | -$37,225,841 |
| Oklahoma | $24,942,864 | -$710,162 | -$2,485,868 | -$6,050,157 | -$1,649,296 | -$2,924,693 | -$6,861,594 |
| Oregon | $30,258,808 | -$861,515 | -$3,015,668 | -$7,339,596 | -$2,000,802 | -$3,548,018 | -$8,323,971 |
| Pennsylvania | $167,973,974 | -$4,782,477 | -$16,740,704 | -$40,743,873 | -$11,106,934 | -$19,695,908 | -$46,208,378 |
| Rhode Island | $14,662,008 | -$417,450 | -$1,461,252 | -$3,556,426 | -$969,495 | -$1,719,204 | -$4,033,408 |
| South Carolina | $32,602,287 | -$928,237 | -$3,249,225 | -$7,908,031 | -$2,155,759 | -$3,822,804 | -$8,968,644 |
| South Dakota | $6,552,541 | -$186,561 | -$653,043 | -$1,589,388 | -$433,273 | -$768,323 | -$1,802,555 |
| Tennessee | $44,563,668 | -$1,268,796 | -$4,441,326 | -$10,809,391 | -$2,946,681 | -$5,225,345 | -$12,259,130 |
| Texas | $215,435,097 | -$6,133,768 | -$21,470,797 | -$52,256,073 | -$14,245,204 | -$25,260,996 | -$59,264,576 |
| Utah | $18,142,062 | -$516,532 | -$1,808,083 | -$4,400,550 | -$1,199,607 | -$2,127,260 | -$4,990,745 |
| Vermont | $6,837,137 | -$194,664 | -$681,406 | -$1,658,420 | -$452,092 | -$801,693 | -$1,880,845 |
| Virginia | $48,666,534 | -$1,385,611 | -$4,850,228 | -$11,804,585 | -$3,217,975 | -$5,706,429 | -$13,387,798 |
| Washington | $48,830,368 | -$1,390,276 | -$4,866,556 | -$11,844,325 | -$3,228,808 | -$5,725,640 | -$13,432,867 |
| West Virginia | $19,137,316 | -$544,869 | -$1,907,272 | -$4,641,959 | -$1,265,416 | -$2,243,960 | -$5,264,532 |
| Wisconsin | $54,535,888 | -$1,552,720 | -$5,435,182 | -$13,228,259 | -$3,606,074 | -$6,394,645 | -$15,002,413 |
| Wyoming | $3,196,119 | -$90,998 | -$318,533 | -$775,253 | -$211,337 | -$374,763 | -$879,228 |
| U.S. Territories | $73,983,925 | -$2,106,436 | -$7,373,422 | -$17,945,587 | -$4,892,035 | -$8,675,038 | -$20,352,422 |
| Total | $2.95 billion | -$84 million | -$294 million | -$715 million | -$195 million | -$346 million | -$811 million |
End Notes
[1] The BCA also sets separate sub-caps for defense and non-defense discretionary programs. This policy is important because it makes it more difficult for policymakers to lessen or avert reductions in defense funding by further cutting funding for non-defense programs.
[2] Richard Kogan, Congress Has Cut Discretionary Funding by $1.5 Trillion Over Ten Years, Center on Budget and Policy Priorities, September 25, 2012, https://www.cbpp.org/cms/index.cfm?fa=view&id=3840.
[3] All figures are stated in 2012 dollars. The methods and sources used are explained in the appendix.
[4] “Discretionary” programs are those that Congress funds annually through appropriations, and they include most housing assistance and community development programs.
[5] “Housing assistance” is a standard federal budget category that includes the Housing Choice Voucher, Section 8 project-based rental assistance, public housing, homeless assistance, HOME, elderly and disabled housing programs, as well as various USDA housing programs. Most of the funding in the “Community Development” category is for CDBG formula grants, but it also includes a number of smaller HUD and USDA programs.
[6] For fiscal years 2014-2021, the President and Congress can set funding priorities under the BCA caps and protect low-income housing and community development from cuts if they choose, by cutting other programs more steeply. However, certain other non-defense discretionary programs such as veterans’ health care, bio-medical research, and the FBI are the ones most likely to be shielded, and that will force deeper-than-average reductions in many of the remaining non-defense discretionary programs. The experience from the 2011 and 2012 funding cycles suggests that low-income housing and community development programs can expect to absorb funding cuts that are at least equal in depth to the cuts that non-defense discretionary programs as a whole will have to bear.
[7] In addition, the analysis ignores the role of FHA mortgage insurance premiums in the HUD budget. FHA programs now dominate the mortgage market, yet their market share is expected to fall sharply in coming years as the private market continues to recover. As a result, HUD’s budget may experience declining revenues, forcing the Administration and Congress to provide additional budget authority to sustain program funding levels.
[8] Douglas Rice, Senate Funding Bill Improves on President's Budget Request for Rental Assistance, Center on Budget and Policy Priorities, May 22, 2012, https://www.cbpp.org/cms/index.cfm?fa=view&id=3782.
[9] For information on AHSSIA, see the materials available on our web site at: https://www.cbpp.org/research/index.cfm?fa=topic&id=143.
[10] Sequestration also applies to defense and mandatory (“entitlement”) programs. Most low-income entitlement programs, including Medicaid and SNAP (food stamps), are exempted from sequestration, but the vast majority of low-income housing and community development programs are not. The only exception is the veterans’ supportive housing program (HUD-VASH).
[11] Richard Kogan, “$2 Trillion in Deficit Savings Would Achieve Key Goal: Stabilizing the Debt Over the Next Decade,” Center on Budget and Policy Priorities, November 1, 2012, https://www.cbpp.org/cms/index.cfm?fa=view&id=3856.
[12] See the following papers from the Center on Budget and Policy Priorities: Kelsey Merrick and Jim Horney, “Chairman Ryan Gets 62 Percent of His Huge Budget Cuts from Programs for Lower-Income Americans,” March 23, 2012, https://www.cbpp.org/cms/index.cfm?fa=view&id=3723; Edwin Park and Matt Broaddus, “Ryan Medicaid Block Grant Would Cut Medicaid by One-Third by 2022 and More After That,” March 27, 2012, https://www.cbpp.org/cms/index.cfm?fa=view&id=3727; Dottie Rosenbaum, “Ryan Budget Would Slash SNAP Funding by $134 Billion Over Ten Years,” April 18, 2012, https://www.cbpp.org/cms/index.cfm?fa=view&id=3717; and Michael Leachman et al., “Deficit-Reduction Package That Lacks Significant Revenues Would Shift Very Substantial Costs to States and Localities,” August 8, 2012, https://www.cbpp.org/cms/index.cfm?fa=view&id=3816.
[13] American Housing Survey, 2011, Preliminary Table C10-RO.
More from the Authors