BEYOND THE NUMBERS
TANF Weakening as a Safety Net
Many policymakers see the 1996 welfare law’s creation of Temporary Assistance for Needy Families (TANF) as a major success and cite TANF’s structure — a block grant with fixed federal funding but broad state flexibility— as a model for other safety net programs.
But when we analyzed state-by-state data to examine how well states have maintained TANF’s role as a safety net, the results were sobering. TANF now provides a safety net for relatively few poor families with children.
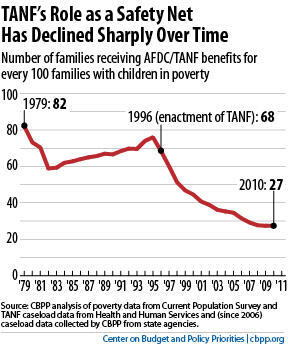
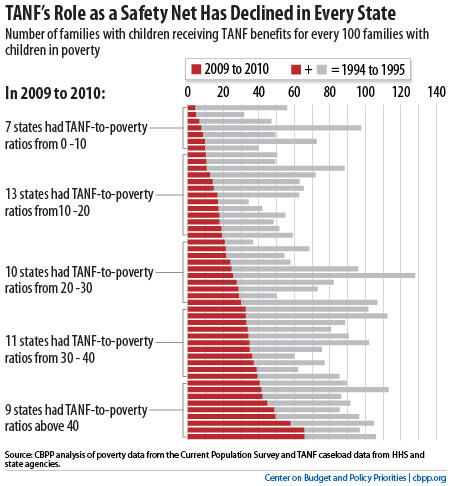
TANF-to-poverty ratios have fallen dramatically in all states since the mid-1990s (see second graph):
- In 1994-95, almost half of the states had a ratio higher than 75. In 2009-10, none did.
- In 1994-95, no state had a ratio lower than 25. In 2009-10, half of the states did.
TANF-to-poverty ratios fell so far not because the number of poor people fell but, instead, because TANF caseloads fell. From 1994-95 to 2009-10, caseloads declined by at least 27 percent in every state and by over 50 percent in 36 states. During that same period, the number of families with children in poverty rose by at least 10 percent in over half the states. But TANF failed to respond to the increased need.
Georgia provides a striking example. Between 1994-95 and 2009-10, Georgia’s TANF-to-poverty ratio dropped from 98 all the way to 9. TANF caseloads fell by 85 percent even as the number of poor families rose by 92 percent. Caseloads fell largely because of state policies designed to make it harder for families to get TANF and easier to remove families from the program.
TANF’s block grant structure contributed significantly to these problems, although TANF’s work requirements also played a big role. For example, when TANF caseloads fell amidst the hot economy of the late 1990s, states took advantage of the flexibility that the block grant gave them to shift TANF funds to other purposes — in some cases replacing state dollars previously used for these purposes. But when the need for cash assistance rose during recessions, states generally didn’t reclaim those dollars to aid the growing number of families needing help.
Also, the TANF requirement that states place a certain share of TANF families in work activities gives states an incentive to focus on helping only families with the best chance of finding jobs. As a result, the families that most need help are often the families that states least want to serve — and states have adopted policies that keep many of them off the rolls.
When Congress renews TANF — which could occur in 2012 — it should address these and other problems to strengthen the program as a safety net for very poor families.