BEYOND THE NUMBERS
Official Poverty Measure Ignores Key Improvements in the Safety Net Since the 1960s
A recent Associated Press article suggested that when the Census Bureau releases its poverty figures for 2011 this fall, the official poverty rate could reach its highest point since 1965. In a narrow sense, that’s possible. Although private-sector employment improved in 2011, the improvement was weak, and other factors that affect the poverty rate (such as government employment, the amount of unemployment assistance provided to jobless families, and real average weekly wages) fell.
But even if the comparison to 1965 proves technically true, it will be misleading. The AP story itself explains why: The official poverty rate is based on families’ pre-tax, cash income. It ignores all non-cash benefits (such as SNAP, formerly called food stamps) and working-family tax credits such as the Earned Income Tax Credit (EITC) and Child Tax Credit.
In other words, the official measure ignores the very parts of the safety net that have expanded substantially over the past half century — and that have reduced the reality of poverty, even if the improvement doesn’t show up in the official poverty figures. The federal government enacted food stamps as a national program in 1973, for example, and created the EITC and Child Tax Credit in 1975 and 1997, respectively.
Consider just one example of the very real, positive effects of the non-cash safety net: the creation of food stamps has helped eliminate the widespread child malnutrition across parts of the South and Appalachia that shocked the nation in the late 1960s.
Meanwhile, the role of cash assistance in fighting poverty has dwindled, due to large cuts in cash-aid benefit levels (in inflation-adjusted terms) since the 1970s, the conversion of federal cash public assistance to poor families into a block grant whose funding level has been frozen for 16 years without adjustment for inflation or (in recent years) steep increases in unemployment, and many states’ elimination since the 1980s of much or all cash assistance for poor non-elderly adults who aren’t raising children.
In 1965, cash programs that are included in the official poverty measure — Unemployment Insurance, Aid to Families with Dependent Children (since converted into Temporary Assistance for Needy Families), Supplemental Security Income for the low-income elderly and people with disabilities, and state and local general assistance programs — comprised more than 90 percent of the benefits provided by major federal income-support programs for low-income and jobless Americans. By 2010, they accounted for only a little more than half of the benefits.
In other words, the official measure of poverty counts various means-tested cash assistance programs that have shrunk markedly in real per capita terms, while ignoring key forms of “non-cash” assistance that have expanded substantially. The result is that using the official poverty measure to compare today’s poverty rate to that of decades ago yields a distorted picture that obscures more than it illuminates.
Indeed, the part of the safety net that the official poverty measure doesn’t count can matter more than the part that does. That was true throughout the recent recession, during which the non-cash safety net kept millions of Americans out of poverty.
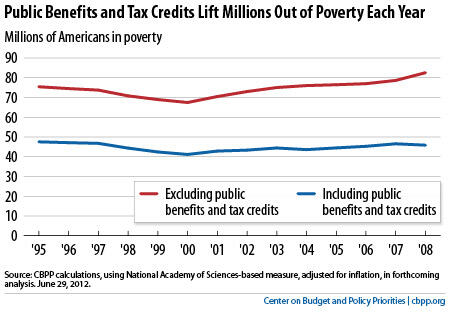
In 2010, the cash assistance programs counted in the official figures kept nearly 13 million non-elderly people above the poverty line, according to the official poverty measure. But if non-cash benefits and refundable tax credits had been included as income, they would have lifted even more non-elderly people — about 14 million — above the official poverty line that year. (The number is even higher if one uses a modernized poverty line and makes other changes in poverty measurement recommended by the National Academy of Sciences, as many experts prefer.)
The poverty situation today is very serious, and the deep recession, the slow and uneven recovery, and declines in various government services and assistance have made it worse. But as we consider how to reduce the number of poor families, it’s important that we not be distracted by comparisons that may lead us astray because they fail to account for the large anti-poverty effects of major parts of the safety net.