

Off the Charts
POLICY INSIGHT
BEYOND THE NUMBERS
BEYOND THE NUMBERS
A State-by-State Look at Inequality
Image

Income inequality has grown in all parts of the country since the late 1970s, a major new analysis by CBPP and the Economic Policy Institute finds. Incomes rose significantly at the top but only modestly for middle- and lower-income households.
In fact, over the most recent full business cycle (from the late 1990s to the mid-2000s), average incomes fell by close to 6 percent among the bottom fifth of households while rising by just 1.2 percent among the middle fifth, by 8.6 percent among the top fifth, and by 14 percent among the top 5 percent of households.
Image
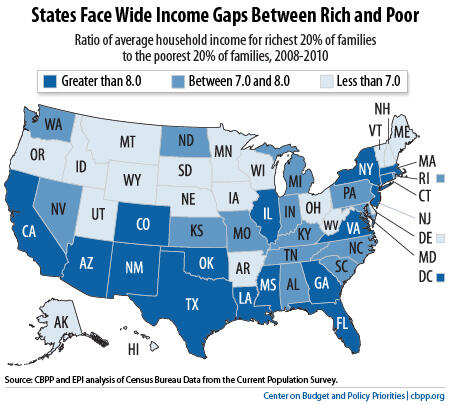
Here are a few highlights on specific states:
- Currently, the biggest gaps between the top and bottom fifths of households are in New Mexico, Arizona, California, Georgia, and New York. The smallest such gaps are in Iowa, Utah, Wyoming, Vermont, and New Hampshire. (See map.)
- Between the late 1990s and mid-2000s, the biggest increases in the gap between the top and bottom fifths occurred in Mississippi, South Dakota, Connecticut, Illinois, and Alabama. Income gaps grew over this period in 45 states plus the District of Columbia; they didn’t narrow in any state.
- Over a longer period — the late 1970s to the mid-2000s — the biggest increases in the top-to-bottom gap occurred in Connecticut, Massachusetts, New York, Kentucky, and Illinois.
We’ll discuss our findings more closely in follow-up posts. We’ll also look at some of the causes of rising inequality and ways that states can mitigate its harmful effects.