The Skewed Benefits of the Tax Cuts: With the Tax Cuts Extended, Top 1 Percent of Households Would Receive Almost $1.2 Trillion in Tax Benefits Over the Next Decade
Under current law, nearly all provisions of the 2001 and 2003 tax cuts are scheduled to expire at the end of 2010. The President’s budget calls for making these tax cuts permanent.
The enacted tax cuts and their extension carry a high cost. This raises the question: how would the large sums involved be distributed among different income groups?
The Urban Institute-Brookings Institution Tax Policy Center has produced estimates of how the benefits of the income and estate tax reductions enacted in 2001 and 2003 will be distributed among households at different income levels in coming years, if these tax cuts are extended. (The estimates assume that relief from the Alternative Minimum Tax is continued. Without extension of AMT relief, the AMT would cancel out a substantial portion of the 2001 and 2003 tax cuts; see the discussion below.)
Estimates from the Congressional Budget Office and the Joint Committee on Taxation indicate that the cost of the tax-cut provisions the Tax Policy Center has analyzed would be $3.8 trillion over the 2009-2018 period, if these provisions are extended. Applying the Tax Policy Center estimates of the share of the tax cuts that would go to each income group to the CBO/Joint Tax Committee estimates of the tax cuts’ cost shows:
| Table 1: | ||
| Income Group | Dollar Amount (In Billions of Dollars) | Percentage Share |
|---|---|---|
| Lowest 20 percent | $19 | 0%* |
| Second 20 percent | 163 | 4% |
| Middle 20 percent | 285 | 8% |
| Fourth 20 percent | 514 | 14% |
| Top 20 percent | 2,808 | 74% |
| Total | 3,799 | 100% |
| Top 1 percent | 1,168 | 31% |
| Above $1 million | 834 | 22% |
| Source: CBPP calculations based on Joint Tax Committee, CBO, and Tax Policy Center data. * Less than 0.5 percent. | ||
- From 2009 through 2018, households with annual incomes of more than $1 million — a group that comprises the highest income 0.3 percent of the population — would receive $834 billion in tax cuts. This represents 22 percent of the total value of the tax cuts over the period.
- Nearly $1.2 trillion in tax cuts would go to the top 1 percent of households, a group with annual incomes above $450,000 in 2008. The highest income 1 percent of households thus would receive nearly one third of the tax cuts’ total value.
- The bottom 60 percent of households would receive 12 percent of the tax cuts’ value, or well under half the amount that would go to the top 1 percent. (See Table 1; for year-by-year detail, see the appendix tables.)
The Distribution of the Tax Cuts When They Are Fully in Effect
Fiscal year 2012 is the first year in which the costs of choosing to extend the 2001 and 2003 tax cuts would be fully felt. It is informative to consider how the benefits of the tax cuts would be distributed in that year.
- In fiscal year 2012, the cost of the income and estate tax cuts examined by the Tax Policy Center would amount to $353 billion.
- Taxpayers with incomes above $1 million would receive tax cuts worth $77 billion, a little over one fifth of the tax cuts’ total value in 2012. The average tax cut per household for this group would be $162,000, according to Tax Policy Center estimates.
- The top 1 percent of the population would receive tax cuts totaling $109 billion, close to one third of the tax cuts’ total value. These households would receive tax cuts averaging $67,000.
- In contrast, the 20 percent of households in the middle fifth of the income scale would receive tax cuts worth $27 billion in 2012. This is only one fourth of the amount going to the top 1 percent of households, despite the fact that 20 times as many households are in the middle fifth of the income scale as are in the top 1 percent. The average tax cut for households in this group would be $840.
Other measures also show that the benefits of the tax cuts would be very unevenly distributed. Many economists believe the best way to assess the progressivity or regressivity of a tax cut is to compare the percentages by which the tax cut increases the after-tax incomes of different groups of households. This approach tends to make tax cuts going to low-income households appear relatively large, since a tax cut of a specific dollar amount will raise the after-tax income of a low-income household by a much larger percentage than it will raise the after-tax income of a high-income household.
Even by this measure, the benefits conferred by the 2001 and 2003 tax cuts are much greater for high-income households than for low- and middle-income households. The Tax Policy Center estimates show that in 2012, the tax cuts will boost the after-tax incomes of households with annual pre-tax incomes above $1 million by 7.5 percent on average. In contrast, the tax cuts will raise the after-tax incomes of households in the middle quintile by 2.3 percent and raise the after-tax incomes of households in the bottom quintile by less than 1 percent (see Table 2). Thus, even if the tax cuts are measured relative to households’ incomes, they are worth much more to high-income households than to those in the middle or bottom of the income scale.
| Table 2: | ||
| Income Group | Average Tax Cut in Dollars | Percent Increase in After-Tax Income |
|---|---|---|
| Lowest 20 percent | $45 | 0.5% |
| Second 20 percent | 470 | 2.1% |
| Middle 20 percent | 840 | 2.3% |
| Fourth 20 percent | 1,500 | 2.4% |
| Top 20 percent | 8,000 | 4.6% |
| Top 1 percent | 67,000 | 6.8% |
| Above $1 million | 162,000 | 7.5% |
| Source: Tax Policy Center | ||
Moreover, these estimates, which show all groups of households receiving at least some small benefit from the tax cuts, do not take into account the fact that the tax cuts ultimately must be paid for. As former Federal Reserve Chairman Alan Greenspan has warned, “If you’re going to lower taxes, you shouldn’t be borrowing essentially the tax cut… [T]hat over the long run is not a stable fiscal situation.”[1] Tax Policy Center data indicate that, even if the enacted tax cuts and their extension eventually were paid for through a balanced package of program cuts and progressive tax increases (rather than solely through benefit cuts), the bottom four fifths of households would likely lose, on average, from the combination of the tax cuts and the measures needed to finance them.[2] That is, once the need to pay for the tax cuts is taken into account, the 2001 and 2003 “tax cuts” are best seen as net tax cuts for the top 20 percent of households, as a group, financed by net tax increases or benefit reductions for the remaining 80 percent of households, as a group.
Putting the Cost of the Tax Cuts in Context
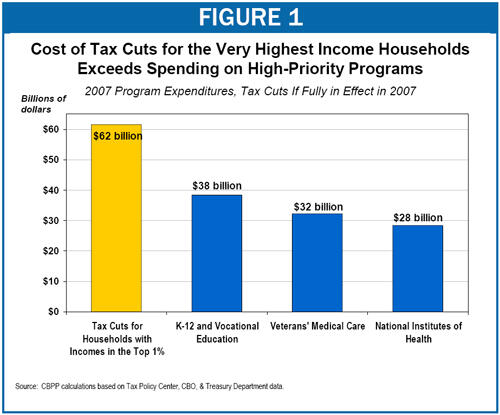
When the tax cuts are fully in effect, the cost of the tax cuts going to the very highest income households will be greater, in today’s terms, than the amounts spent on various high-priority programs.
- In 2007 terms, the cost of tax cuts for households with annual incomes above $1 millionwill exceed what the federal government spent last year on K-12 and vocational education. It similarly will exceed the federal resources dedicated to hospital and other medical care for veterans, as well the resources provided for medical research conducted by the National Institutes of Health (see Figure 1).
- The cost of tax cuts for the highest-income 1 percent of households will exceed the entire 2007 budget of the Department of Education. It similarly will exceed the entire 2007 budget of the Department of Veterans’ Affairs. And it will be greater than the combined budgets of the Departments of Housing and Urban Development, Energy, and State.
The Cost of the Tax Cuts Relative to the Savings From Program Cuts
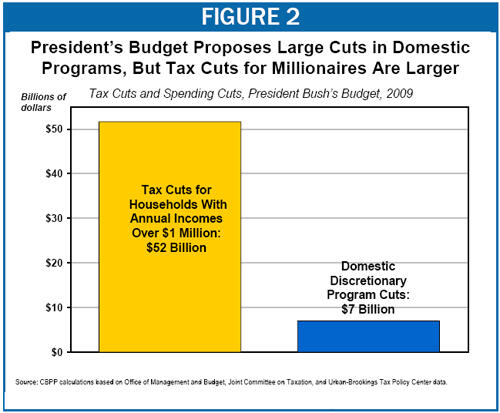
The President’s budget proposes to make permanent the tax cuts enacted in 2001 and 2003. At the same time, the President has proposed substantial cuts to domestic programs in each of the next five years. In 2009, the President’s budget would cut funding for non-defense non-entitlement programs by about $7 billion; the proposed cuts include reductions in education programs, health research, environmental programs, and others. In 2009, the cost of tax cuts for households with incomes above $1 million will be $51 billion (see Figure 2) — about seven times the size of the savings the President’s proposed cuts to domestic discretionary programs will produce.
APPENDIX: FURTHER EXPLANATION OF THE DISTRIBUTIONAL ESTIMATES
This appendix provides a more detailed explanation of the methodology used in this analysis and of our treatment of the Alternative Minimum Tax. It also discusses some of the issues surrounding multi-year distributional estimates. Finally, it provides tables showing the year-by-year distribution of the tax cuts.
Methodology
This analysis examines the distribution of the individual income tax and estate tax cuts enacted in 2001 and 2003 and associated Alternative Minimum Tax relief. (See below for a discussion of the AMT.) The Congressional Budget Office and the Joint Committee on Taxation have provided estimates of the cost of these tax cuts and their extension, and the Tax Policy Center has issued estimates of the distribution of the benefits of these provisions. We apply the Tax Policy Center’s distributional estimates to the cost estimates provided by CBO and the Joint Tax Committee.[3]
The Tax Policy Center provided estimates of the distribution of the tax cuts by income group for the years 2007, 2010, 2012, and 2017. We constructed approximate distributions for the intervening years. Because not all provisions of the tax cuts take full effect until 2010, we use the 2007 distributional estimates for the years 2008 and 2009. This means that our estimates of the shares of the tax cuts that will go to high-income households in those years are conservative, since several tax provisions that primarily benefit high-income households are phasing in over this period and, as a result, the overall distribution of the tax cuts is becoming gradually more skewed to the top.
For 2011, we take the average of the 2010 and 2012 tax cut shares going to each income group. Similarly, for the years 2013-2016, we smooth the change between the 2012 and 2017 distributional estimates; that is, we change the percentage share going to each group in each of these years by one fifth of the total change in that group’s share of the tax cuts between 2012 and 2017 (we apply the same percentage change to compute estimates for 2018). This method approximates the likely changes in the actual distribution over time, which would be steady and gradual (and largely reflect real income growth) once all the tax cut provisions were fully in effect.
Our Treatment of the Alternative Minimum Tax
The figures presented in this analysis are estimates of the benefits that the 2001 and 2003 tax cuts and their extension would provide to various income groups, assuming that the Alternative Minimum Tax relief that expired at the end of 2007 were extended.
If AMT relief were not extended, much of the value of the 2001 and 2003 tax cuts would be taken back by the AMT. This would occur because taxpayers owe the Alternative Minimum Tax whenever their tax liability, as calculated under the AMT, is higher than their tax liability under the regular income tax. The 2001 and 2003 tax cuts sharply reduced households’ tax liability under the regular income tax, without changing the structure of the AMT. As a result, with the tax cuts in place, AMT liability exceeds regular income tax liability for millions of additional households. These households then owe tax based on their AMT and not their regular income-tax liability, and hence do not benefit in full from the tax cuts.
According to the Urban Institute-Brookings Institution Tax Policy Center, the AMT will take back more than a quarter of the President’s tax cuts by 2010 if AMT relief is not extended. Put another way, much of the cost of providing AMT relief reflects the cost of providing taxpayers with the full value of the 2001 and 2003 tax cuts. Specifically, CBO estimates that, if the 2001 and 2003 tax cuts are extended, extending AMT relief through 2018 will cost $1.3 trillion. Tax Policy Center estimates indicate that almost two thirds of that cost reflects the cost of keeping the AMT from canceling out substantial portions of the 2001 and 2003 tax cuts.
The estimates in this analysis include the two thirds of the cost of AMT relief that reflects the cost of providing taxpayers with the full value of the 2001 and 2003 tax cuts. The estimates do not include the smaller portion of AMT relief that reflects the cost of addressing the AMT problem that preexisted the tax cuts.[4]
Multi-Year Distributional Estimates
The value of the multi-year distributional estimates presented in this analysis is that they allow us to examine the distribution of the 2001 and 2003 tax cuts over time and to make comparisons between the amounts being spent on tax reductions for households in various income groups and the amounts being spent on other policy goals.
Some may argue that the multi-year distributional estimates presented here are problematic because the composition of income groups changes over time. In other words, the households that will make up the top 1 percent of the population in 2009 are not all the same as the households that will make up the top 1 percent of the population in 2018. To the extent that households experience income changes over the ten-year period, the distribution of the tax cuts over time might be somewhat less skewed than these estimates show.
The available evidence suggests, however, that most households do not experience dramatic income shifts over the course of a decade. For example, a study that examined economic mobility over the course of the 1990s found that slightly more than half of those households that were in the bottom or top quintiles of the income scale at the beginning of the decade were in that same quintile at the end of the decade, and about three-quarters were in either the same or the next quintile.[5] Another study, by the Congressional Budget Office, compared distributional estimates of tax cuts based on annual measures of income with estimates based on multi-year measures. It concluded that “the choice of either a longitudinal or an annual metric to measure a potential policy’s effects would not dramatically shift the overall distribution of any of the changes CBO examined.” [6] A study by economists in the Treasury Department’s Office of Tax Analysis found similar results.[7]
End Notes
[1]Alan Greenspan in “US Representative Jim Nussle (R-IA) Holds Hearings on the Budget and the
Economy,” FDCH Political Transcripts, September 8, 2004.
[2] See William Gale, Peter Orszag, and Isaac Shapiro, “The Ultimate Burden of the Tax Cuts: Once the Tax Cuts Are Paid for, Low- and Middle-Income Households Likely to Be Net Losers, on Average,” Center on Budget and Policy Priorities, June 2, 2004.
[3] The Tax Policy Center’s distributional estimates are for calendar years, while the CBO and Joint Tax Committee cost estimates are for fiscal years. This discrepancy should have only a very small effect on our estimates.
[4] In addition, the estimates exclude the business tax cuts enacted in 2001 and 2003, such as Section 179 expensing, and also exclude several small provisions of the 2001 and 2003 tax cuts that were not included in the Tax Policy Center’s distributional estimates, such as the education-related tax cuts.
[5] Katharine Bradbury and Jane Katz, “Are Lifetime Incomes Growing More Unequal? Looking at New Evidence on Family Income Mobility,” Federal Reserve Bank of Boston Regional Review, vol. 12, no. 4, 2002.
[6] Congressional Budget Office, “Effective Tax Rates: Comparing Annual and Multiyear Measures,” January 2005.
[7] James Cilke, Julie-Anne Cronin, Janet McCubbin, James Nunns, and Paul Smith, “Distributional Analysis: A Longer Term Perspective,” in Proceedings of the 93rd Annual Conference on Taxation, National Tax Association, 2001.
More from the Authors