The Impact of State Income Taxes on Low-Income Families in 2009
Summary
State income taxes affect working-poor families in different ways. Some states’ tax codes help working-poor families lift themselves out of poverty. Others push them deeper into poverty. An analysis of state income tax systems for the 2009 tax year shows that:
- In 13 of the 42 states that levy income taxes, two-parent families of four with incomes below the federal poverty line are liable for income tax;
- In 11 states, poor single-parent families of three pay income tax;
- And 25 states collect taxes from families of four with incomes just above the poverty line.
These findings are based on the federal poverty line for 2009: $21,947 for a family of four and $17,102 for a family of three.
Some states levy income tax on working families in severe poverty. Five states — Alabama, Georgia, Illinois, Montana, andOhio — tax the income of two-parent families of four earning less than three-quarters of the poverty line ($16,460). And three states — Alabama, Georgia, and Montana — tax the income of one-parent families of three earning less than three-quarters of the poverty line ($12,827).
In some states, families living in poverty face yearly income tax bills of several hundred dollars. In 2009, a two-parent family of four with income at the poverty line owed $468 in Alabama, $266 in Hawaii, $225 in Iowa, and $225 in Montana. Such amounts can make a big difference to a family struggling to escape poverty. Other states levying tax of more than $150 on families with poverty-level incomes were Georgia, Illinois, Ohio, and Oregon.
At the other end of the spectrum, a growing number of states offer significant refunds to low-income working families, primarily through Earned Income Tax Credits (EITCs). Twenty-one states use the tax code to reduce poverty for families with two children and minimum-wage income, for example.
Over the last two decades, states have made significant progress in reducing the tax liabilities of low-income families. In 1991, over half of the states with an income tax levied taxes on two-parent, two-child families living with poverty-level income, whereas in 2009 fewer than one-third of these states levied taxes on such families.
There was important progress in 2009, as states implemented changes – mostly enacted before the recession – that reduced taxes for low-income working families. The number of states levying income tax on working-poor families of four declined from 16 states in 2008 to 13 states in 2009. And the taxes levied by those remaining 13 states also declined.
In the face of state fiscal problems, however, this progress has ground to a halt. Since the beginning of 2009, few states have enacted reforms to improve the tax treatment of low-income workers.
To some degree the slowing of progress has been inevitable. States’ balanced budget requirements and current dire fiscal conditions have restricted states’ ability to reduce taxes on poor families.
Nonetheless, doing so should remain a priority for states that still have such taxes. Taxing the incomes of working-poor families runs counter to the efforts of policymakers across the political spectrum to help families work their way out of poverty. The federal government has exempted such families from the income tax since the mid-1980s, and a majority of states now do so as well.
Eliminating state income taxes on working families with poverty-level incomes gives a boost in take-home pay that helps offset higher child care and transportation costs that families incur as they strive to become economically self-sufficient. In other words, relieving state income taxes on poor families can make a meaningful contribution toward “making work pay.”
Of particular concern, a number of states are considering budget balancing measures that would roll back targeted tax reductions for the working poor. New Jersey’s governor and Washington, D.C.’s mayor have proposed decreases in the EITC. Georgia’s legislature is considering eliminating the refundable portion of the state’s low-income credit. Virginia enacted a budget that prevents an increase in the federal EITC from flowing through to the state’s EITC. These changes would increase taxes on hundreds of thousands of poor and near-poor working families with children.
States have other gap-closing options at their disposal that do not reverse the progress they have made in mitigating the tax liabilities of low-income workers and that would be better for the economy.
Given these alternatives, states need not dismantle efforts to reduce poverty and encourage work. Rather they should preserve these efforts and build upon them when their fiscal situation improves.
Methodology
This analysis assesses the impact of each state’s income tax in 2009 on poor and near-poor families with children. Broad-based income taxes are levied in 41 states and the District of Columbia. Two family types are used in assessing taxes’ impact: a married couple with two dependent children, and a single parent with two dependent children.[1] The analysis focuses on two measures: the lowest income level at which state residents are required to pay income tax, and the tax due at various income levels. [2]
A benchmark used throughout this analysis is the federal poverty line — the annual estimate of the minimum financial resources required for a family to meet basic needs. The Census Bureau’s poverty line for 2009 was $17,102 for a family of three and $21,947 for a family of four. [3] It is generally acknowledged that attaining self-sufficiency requires an income level substantially higher than the federal poverty line, so if anything this analysis understates the extent to which state income tax provisions might impede the ability of poor families to move up the economic ladder.
Many States Continue to Levy Substantial Income Taxes on Poor Families
The Tax Threshold
One important measure of the impact of taxes on poor families is the income tax threshold — the point below which a family owes no income tax. Tables 1A and 1B show the thresholds for a single parent with two children and for a married couple with two children, respectively.
- In 11 states, the threshold is too low to exempt from income taxes a single-parent family of three at the $17,102 poverty line. In the remaining 31 states with income taxes, the threshold is above the poverty line, so families at that level of earnings pay no income tax or receive a refund.
- In 13 states, the threshold is too low to exempt from income taxes a two-parent family of four at the $21,947 poverty line. The remaining 29 states with income taxes have thresholds above the poverty line (See Figure 1).Image
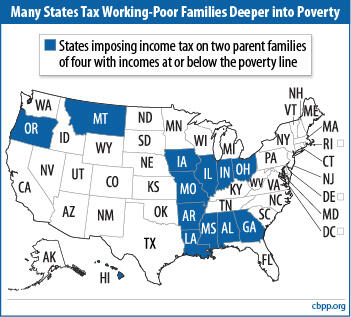
- Five states — Alabama, Georgia, Illinois, Montana, and Ohio — tax families of three or four in severe poverty, meaning those earning less than three-quarters of the federal poverty line. That income level in 2009 was $12,827 for a family of three and $16,460 for a family of four.
- While most states set income tax thresholds high enough to exempt from taxes a family of three where the employed person works full-time at the minimum wage, eight do require such a family to pay: Alabama, Georgia, Hawaii, Illinois, Missouri, Montana, Ohio, and Oregon.
- New York has the nation’s highest threshold for 2009. There is no income tax on a family of three making under $34,600 or a family of four making under $40,300. Those levels are well above the poverty lines for families of those sizes.
Taxes and Tax Credits for Poor Families
Several states charge those living in poverty several hundred dollars a year in income taxes — a substantial amount for a struggling family. Tables 2A, 2B, 3A, and 3B show these amounts.
- The tax bill for a poverty-line family of four exceeds $150 in eight states: Alabama, Georgia, Hawaii, Illinois, Iowa, Montana, Ohio, and Oregon.
- As noted above, a majority of states do not tax families with poverty-level income.
- There are 17 states that not only avoid taxing poor families but also offer tax credits that provide refunds to families of three or four with income at the poverty line. These are the 17 states shown at the bottom of Table 2A. These credits act as a wage supplement and income support, helping to assist families’ work efforts and reduce poverty. The amount of refund for families with income at the poverty line is as high as $1,940 for a family of four in New York.
- In addition to those 17, there are four other states that tax some or all families with incomes at the poverty line, but provide refundable credits to families with two children and full-time, minimum-wage income.
Taxes on Near-Poor Families
Studies have consistently found that the basic costs of living — food, clothing, housing, transportation, and health care — in most parts of the country exceed the federal poverty line, sometimes substantially.[4] So, many families with earnings above the official federal poverty line still have considerable difficulty making ends meet.
In recognition of the challenges faced by families with incomes somewhat above the poverty line, the federal government and state governments have set eligibility ceilings for some programs, such as energy assistance, school lunch subsidies, and in many states health care subsidies, at 125 percent of the poverty line ($21,378 for a family of three, $27,434 for a family of four in 2009) or above.
A majority of states, however, continue to levy income tax on families with incomes at 125 percent of the poverty line. Tables 4A and 4B show these amounts.
- In 25 states, two-parent families of four earning 125 percent of the poverty level are taxed, with the bill exceeding $500 in eight states: Alabama, Arkansas, Georgia, Hawaii, Iowa, Kentucky, Oregon, and West Virginia.
- Twenty-two states tax families of three with income at 125 percent of the poverty line.
How Can States Reduce Income Taxes on Poor Families?
States employ a variety of mechanisms to reduce income taxes on poor families. Nearly all states offer personal exemptions and/or standard deductions, which reduce the amount of income subject to taxation for all families, including those with low incomes. In a number of states, these provisions by themselves are sufficient to lift the income tax threshold above the poverty line. In addition, many states have enacted provisions targeted to low- and moderate-income families. To date, 24 states have established an Earned Income Tax Credit based on the federal EITC, which is a mechanism for reducing the tax obligation of working-poor families, mostly those with children.[5]
Why Does This Report Focus on the Income Tax — A Tax That Is Arguably the Fairest State Tax?
In most states, poor families pay more in consumption taxes, such as sales and gasoline taxes, than they do in income taxes. They also pay substantial amounts of property taxes and other taxes and fees. Why then does this report focus on the impact of state income taxes on poor families?
First, because the income tax is a major component of most state tax systems — making up 36 percent of total state tax revenue nationally — the design of a state’s income tax has a major effect on the overall fairness of the state’s tax system.
Second, it is administratively easier for states to target income tax cuts to poor families than it is to cut sales or property taxes on those families. That is because information on a taxpayer’s income is available at the time the income tax is levied. Sales tax, on the other hand, is collected by merchants from consumers with no knowledge of income level; and property taxes are passed through from landlords to renters. As a result, the most significant low-income tax relief at the state level in the past decade has come by means of the income tax.
Third, families trying to work their way out of poverty often face an effective tax on every additional dollar earned in the form of lost benefits such as income support, food stamps, Medicaid, or housing assistance. Income taxes on poor families can exacerbate this problem and send a negative message about the extent to which increased earnings will improve family well-being.
This report emphasizes that many states’ income taxes leave considerable room for improvement. But it is important to recognize that a state tax system that includes an income tax — even one with a relatively low income threshold — typically serves low-income families better than a state tax system that does not include an income tax at all. The reason is that most states’ income taxes, even those that tax the poor, are progressive; that is, income tax payments represent a smaller share of income for low-income families than for high-income families. By contrast, the other primary source of tax revenue for states, the sales tax, is regressive, consuming a larger share of the income of low-income families than of high-income families.
States that rely heavily on non-income taxes tend to have higher overall taxes on the poor than do other states. Seven states — Florida, Nevada, South Dakota, Tennessee, Texas, Washington, and Wyoming — do not appear in this report because they do not levy income taxes. Their heavy reliance on the sales tax renders their tax systems very burdensome for low-income families. Conversely, two states with income taxes but no general sales tax — Montana and Oregon — are shown in this report to impose above-average income tax burdens on the poor, despite some recent improvement. While there is room for further improvement in this aspect of their income taxes, these two states still have less regressive tax systems overall than the average state because they do not levy general sales taxes.
Some states offer other types of low-income tax credits, such as New Mexico’s Low-Income Comprehensive Tax Rebate. Finally, a few states have a “no-tax floor,” which sets a dollar level below which families owe no tax but does not affect tax liability for families above that level. A $20,000 no-tax floor, for example, means that a family making below that amount owes no taxes, but once income surpasses that level the tax is owed on all taxable income from one dollar up.
Most States Have Made Substantial Progress Since the Early 1990s, but Others Lag Severely Behind
Since the 1990s, Most States’ Income-Tax Treatment of the Poor Has Improved Greatly
While a substantial number of states continue to tax the poor, since the early 1990s, states generally have reduced the amount of tax owed by working-poor families. From 1991 to 2009, the number of states levying income tax on poor, two-parent families of four decreased to 13 from 24. Over that same span, the average of state tax thresholds increased to 120 percent of the poverty line from 84 percent. And many of the 13 states that still tax poor families of four have reduced the taxes levied. From 1994 to 2009, the average tax levied fell by 42 percent, after adjusting for inflation. Tables 5, and 6, and 7 show these changes over time.
From 2008 to 2009 alone, there was significant progress, based largely on measures enacted prior to the recession. Three states that previously levied income tax on poor families of four — Kentucky, North Carolina and West Virginia — no longer do so. And average taxes paid by families with incomes at the poverty line in the 13 states that still tax the poor declined by 18 percent.[6] Specific policy changes for 2009 include:
- Indiana increased its EITC from 6 percent to 9 percent of the federal credit. This change raised the state’s threshold for single-parent families of three above the poverty line, and significantly reduced the tax liabilities of poor, two-parent families of four.
- Michigan increased its EITC from 10 to 20 percent of the federal credit. This increase boosted the size of the rebate that the state provides to poor families by over $200.
- New Jersey increased its EITC from 22.5 percent to 25 percent of the federal credit, increasing the state’s threshold and the size of the tax rebate that the state provides to poor families.
- North Carolina increased its EITC from 3.5 percent to 5 percent of the federal credit, lifting the state’s threshold above the poverty line for a family of four.
- Oklahoma continued to phase in an increase in its standard deduction, lifting the state’s tax threshold further above the poverty line.
A Few States Tax the Incomes of the Poor More Heavily than in the Early 1990s
A smaller number of states stand out for their lack of progress between the early 1990s and 2009 in reducing income taxes on the poor and near-poor.
- In California, Connecticut, Mississippi, and Ohio, the income tax threshold has fallen compared to the poverty line since 1991. In Connecticut, the threshold has fallen over that time to 110 percent of the poverty line from 173 percent.
- In four states — Georgia, Iowa, Mississippi, and Ohio — the income tax on families of four with poverty-level incomes has risen since 1994 even after accounting for inflation. As Table 6 shows, the inflation-adjusted increase was 30 percent in Georgia and 3 percent in Ohio. In Iowa, such families’ tax liability increased to $225 from zero — the highest dollar increase in any state. In each of these states, the reason for the tax increase is that personal exemptions, credits, or other features designed to protect the incomes of low-income families from taxation have eroded due to inflation.
Progress Is Threatened in 2010
States’ fiscal troubles are significantly slowing their progress in reducing the tax liabilities of poor families. Faced with budget deficits, few states since 2009 have revised their tax systems to improve their tax treatment of low income families.
Beyond limiting new measures to reduce the tax liabilities of poor families, fiscal problems have prompted some states to consider measures that increase income taxes for poor and near-poor families. For example:
- Georgia’s legislature is considering eliminating the refundable portion of the state’s Low Income Credit. Under this proposal, a low-income taxpayer would not be able to claim the portion of the credit that exceeds his or her tax liability. Had this proposal been in effect in 2009, a two-parent, two-child family with income at half the federal poverty line ($10,974) would have lost its eligibility for a $32 tax credit.
- New Jersey’s governor has proposed cutting the state’s earned income tax credit from 25 to 20 percent of the federal credit. Had this occurred in 2009, a family of four with income at the poverty line would have lost almost $250.
- Virginia enacted a budget that requires that, in tax year 2010, families compute their state EITC based not on the current federal EITC but rather on the EITC as it existed under pre-2009 federal law. Had this change taken effect in 2009, a two-parent family with three children with income at 125 percent of the federal poverty line would have paid $205 in additional income taxes.
- Washington D.C.’s mayor has proposed reducing the city’s EITC from 40 to 39 percent of the federal credit. Had the District’s EITC been 39 percent of the federal credit in 2009, a family of four with income at the poverty line would have lost $49.
These measures would increase poverty and reduce the after-tax incomes of working families already hit hard by the recession. As a result, they would be more harmful to states’ economies than other budget-balancing measures. This is because lower-income people spend nearly all of the money they make, mainly on necessities. So for every dollar they lose, the total amount of spending in the economy drops by around a dollar. That puts more jobs at risk — such as at stores where low-income people shop — and weakens a recovery. By contrast, high-income people are generally able to save part of any extra income they receive. So for every dollar they lose in income, total spending drops by less than a dollar, say, 90 cents. Thus, tax increases that mostly affect higher-income families and corporations have less of an impact on aggregate demand and are better for the economy and jobs.[7]
Conclusion
Too many states continue to tax the income of poor families and in some cases, the poorest. Over time, states have made significant progress in improving the tax treatment of these families. In 2009, however, that progress slowed significantly, as fiscal problems constrained states’ ability to advance targeted tax reductions. To address budget deficits, some states have proposed or enacted tax policy changes that would reduce after-tax incomes for the working poor. This approach to budget balance is misguided. States have other gap-closing options at their disposal that do not reverse the progress they have made in mitigating the tax liabilities of low-income workers and would be better for the economy. Despite their fiscal troubles, states should prioritize preserving this progress and build upon it when their budget outlook improves.
| Table 1A: | |||
| Rank | State | Threshold | |
| 1 | Alabama | $9,800 | |
| 2 | Montana | 9,900 | |
| 3 | Georgia | 12,700 | |
| 4 | Hawaii | 13,800 | |
| 5 | Illinois | 14,400 | |
| 5 | Mississippi | 14,400 | |
| 5 | Missouri | 14,400 | |
| 8 | Ohio | 14,700 | |
| 9 | Arkansas | 15,200 | |
| 10 | Oregon | 16,700 | |
| 11 | Louisiana | 16,800 | |
| Poverty Line: $17,102 | |||
| 12 | Indiana | 18,300 | |
| 12 | Kentucky | 18,300 | |
| 12 | West Virginia | 18,300 | |
| 15 | Iowa | 18,800 | |
| 16 | North Carolina | 19,000 | |
| 17 | Connecticut | 19,100 | |
| 18 | Colorado | 19,300 | |
| 19 | Idaho | 19,400 | |
| 20 | North Dakota | 19,600 | |
| 21 | Utah | 19,700 | |
| 22 | Arizona | 20,100 | |
| 23 | Michigan | 22,300 | |
| 23 | Oklahoma | 22,300 | |
| 25 | Virginia | 23,000 | |
| 25 | Wisconsin | 23,000 | |
| 27 | Maine | 23,900 | |
| 28 | Pennsylvania | 25,500 | |
| 29 | South Carolina | 25,700 | |
| 30 | Massachusetts | 26,400 | |
| 31 | Delaware | 26,500 | |
| 32 | California | 26,600 | |
| 33 | Kansas | 27,100 | |
| 34 | Nebraska | 27,300 | |
| 35 | District of Columbia | 29,400 | |
| 36 | Rhode Island | 31,600 | |
| 37 | New Jersey | 32,300 | |
| 38 | Maryland | 32,400 | |
| 39 | Minnesota | 33,100 | |
| 39 | Vermont | 33,100 | |
| 41 | New Mexico | 33,800 | |
| 42 | New York | 34,600 | |
| Average Threshold 2009 | $22,000 | ||
| Amount Above Poverty Line | $4,898 | ||
| Note: A threshold is the lowest income level at which a family has state income tax liability. In this table thresholds are rounded to the nearest $100. The 2009 poverty line is a Census Bureau estimate based on the actual 2008 line adjusted for inflation. The threshold calculations include earned income tax credits, other general tax credits, exemptions, and standard deductions. Credits that are intended to offset the effects of taxes other than the income tax or that are not available to all low-income families are not taken into account. Source: Center on Budget and Policy Priorities | |||
| Table 1B: | ||
| Rank | State | Threshold |
| Montana | $12,000 | |
| 2 | Alabama | 12,600 |
| 3 | Georgia | 15,900 |
| 4 | Ohio | 16,200 |
| 5 | Illinois | 16,400 |
| 6 | Hawaii | 17,800 |
| 7 | Missouri | 18,100 |
| 8 | Iowa | 19,200 |
| 9 | Mississippi | 19,600 |
| 10 | Oregon | 19,800 |
| 11 | Indiana | 20,300 |
| 12 | Louisiana | 21,000 |
| 13 | Arkansas | 21,400 |
| Poverty Line: $21,947 | ||
| 14 | Kentucky | 22,100 |
| 14 | West Virginia | 22,100 |
| 16 | North Carolina | 23,200 |
| 17 | Arizona | 23,600 |
| 18 | Connecticut | 24,100 |
| 19 | Oklahoma | 25,800 |
| 20 | Colorado | 26,000 |
| 21 | Idaho | 26,100 |
| 22 | North Dakota | 26,300 |
| 23 | Utah | 26,500 |
| 24 | Michigan | 26,600 |
| 25 | Virginia | 27,400 |
| 26 | Maine | 28,200 |
| 27 | Wisconsin | 28,600 |
| 28 | Massachusetts | 29,500 |
| 29 | Kansas | 30,400 |
| 30 | California | 31,000 |
| 31 | Delaware | 31,700 |
| 32 | Pennsylvania | 32,000 |
| 33 | District of Columbia | 32,300 |
| 34 | South Carolina | 32,400 |
| 35 | Nebraska | 33,200 |
| 36 | New Jersey | 36,300 |
| 37 | Rhode Island | 36,500 |
| 38 | Maryland | 36,800 |
| 39 | Minnesota | 37,400 |
| 40 | Vermont | 38,700 |
| 41 | New Mexico | 39,500 |
| 42 | New York | 40,300 |
| Average Threshold 2009 | $26,300 | |
| Amount Above Poverty Line | $4,353 | |
| Note: A threshold is the lowest income level at which a family has state income tax liability. In this table thresholds are rounded to the nearest $100. The 2009 poverty line is a Census Bureau estimate based on the actual 2008 line adjusted for inflation. The threshold calculations include earned income tax credits, other general tax credits, exemptions, and standard deductions. Credits that are intended to offset the effects of taxes other than the income tax or that are not available to all low-income families are not taken into account. Source: Center on Budget and Policy Priorities | ||
| Table 2A: | |||
| Rank | State | Income | Tax |
| 1 | Alabama | $17,102 | $333 |
| 2 | Hawaii | 17,102 | 211 |
| 3 | Arkansas | 17,102 | 205 |
| 4 | Montana | 17,102 | 151 |
| 5 | Georgia | 17,102 | 141 |
| 6 | Ohio | 17,102 | 94 |
| 7 | Illinois | 17,102 | 89 |
| 8 | Mississippi | 17,102 | 81 |
| 9 | Missouri | 17,102 | 56 |
| 10 | Oregon | 17,102 | 34 |
| 11 | Louisiana | 17,102 | 19 |
| 12 | Arizona | 17,102 | 0 |
| 12 | California | 17,102 | 0 |
| 12 | Colorado | 17,102 | 0 |
| 12 | Connecticut | 17,102 | 0 |
| 12 | Delaware | 17,102 | 0 |
| 12 | Idaho | 17,102 | 0 |
| 12 | Kentucky | 17,102 | 0 |
| 12 | Maine | 17,102 | 0 |
| 12 | North Dakota | 17,102 | 0 |
| 12 | Pennsylvania | 17,102 | 0 |
| 12 | South Carolina | 17,102 | 0 |
| 12 | Utah | 17,102 | 0 |
| 12 | Virginia | 17,102 | 0 |
| 12 | West Virginia | 17,102 | 0 |
| 26 | Indiana | 17,102 | (62) |
| 27 | North Carolina | 17,102 | (131) |
| 28 | Iowa | 17,102 | (179) |
| 29 | Rhode Island | 17,102 | (183) |
| 30 | Oklahoma | 17,102 | (244) |
| 31 | Michigan | 17,102 | (441) |
| 32 | Nebraska | 17,102 | (488) |
| 33 | Wisconsin | 17,102 | (515) |
| 34 | New Mexico | 17,102 | (548) |
| 35 | Kansas | 17,102 | (703) |
| 36 | Massachusetts | 17,102 | (732) |
| 37 | Maryland | 17,102 | (1,058) |
| 38 | New Jersey | 17,102 | (1,220) |
| 39 | Minnesota | 17,102 | (1,257) |
| 40 | Vermont | 17,102 | (1,562) |
| 41 | District of Columbia | 17,102 | (1,695) |
| 42 | New York | 17,102 | (1,939) |
| Source: Center on Budget and Policy Priorities | |||
| Table 2B: | |||
| Rank | State | Income | Tax |
| 1 | Alabama | $21,947 | $468 |
| 2 | Hawaii | 21,947 | 266 |
| 3 | Iowa | 21,947 | 225 |
| 3 | Montana | 21,947 | 225 |
| 5 | Georgia | 21,947 | 218 |
| 6 | Oregon | 21,947 | 200 |
| 7 | Illinois | 21,947 | 172 |
| 8 | Ohio | 21,947 | 159 |
| 9 | Missouri | 21,947 | 89 |
| 10 | Arkansas | 21,947 | 83 |
| 11 | Mississippi | 21,947 | 70 |
| 12 | Indiana | 21,947 | 65 |
| 13 | Louisiana | 21,947 | 21 |
| 14 | Arizona | 21,947 | 0 |
| 14 | California | 21,947 | 0 |
| 14 | Colorado | 21,947 | 0 |
| 14 | Connecticut | 21,947 | 0 |
| 14 | Delaware | 21,947 | 0 |
| 14 | Idaho | 21,947 | 0 |
| 14 | Kentucky | 21,947 | 0 |
| 14 | Maine | 21,947 | 0 |
| 14 | North Dakota | 21,947 | 0 |
| 14 | Pennsylvania | 21,947 | 0 |
| 14 | South Carolina | 21,947 | 0 |
| 14 | Utah | 21,947 | 0 |
| 14 | Virginia | 21,947 | 0 |
| 14 | West Virginia | 21,947 | 0 |
| 28 | North Carolina | 21,947 | (91) |
| 29 | Rhode Island | 21,947 | (185) |
| 30 | Oklahoma | 21,947 | (198) |
| 31 | Michigan | 21,947 | (395) |
| 32 | Nebraska | 21,947 | (492) |
| 33 | New Mexico | 21,947 | (527) |
| 34 | Wisconsin | 21,947 | (567) |
| 35 | Kansas | 21,947 | (595) |
| 36 | Massachusetts | 21,947 | (618) |
| 37 | New Jersey | 21,947 | (994) |
| 38 | Maryland | 21,947 | (1,004) |
| 39 | District of Columbia | 21,947 | (1,496) |
| 40 | Vermont | 21,947 | (1,575) |
| 41 | Minnesota | 21,947 | (1,759) |
| 42 | New York | 21,947 | (1,940) |
| Source: Center on Budget and Policy Priorities | |||
| Table 3A: | |||
| Rank | State | Income* | Tax |
| 1 | Alabama | $14,231 | $188 |
| 2 | Hawaii** | 15,080 | 98 |
| 3 | Montana** | 14,655 | 74 |
| 4 | Oregon** | 17,472 | 66 |
| 5 | Illinois** | 16,380 | 60 |
| 6 | Ohio** | 15,184 | 46 |
| 7 | Georgia | 14,231 | 34 |
| 8 | Missouri** | 14,837 | 8 |
| 9 | Arizona** | 15,080 | 0 |
| 9 | Arkansas | 14,231 | 0 |
| 9 | California** | 16,640 | 0 |
| 9 | Colorado** | 15,142 | 0 |
| 9 | Connecticut** | 16,640 | 0 |
| 9 | Delaware** | 14,959 | 0 |
| 9 | Idaho | 14,231 | 0 |
| 9 | Kentucky** | 14,352 | 0 |
| 9 | Maine** | 15,210 | 0 |
| 9 | Mississippi | 14,231 | 0 |
| 9 | North Dakota | 14,231 | 0 |
| 9 | Pennsylvania** | 14,959 | 0 |
| 9 | South Carolina | 14,231 | 0 |
| 9 | Utah | 14,231 | 0 |
| 9 | Virginia | 14,231 | 0 |
| 9 | West Virginia | 14,231 | 0 |
| 25 | Louisiana | 14,231 | (106) |
| 26 | Indiana | 14,231 | (173) |
| 27 | Rhode Island** | 15,392 | (189) |
| 28 | North Carolina | 14,231 | (251) |
| 28 | Oklahoma | 14,231 | (251) |
| 30 | Iowa** | 15,080 | (352) |
| 31 | Nebraska | 14,231 | (503) |
| 32 | Michigan** | 15,392 | (545) |
| 33 | New Mexico** | 15,600 | (573) |
| 34 | Wisconsin | 14,231 | (701) |
| 35 | Massachusetts** | 16,640 | (748) |
| 36 | Kansas | 14,231 | (830) |
| 37 | Maryland | 14,231 | (1,218) |
| 38 | Minnesota | 14,231 | (1,257) |
| 38 | New Jersey** | 14,959 | (1,257) |
| 40 | Vermont** | 16,765 | (1,585) |
| 41 | District of Columbia** | 16,311 | (1,786) |
| 42 | New York** | 14,959 | (2,001) |
| * Income reflects full-time, year-round minimum wage earnings for one worker (52 weeks, 40 hours/week). | |||
| Table 3B: | |||
| Rank | State | Income* | Tax |
| 1 | Alabama | $14,231 | $50 |
| 2 | Montana** | 14,655 | 28 |
| 3 | Arizona** | 15,080 | 0 |
| 3 | Arkansas | 14,231 | 0 |
| 3 | California** | 16,640 | 0 |
| 3 | Colorado** | 15,142 | 0 |
| 3 | Connecticut** | 16,640 | 0 |
| 3 | Delaware** | 14,959 | 0 |
| 3 | Idaho | 14,231 | 0 |
| 3 | Illinois** | 16,380 | 0 |
| 3 | Kentucky** | 14,352 | 0 |
| 3 | Maine** | 15,210 | 0 |
| 3 | Mississippi | 14,231 | 0 |
| 3 | Missouri** | 14,837 | 0 |
| 3 | North Dakota | 14,231 | 0 |
| 3 | Ohio** | 15,184 | 0 |
| 3 | Pennsylvania** | 14,959 | 0 |
| 3 | South Carolina | 14,231 | 0 |
| 3 | Utah | 14,231 | 0 |
| 3 | Virginia | 14,231 | 0 |
| 3 | West Virginia | 14,231 | 0 |
| 22 | Georgia | 14,231 | (32) |
| 23 | Hawaii** | 15,080 | (89) |
| 24 | Louisiana | 14,231 | (176) |
| 25 | Oregon** | 17,472 | (179) |
| 26 | Rhode Island** | 15,392 | (189) |
| 27 | Indiana | 14,231 | (207) |
| 28 | North Carolina | 14,231 | (251) |
| 28 | Oklahoma | 14,231 | (251) |
| 30 | Iowa** | 15,080 | (352) |
| 31 | Nebraska | 14,231 | (503) |
| 32 | New Mexico** | 15,600 | (588) |
| 33 | Michigan** | 15,392 | (701) |
| 34 | Wisconsin | 14,231 | (704) |
| 35 | Massachusetts** | 16,640 | (754) |
| 36 | Kansas | 14,231 | (855) |
| 37 | Maryland | 14,231 | (1,257) |
| 37 | Minnesota | 14,231 | (1,257) |
| 37 | New Jersey** | 14,959 | (1,257) |
| 40 | Vermont** | 16,765 | (1,609) |
| 41 | District of Columbia** | 16,311 | (1,786) |
| 42 | New York** | 14,959 | (2,100) |
| * Income reflects full-time, year-round minimum wage earnings for one worker (52 weeks, 40 hours/week). | |||
| Table 4A: | |||
| Rank | State | Income | Tax |
| 1 | Alabama | $21,378 | $608 |
| 2 | Arkansas | 21,378 | 525 |
| 3 | West Virginia | 21,378 | 514 |
| 4 | Hawaii | 21,378 | 483 |
| 5 | Oregon | 21,378 | 449 |
| 6 | Kentucky | 21,378 | 433 |
| 7 | Georgia | 21,378 | 361 |
| 8 | Montana | 21,378 | 306 |
| 9 | Illinois | 21,378 | 262 |
| 10 | Mississippi | 21,378 | 229 |
| 11 | Iowa | 21,378 | 225 |
| 12 | Louisiana | 21,378 | 221 |
| 13 | Missouri | 21,378 | 218 |
| 14 | Ohio | 21,378 | 210 |
| 15 | North Carolina | 21,378 | 169 |
| 16 | Indiana | 21,378 | 164 |
| 17 | Utah | 21,378 | 109 |
| 18 | Colorado | 21,378 | 95 |
| 19 | Arizona | 21,378 | 84 |
| 20 | North Dakota | 21,378 | 38 |
| 21 | Idaho | 21,378 | 33 |
| 22 | Connecticut | 21,378 | 18 |
| 23 | California | 21,378 | 0 |
| 23 | Delaware | 21,378 | 0 |
| 23 | Maine | 21,378 | 0 |
| 23 | Pennsylvania | 21,378 | 0 |
| 23 | South Carolina | 21,378 | 0 |
| 23 | Virginia | 21,378 | 0 |
| 29 | Oklahoma | 21,378 | (51) |
| 30 | Michigan | 21,378 | (76) |
| 31 | Rhode Island | 21,378 | (138) |
| 32 | Wisconsin | 21,378 | (151) |
| 33 | Nebraska | 21,378 | (333) |
| 34 | Massachusetts | 21,378 | (400) |
| 35 | Kansas | 21,378 | (401) |
| 36 | New Mexico | 21,378 | (423) |
| 37 | Maryland | 21,378 | (641) |
| 38 | New Jersey | 21,378 | (753) |
| 39 | District of Columbia | 21,378 | (1,154) |
| 40 | Vermont | 21,378 | (1,202) |
| 41 | New York | 21,378 | (1,500) |
| 42 | Minnesota | 21,378 | (1,573) |
| Source: Center on Budget and Policy Priorities | |||
| Table 4B: | |||
| Rank | State | Income | Tax |
| 1 | Kentucky | $27,434 | $840 |
| 2 | Alabama | 27,434 | 838 |
| 3 | Arkansas | 27,434 | 768 |
| 4 | Oregon | 27,434 | 764 |
| 5 | West Virginia | 27,434 | 678 |
| 6 | Iowa | 27,434 | 645 |
| 7 | Hawaii | 27,434 | 570 |
| 8 | Georgia | 27,434 | 523 |
| 9 | Montana | 27,434 | 457 |
| 10 | Illinois | 27,434 | 395 |
| 11 | Indiana | 27,434 | 356 |
| 12 | Missouri | 27,434 | 341 |
| 13 | Ohio | 27,434 | 336 |
| 14 | North Carolina | 27,434 | 297 |
| 15 | Mississippi | 27,434 | 263 |
| 16 | Louisiana | 27,434 | 218 |
| 17 | Arizona | 27,434 | 186 |
| 18 | Oklahoma | 27,434 | 103 |
| 19 | Michigan | 27,434 | 75 |
| 20 | Colorado | 27,434 | 67 |
| 21 | Utah | 27,434 | 62 |
| 22 | North Dakota | 27,434 | 26 |
| 22 | Connecticut | 27,434 | 26 |
| 24 | Idaho | 27,434 | 23 |
| 25 | Virginia | 27,434 | 9 |
| 26 | California | 27,434 | 0 |
| 26 | Delaware | 27,434 | 0 |
| 26 | Maine | 27,434 | 0 |
| 26 | Pennsylvania | 27,434 | 0 |
| 26 | South Carolina | 27,434 | 0 |
| 31 | Wisconsin | 27,434 | (101) |
| 32 | Rhode Island | 27,434 | (122) |
| 33 | Massachusetts | 27,434 | (171) |
| 34 | Kansas | 27,434 | (205) |
| 35 | Nebraska | 27,434 | (324) |
| 36 | New Mexico | 27,434 | (376) |
| 37 | Maryland | 27,434 | (489) |
| 38 | New Jersey | 27,434 | (618) |
| 39 | District of Columbia | 27,434 | (702) |
| 40 | Vermont | 27,434 | (1,153) |
| 41 | New York | 27,434 | (1,372) |
| 42 | Minnesota | 27,434 | (1,559) |
| Source: Center on Budget and Policy Priorities | |||
| Table 5: Tax Threshold for a Family of Four, 1991-2009 | |||||||
| State | 1991 | 2000 | 2007 | 2008 | 2009 | Change 1991-2009 | Change 2008-2009 |
| Arizona | 15,000 | 23,600 | 23,600 | $23,600 | $23,600 | $8,600 | $0 |
| Arkansas | 10,700 | 15,600 | 20,700 | $21,300 | $21,400 | $10,700 | $100 |
| California | 20,900 | 36,800 | 46,100 | $48,300 | $31,000 | $10,100 | -$17,300 |
| Colorado | 14,300 | 27,900 | 24,300 | $24,900 | $26,000 | $11,700 | $1,100 |
| Connecticut | 24,100 | 24,100 | 24,100 | $24,100 | $24,100 | $0 | $0 |
| Delaware | 8,600 | 20,300 | 29,300 | $30,100 | $31,700 | $23,100 | $1,600 |
| District of Columbia | 14,300 | 18,600 | 27,300 | $30,200 | $32,300 | $18,000 | $2,100 |
| Georgia | 9,000 | 15,300 | 15,900 | $15,900 | $15,900 | $6,900 | $0 |
| Hawaii | 6,300 | 11,000 | 14,000 | $17,800 | $17,800 | $11,500 | $0 |
| Idaho | 14,300 | 20,100 | 24,400 | $25,000 | $26,100 | $11,800 | $1,100 |
| Illinois | 4,000 | 14,000 | 15,900 | $16,000 | $16,400 | $12,400 | $400 |
| Indiana | 4,000 | 9,500 | 15,300 | $15,500 | $20,300 | $16,300 | $4,800 |
| Iowa | 9,000 | 17,400 | 18,700 | $19,000 | $19,200 | $10,200 | $200 |
| Kansas | 13,000 | 21,100 | 27,600 | $28,500 | $30,400 | $17,400 | $1,900 |
| Kentucky | 5,000 | 5,400 | 20,700 | $21,200 | $22,100 | $17,100 | $900 |
| Louisiana | 11,000 | 13,000 | 17,500 | $20,300 | $21,000 | $10,000 | $700 |
| Maine | 14,100 | 23,100 | 27,000 | $27,800 | $28,200 | $14,100 | $400 |
| Maryland | 15,800 | 25,200 | 32,000 | $34,300 | $36,800 | $21,000 | $2,500 |
| Massachusetts | 12,000 | 20,600 | 27,100 | $28,100 | $29,500 | $17,500 | $1,400 |
| Michigan | 8,400 | 12,800 | 14,800 | $23,800 | $26,600 | $18,200 | $2,800 |
| Minnesota | 15,500 | 26,800 | 34,500 | $35,900 | $37,400 | $21,900 | $1,500 |
| Mississippi | 15,900 | 19,600 | 19,600 | $19,600 | $19,600 | $3,700 | $0 |
| Missouri | 8,900 | 14,100 | 17,400 | $17,600 | $18,100 | $9,200 | $500 |
| Montana | 6,600 | 9,500 | 11,600 | $12,200 | $12,000 | $5,400 | -$200 |
| Nebraska | 14,300 | 18,900 | 30,200 | $31,200 | $33,200 | $18,900 | $2,000 |
| New Jersey | 5,000 | 20,000 | 30,800 | $32,900 | $36,300 | $31,300 | $3,400 |
| New Mexico | 14,300 | 21,000 | 35,900 | $37,400 | $39,500 | $25,200 | $2,100 |
| New York | 14,000 | 23,800 | 37,200 | $38,300 | $40,300 | $26,300 | $2,000 |
| North Carolina | 13,000 | 17,000 | 19,400 | $21,800 | $23,200 | $10,200 | $1,400 |
| North Dakota | 14,700 | 19,000 | 24,800 | $25,400 | $26,300 | $11,600 | $900 |
| Ohio | 10,500 | 12,700 | 15,800 | $16,000 | $16,200 | $5,700 | $200 |
| Oklahoma | 10,000 | 13,000 | 20,500 | $23,500 | $25,800 | $15,800 | $2,300 |
| Oregon | 10,100 | 14,800 | 18,000 | $18,900 | $19,800 | $9,700 | $900 |
| Pennsylvania | 9,800 | 28,000 | 32,000 | $32,000 | $32,000 | $22,200 | $0 |
| Rhode Island | 17,400 | 25,900 | 32,600 | $34,000 | $36,500 | $19,100 | $2,500 |
| South Carolina | 14,300 | 21,400 | 30,400 | $31,100 | $32,400 | $18,100 | $1,300 |
| Utah | 12,200 | 15,800 | 24,300 | $25,300 | $26,500 | $14,300 | $1,200 |
| Vermont | 17,400 | 26,800 | 34,400 | $35,800 | $38,700 | $21,300 | $2,900 |
| Virginia | 8,200 | 17,100 | 24,800 | $25,800 | $27,400 | $19,200 | $1,600 |
| West Virginia | 8,000 | 10,000 | 10,000 | $21,200 | $22,100 | $14,100 | $900 |
| Wisconsin | 14,400 | 20,700 | 26,000 | $26,800 | $28,600 | $14,200 | $1,800 |
| Average | $11,736 | $18,474 | $24,026 | $25,500 | $26,307 | $14,571 | $807 |
| Federal Poverty Line | $13,924 | $17,603 | $21,203 | $22,017 | $21,947 | $8,023 | -$70 |
| Average as % Poverty Line | 84% | 105% | 113% | 116% | 120% | 36% | 4% |
| Number Above Poverty Line | 18 | 23 | 24 | 26 | 29 | 11 | 3 |
| Number Below Poverty Line | 24 | 19 | 18 | 16 | 13 | -11 | -3 |
| Source: Center on Budget and Policy Priorities | |||||||
| Table 6: | |||||||||
| State | 1994 | 2000 | 2007 | 2008 | 2009 | Change | Percent change after inflation | $ Change | Percent change after Inflation |
| Montana | $211 | $233 | $217 | $220 | $225 | 5 | 3% | 14 | -26% |
| Mississippi | 0 | 0 | 48 | 73 | 70 | (3) | -4% | 70 | — |
| Georgia | 116 | 55 | 184 | 223 | 218 | (5) | -2% | 102 | 30% |
| Ohio | 107 | 113 | 161 | 168 | 159 | (9) | -5% | 52 | 3% |
| Arkansas | 214 | 311 | 63 | 95 | 83 | (12) | -12% | (131) | -73% |
| Alabama | 348 | 443 | 423 | 483 | 468 | (15) | -3% | 120 | -7% |
| Missouri | 147 | 80 | 89 | 109 | 89 | (20) | -18% | (58) | -58% |
| Louisiana | 83 | 133 | 179 | 53 | 21 | (32) | -60% | (62) | -83% |
| Illinois | 334 | 145 | 201 | 214 | 172 | (42) | -19% | (162) | -64% |
| Iowa | 0 | 23 | 251 | 268 | 225 | (43) | -16% | 225 | — |
| Oregon | 331 | 278 | 325 | 311 | 200 | (111) | -35% | (131) | -58% |
| Indiana | 379 | 360 | 248 | 263 | 65 | (198) | -75% | (314) | -88% |
| Hawaii | 406 | 420 | 409 | 272 | 266 | (6) | -2% | (140) | -55% |
| Average | $206 | $200 | $215 | $212 | $174 | ($38) | -18% | ($32) | -42% |
| Notes: Dollar amounts shown are nominal amounts. | |||||||||
| Table 7: | ||||||
| State | 1991 | 2001 | 2008 | 2009 | % Point Change | % Point Change |
| Alabama | 33% | 25% | 57% | 57% | 24% | 0% |
| Arizona | 108% | 130% | 107% | 108% | 0% | 1% |
| Arkansas | 77% | 86% | 97% | 98% | 21% | 1% |
| California | 150% | 214% | 219% | 141% | -9% | -78% |
| Colorado | 103% | 159% | 113% | 118% | 15% | 5% |
| Connecticut | 173% | 133% | 109% | 110% | -63% | 1% |
| Delaware | 62% | 112% | 137% | 144% | 82% | 7% |
| District of Columbia | 103% | 108% | 137% | 147% | 44% | 10% |
| Georgia | 65% | 85% | 72% | 72% | 7% | 0% |
| Hawaii | 45% | 62% | 81% | 81% | 36% | 0% |
| Idaho | 103% | 115% | 114% | 119% | 16% | 5% |
| Illinois | 29% | 79% | 73% | 75% | 46% | 2% |
| Indiana | 29% | 52% | 70% | 92% | 63% | 22% |
| Iowa | 65% | 97% | 86% | 87% | 22% | 1% |
| Kansas | 93% | 119% | 129% | 139% | 46% | 10% |
| Kentucky | 36% | 30% | 96% | 101% | 65% | 5% |
| Louisiana | 79% | 74% | 92% | 96% | 17% | 4% |
| Maine | 101% | 130% | 126% | 128% | 27% | 2% |
| Maryland | 113% | 145% | 156% | 168% | 55% | 12% |
| Massachusetts | 86% | 125% | 128% | 134% | 48% | 6% |
| Michigan | 60% | 71% | 108% | 121% | 61% | 13% |
| Minnesota | 111% | 153% | 163% | 170% | 59% | 7% |
| Mississippi | 114% | 108% | 89% | 89% | -25% | 0% |
| Missouri | 64% | 79% | 80% | 82% | 18% | 2% |
| Montana | 47% | 54% | 55% | 55% | 8% | 0% |
| Nebraska | 103% | 108% | 142% | 151% | 48% | 9% |
| New Jersey | 36% | 110% | 149% | 165% | 129% | 16% |
| New Mexico | 103% | 118% | 170% | 180% | 77% | 10% |
| New York | 101% | 138% | 174% | 184% | 83% | 10% |
| North Carolina | 93% | 94% | 99% | 106% | 13% | 7% |
| North Dakota | 106% | 109% | 115% | 120% | 14% | 5% |
| Ohio | 75.4% | 69% | 73% | 74% | -1% | 1% |
| Oklahoma | 72% | 74% | 107% | 118% | 46% | 11% |
| Oregon | 73% | 83% | 86% | 90% | 17% | 4% |
| Pennsylvania | 70% | 166% | 145% | 146% | 76% | 1% |
| Rhode Island | 125% | 148% | 154% | 166% | 41% | 12% |
| South Carolina | 103% | 122% | 141% | 148% | 45% | 7% |
| Utah | 88% | 90% | 115% | 121% | 33% | 6% |
| Vermont | 125% | 152% | 163% | 176% | 51% | 13% |
| Virginia | 59% | 98% | 117% | 125% | 66% | 8% |
| West Virginia | 57% | 55% | 96% | 101% | 44% | 5% |
| Wisconsin | 103% | 119% | 122% | 130% | 27% | 8% |
| Average | 84% | 105% | 116% | 120% | 36% | 4% |
| Source: Center on Budget and Policy Priorities | ||||||
End Notes
[1] The married couple is assumed to file a joint return on its federal and state tax forms, and the single parent is assumed to file as a Head of Household. A few states have different tax treatment for married couples with two workers, so each family is assumed to include one worker. For the few states where tax treatment depends on the age of children, the children are taken to be ages four and eleven.
[2] This report takes into account income tax provisions that are broadly available to low-income families and that are not intended to offset some other tax. It does not take into account tax credits or deductions that benefit only families with certain expenses; nor does it take into account provisions that are intended explicitly to offset taxes other than the income tax. For instance, it does not include the impact of tax provisions that are available only to families with out-of-pocket child care expenses or specific housing costs, because not all families face such costs. It also does not take into account sales tax credits, property tax “circuit breakers,” and similar provisions, because this analysis does not attempt to gauge the impact of those taxes — only of income taxes.
[3] Specifically, this report uses the Census Bureau’s weighted average poverty thresholds, available at http://www.census.gov/hhes/www/poverty/threshld/09prelim.html.
[4] See, for example, Sylvia A. Allegretto, Basic Family Budgets: Working Families’ Incomes Often Fail to Meet Living Expenses Around the U.S., Economic Policy Institute, September 2005.
[5] The 24 states are the District of Columbia, Delaware, Illinois, Indiana, Iowa, Kansas, Louisiana, Maine, Maryland, Massachusetts, Michigan, Minnesota, Nebraska, New Jersey, New Mexico, New York, North Carolina, Oklahoma, Oregon, Rhode Island, Vermont, Virginia, Washington, and Wisconsin. For more information on state EITCs, see Erica Williams, Nicholas Johnson, and Jon Shure, “State Earned Income Tax Credits: 2009 Legislative Update,” Center on Budget and Policy Priorities, Nov. 10, 2009.
[6] To some degree, the improvement in state tax treatment of poverty-line families occurred because the federal poverty line, which is adjusted annually for the Consumer Price Index, declined in 2009. Many states’ tax parameters are also tied to the Consumer Price Index (directly or indirectly through the federal tax code), but with a one-year lag, so the parameters increased in 2009 because the CPI increased in 2008. For 2010, the reverse is likely to be true: the federal poverty line will probably increase to reflect the fact that prices are again rising, but many states’ tax parameters will not increase, so families with poverty-line income will pay more tax.
[7] This point – made by, among others, Nobel Prize winner Joseph Stiglitz of Columbia University and Peter Orszag, now the director of the Office of Management and Budget – is explained more fully in “Budget Cuts or Tax Increases at the State Level: Which is Preferable During a Recession?” Center on Budget and Policy Priorities, https://www.cbpp.org/cms/?fa=view&id=1032.
More from the Authors