Testimony of Robert Greenstein, President, Center on Budget and Policy Priorities Before the House Committee on Agriculture
Thank you for the invitation to testify today. I am Robert Greenstein, president of the Center on Budget and Policy Priorities, a policy institute in Washington, D.C. that conducts research and analysis on budget, tax, and economic policy, policies related to poverty, and a number of social programs. The Center has no government contracts and accepts no government funds.
I’ve had a long history of involvement with the nation’s food assistance programs and the Supplemental Nutrition Assistance Program (SNAP) in particular. I had the privilege of serving as special assistant for food assistance policy to the Secretary of Agriculture in 1977 and 1978 and as Administrator of the Food and Nutrition Service at USDA, which oversees SNAP and other food assistance programs, in 1979 and 1980.
My first invitation to testify before Congress came from this committee, for a hearing on food stamps some 40 years ago, in early 1975. It has been a great privilege to work closely with Members of both parties over the years on food stamps.
My testimony today is divided into three sections: 1) SNAP’s track record; 2) a discussion of program growth; and 3) an assessment of issues related to SNAP and employment.
I. The Program’s Track Record
SNAP has played a central role in largely eliminating severe hunger and malnutrition in the United States. We often forget how serious those problems used to be. In the late 1960s, the Field Foundation sponsored a team of doctors and medical researchers who examined hunger and malnutrition, especially among poor children, in Appalachia, areas of the South, and other very poor areas. This research was conducted before the Food Stamp Program had started in much of the country. The doctors then returned to the same areas in the late 1970s for another examination. Their findings from the late 1970s, issued in what became a famous report, speak for themselves:
In the Mississippi delta, in the coal fields of Appalachia and in coastal South Carolina — where visitors ten years ago could quickly see large numbers of stunted, apathetic children with swollen stomachs and the dull eyes and poorly healing wounds characteristic of malnutrition — such children are not to be seen in such numbers. Even in areas which did not command national attention ten years ago, many poor people now have food….[1]
The medical researchers credited food stamps as being the single largest factor responsible for this progress, concluding that “no program does more to lengthen and strengthen the lives of our people than the Food Stamp Program.” Findings such as this led then-Senator Robert Dole to describe the Food Stamp Program as the most important advance in the nation’s social programs since the creation of Social Security.
Consistent with its original purpose, SNAP continues to provide a basic nutrition benefit to low-income families and people who are elderly or have disabilities and can’t afford an adequate diet. Recent studies show that SNAP has a marked effect in reducing what analysts call “food insecurity,” particularly among high-risk children. In addition, a recent demonstration project in which SNAP benefits were raised in summer months for families with school children who don’t receive school meals during that time found that the added SNAP benefits cut by one-third the percentage of children who skipped meals or otherwise ate less because their families lacked adequate resources.
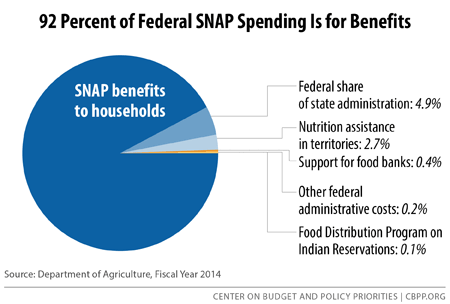
In important respects, today’s program is stronger than at any previous point. By taking advantage of modern technology and business practices, SNAP has become substantially more efficient and accurate (its error rate is at its lowest level on record), while keeping administrative costs modest. (Some 92 percent of federal SNAP expenditures go for benefits to enable households to purchase food.) While many low-income Americans continue to struggle, this would be a very different country without SNAP.
An Overview of SNAP
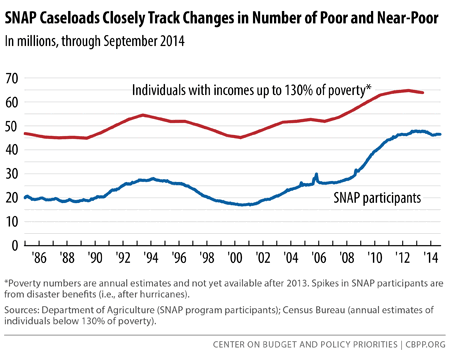
As of the end of 2014, SNAP was helping more than 46 million low-income Americans to afford a nutritionally adequate diet by providing them with benefits via a debit card that can be used only to purchase food. The benefits are relatively modest. SNAP participants receive an average benefit of $1.42 per person per meal.
Eligible people who apply can receive benefits, and when poverty and need increase, the program expands. Then when the economy grows robustly again, the program contracts. This enables SNAP to respond quickly and effectively during times of economic downturn and increased need.
SNAP can respond immediately to help families bridge temporary periods of unemployment or a family crisis. If a parent loses her job, SNAP can help her feed her children until she is able to improve her circumstances. A USDA study of SNAP participation from 2008 to 2012 found that half of all new entrants to SNAP participated for one year and then left the program when their need passed.
SNAP’s ability to respond quickly to changes in need is also important when natural disasters strike. States can provide emergency SNAP within a matter of days to help disaster victims purchase food. After the devastating 2005 hurricanes Katrina, Rita, and Wilma, SNAP provided several million people with temporary food assistance.[2]
SNAP’s caseloads grew in recent years primarily because more households qualified for SNAP due to the recession and very sluggish recovery that followed until recently, and also because more of the households that were eligible applied for assistance. The Congressional Budget Office (CBO) has found that “the primary reason for the increase in the number of participants was the deep recession . . . and subsequent slow recovery; there were no significant legislative expansions of eligibility.”[3]
This responsiveness in recessions also benefits the economy, by helping to maintain overall demand for food when the economy falters. CBO and Moody’s Analytics rate SNAP expenditures as one of the most effective supports for the economy during economic downturns. CBO has observed that increases in SNAP expenditures during economic slumps have one of the biggest “bangs for the buck” of any of a broad range of possible fiscal policies for shoring up a weak economy; in other words, SNAP’s expansion in recessions produces some of the largest increases in economic activity and employment per budgetary dollar expended.
Also of note is the program’s progress in reducing error rates. Despite the caseload growth of recent years, the program’s error rate has come down steadily and is now at its lowest level on record. Fewer than 1 percent of benefits are provided to households that should have been found ineligible. The overall net loss to the Treasury due to SNAP errors (which reflects overpayments to households that should have been found ineligible or that received too large a benefit, minus underpayments to households given too small a benefit) equaled 2 percent in 2013, a very low percentage for a program of its size. (See the box on page 7 of this testimony for a further discussion of this issue.)
The National Journal has rated SNAP one of the government’s most successful programs, citing both its responsiveness to people in need and its low error and fraud rates. The program is a “case study in effective government aid,” National Journal concluded.
SNAP participation and spending have now begun to decline as the economic recovery has finally begun to reach some low-income SNAP participants. Fewer people participated in SNAP in each of the last 15 months for which data are available (September 2013 through November 2014) than in the same month one year earlier. Some 1.5 million fewer people participated in SNAP in November 2014 than when participation peaked in December 2012. I will discuss program growth and cost trends in more detail later in this testimony.
Targeting Benefits by Need
SNAP targets benefits on those most in need and least able to afford an adequate diet. Its benefit formula considers a household’s income level, along with its essential expenses such as rent, medicine, and child care needed to work. Although a family’s income is the most important factor affecting its ability to purchase food, it is not the only factor; a family whose rent and utility costs consume two-thirds of its income will have less money to buy food than a family that has the same income but receives a rental voucher to cover a portion of its rental costs.
The program’s targeting of benefits adds some complexity. However, it helps to ensure that SNAP provides the largest levels of assistance to the poorest families with the greatest needs, and lesser assistance to those whose level of need is less severe.
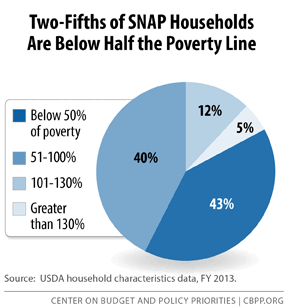
Due to this targeting, approximately 92 percent of SNAP benefits go to households with monthly incomes below the poverty line, and 57 percent go to households with incomes below half of the poverty line (below about $9,895 for a family of three in 2014).
This targeting of assistance also means that benefits tend to be higher in areas of the country where wages and public assistance benefits are lower. This makes SNAP especially important in southern states and rural areas, where wage rates generally are lower. Federal expenditures for SNAP benefits generally are higher in southern and rural states, relative to the size of the state population, than in other states.
These features help account for SNAP’s large impact in reducing poverty. Census data, using the Supplemental Poverty Measure (which counts SNAP and other government non-cash benefits as income, as most analysts believe should be done in measuring poverty), show that SNAP kept 4.8 million people out of poverty in 2013, including 2.1 million children, and made millions more less poor. SNAP is also one of the two most effective programs at lifting children out of deep poverty (defined as living below halfof the poverty line).
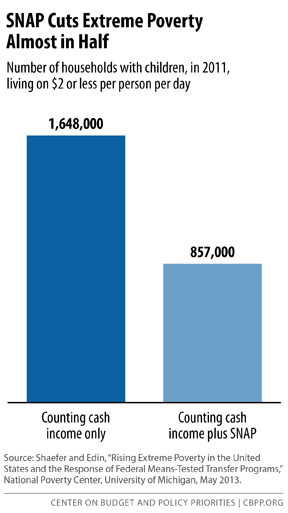
Also of note is a study conducted by the National Poverty Center at the University of Michigan, which looked at the number of U.S. households living on less than $2 per person per day, a standard that the World Bank uses to measure destitution in third-world countries. The study found that without SNAP, 1.65 million American families with children lived on less than $2 per person per day in 2011, but that SNAP cut this number nearly in half.[4]
Impact on Health and Self-Sufficiency
Reducing hunger and food insecurity, and lifting people out of poverty, are important. But the question also arises: what are the program’s longer-term effects?
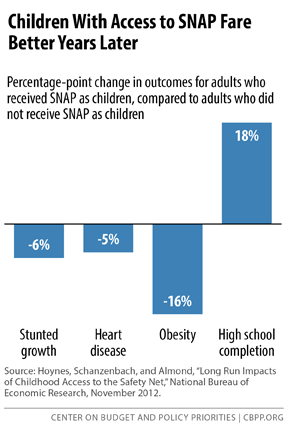
A recent landmark study, issued by the National Bureau of Economic Research, sheds light on this question. In this study, several leading poverty researchers examined what happened when the federal government introduced food stamps in the late 1960s and early 1970s. The researchers were able to make use of the uneven roll-out of the program in that period to match poor children who had access to food stamps in the early 1970s to comparable poor children from counties that hadn’t yet implemented the program. The researchers examined educational, health, and employment-related records for these children in subsequent decades in order to assess the long-term effects of food stamps. They found that adults who had access to food stamps as young children had an 18 percentage point higher high school graduation rate than the children who hadn’t had access to food stamps. The children with access to food stamps also had significantly lower rates of “metabolic syndrome” (obesity, high blood pressure, heart disease, and diabetes) and better health in adulthood. In addition, women who had access to food stamps as young children had higher earnings and lower rates of welfare receipt in adulthood.[5]
Error Rates in SNAP
SNAP has one of the most rigorous error measurement systems of any public benefit program. Each year, states take a statistically representative sample of SNAP cases (totaling about 50,000 cases nationally) and investigate the accuracy of their eligibility and benefit decisions. Federal officials then re-review a subsample of these cases to ensure the accuracy of the state determinations. States are subject to fiscal penalties if their error rates are persistently higher than the national average.
SNAP error rates now stand at record lows. Fewer than 1 percent of SNAP benefits are issued to households that do not meet all of the program’s eligibility requirements.
In addition, the program’s combined overpayment rate — i.e., the percentage of SNAP benefit dollars issued to ineligible households plus the percentage issued to eligible households in excessive amounts — fell for the seventh consecutive year in 2013 to 2.61 percent. The underpayment error rate fell to 0.6 percent, with the result that the net loss to the government from errors was about 2 percent of benefits.

In comparison, the Internal Revenue Service estimates a tax noncompliance rate of 16.9 percent in 2006, the most recent year studied, representing a $450 billion loss to the federal government. Underreporting of business income alone cost the federal government $122 billion in 2006.
The large majority of SNAP errors result from mistakes by recipients, eligibil¬ity wor¬kers, data entry clerks, or com¬puter program¬mers (rather than fraud). States have reported that almost 60 percent of the dollar value of overpay¬ments (and almost 90 percent of the dollar value of underpayments) were the result of state agency error, rather than due to actions by recipients. ">
SNAP and the Budget: Simpson-Bowles, Domenici-Rivlin, and the Gang of Six
The SNAP program has accomplished a great deal. It also can be further improved. But it warrants noting that various distinguished non-partisan or bipartisan groups have all recommended that it not be a target for budget cuts.
The deficit-reduction commission chaired by former Senator Alan Simpson and former White House chief of staff Erskine Bowles, as well as the Bipartisan Policy Center panel chaired by former Senator Pete Domenici and former CBO and OMB director Alice Rivlin, called for substantial budget cuts, as well as tax reforms to promote growth and raise revenue. Both commissions excluded cuts in SNAP, given its importance and its track record in improving access to food and nutrition and reducing poverty and hardship.
When the Senate’s bipartisan Gang of Six developed its framework for deficit reduction in 2011, it, too, protected SNAP from cuts. In addition, a diverse group of Christian leaders representing the Catholic Bishops’ Conference, the Episcopal Church, the Salvation Army, the National Association of Evangelicals, and others has issued a call for policymakers to safeguard the poor in deficit reduction and to draw a “circle of protection” around programs targeted on them — including SNAP.
Where Federal SNAP Dollars Go
Some 92 percent of federal SNAP expenditures goes for benefits to low-income households for the purchase of food. Of the remaining 8 percent, about 5 percent is used for the federal share of state administrative costs, including conducting eligibility determinations, operating SNAP employment and training programs, providing nutrition education to SNAP households, and conducting anti-fraud activities. About 3 percent goes for other food assistance programs such as the block grant for food assistance in Puerto Rico and American Samoa, commodity purchases for The Emergency Food Assistance Program (which helps food pantries and soup kitchens), and commodities for the Food Distribution Program on Indian Reservations.
II. Program Growth
SNAP participation and costs have grown in recent years. It’s important to understand the causes of these developments and their implications.
Some have looked at SNAP caseload growth since 2000, along with the lack of a more dramatic reduction in SNAP caseloads in the past few years as the unemployment rate has receded, as signifying that something has fundamentally changed in SNAP — either that the program has experienced big eligibility expansions or that it no longer becomes smaller as the economy recovers.
As I’ll explain, one needs to scrutinize SNAP data going farther back than 2000, as well as a broader set of economic measures than just the unemployment rate, to assess these issues. When one does, one sees that SNAP has not seen fundamental change that is permanently elevating its costs.
That is the conclusion of the institution most skilled in analyzing these issues, the Congressional Budget Office. CBO projects that as the labor market improves, the number of SNAP participants will steadily decline, from 46.5 million in fiscal year 2014 to 32.8 million by 2025 (the end of CBO’s ten-year budget window), when the share of the population receiving SNAP assistance will be close to its pre-recession level of about 9 percent.
CBO also projects what SNAP and other federal programs will cost. People concerned about the nation’s long-term fiscal problems — irrespective of where they sit on the political spectrum — generally focus on spending, taxes, and deficits measured as a share of the economy, or GDP. For example, a proposal that many conservatives favor — to amend the Constitution to require a balanced budget each year and to place a cap on total federal spending — would set the spending cap as a percentage of GDP. The core of the nation’s fiscal challenge for future decades is that as the population ages and health care costs rise, increased spending for Social Security and health care will cause total federal spending to rise as a share of GDP while revenues remain relatively flat as a share of GDP.
Accordingly, when analysts ask whether or not a program will contribute to our long-term fiscal problems, they generally ask whether it will rise in cost as a share of GDP. And in this regard, CBO’s assessment of SNAP costs is instructive.
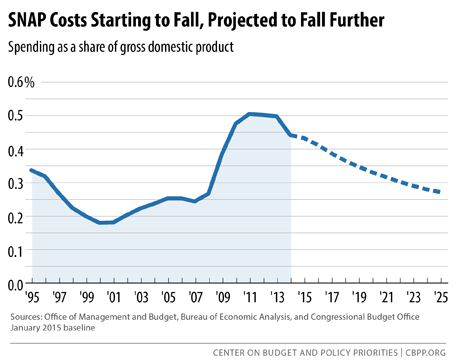
SNAP costs began to fall in 2014, and CBO projects that by 2020 SNAP costs will be all of the way back to their mid-1990s level as a share of GDP. Further, CBO projects no increase in SNAP costs as a share of GDP after that. By this standard, SNAP is not one of the causes of our long-term fiscal challenges. This may seem surprising at first blush, given the increases in SNAP costs and participation. So, let’s review the recent history.
Cost Increases Since 2000
Some have used 2000 as a starting point for looking at SNAP participation and cost trends and noted the large increases since then. As in most areas of budgetary analysis, however, the year selected as a “starting point” can skew the results, and that is the case here. SNAP participation and costs were atypically low in 2000 for several reasons. In the first years after implementation of the 1996 welfare law, SNAP participation and costs plummeted, in significant part due to a large decrease in the share of eligible families receiving SNAP. The 1996 welfare law was intended to encourage work. But due to problems in state administrative systems in the first years of the welfare law, many families moving from welfare to work and joining the ranks of the working poor were cut off SNAP when they left welfare, even though they remained eligible for SNAP.
This was contrary to what Congress intended. Aggravating this problem, some states instituted administrative practices in those years that had the unintended effect of making it harder for many working-poor parents to participate, largely by requiring them to take too much time off from work for repeated visits to SNAP offices at frequent intervals, such as every 90 days to reapply for benefits. This prompted many analysts and state policy officials from across the political spectrum to call for reforms that would improve access to SNAP for low-income working families, and led both the Clinton and the Bush administrations to act to address this problem. There was bipartisan consensus that having a policy under which a family needed to be on welfare to receive food stamps, and faced significant difficulty receiving food stamp assistance if it left welfare for work at low wages, would reduce work incentives and was contrary to welfare reform goals. Congress enacted significant, although relatively modest, changes in 2002 and 2008 to lessen barriers to SNAP participation among the working poor.
USDA data show that the percentage of eligible households actually receiving SNAP benefits fell sharply from 75 percent in 1994 to 54 percent in 2002. Since then, it has rebounded and now stands at 83 percent, the highest participation rate on record. A large share of this increase in the participation rate is due to the program’s significant improvement in serving the working poor. The percentage of eligible individuals in low-income workingfamilies that receive SNAP rose by more than two-thirds — from 43 percent in 2002 to about 72 percent in 2012. [6]
Several other factors may also have contributed to the increase in the participation rate. The widespread and prolonged effects of the recession — particularly record long-term unemployment — may have made it more difficult for family members and communities to help people struggling to make ends meet. Many households that already were poor became poorer and may have been in greater need of assistance.
In addition, research has found that take-up of SNAP among eligible households is higher when benefits are larger. The Recovery Act’s temporary SNAP benefit increase, which was in effect through October 2013, may have contributed to higher participation rates.
In essence, two factors have been responsible for the lion’s share of the increase in SNAP participation and costs since 2000: the poor performance of the economy, to which I’ll turn shortly, and the substantial rebound in the share of eligible households that actually receive SNAP, following the large drop in the program’s participation rate in the late 1990s.[7]
Other factors are small by comparison. On the program eligibility side, more states adopted “categorical eligibility” over the past decade in order to simplify the program, reduce administrative costs, and reach low-income working families that incur substantial costs for items such as child care. But CBO has found that categorical eligibility accounts for only 2 percent of program costs. In addition, while as a result of the weakened economy, most states qualified for statewide waivers from the provision of SNAP law that limits unemployed individuals aged 18-50 who aren’t raising children to three months of SNAP benefits out of every three years, those waivers are now ending in most places. At least 1 million such individuals will be removed from the program in 2016.
Finally, the increase in caseloads cannot be explained by increases in error and fraud. As noted, the program’s error rate has declined. The percentage of benefits provided to households that should have been found ineligible is now below 1 percent.
The Role of the Economy
As noted, SNAP participation and costs have begun to decline. Some 1.5 million fewer people received SNAP in November 2014 than in December 2012.
While SNAP enrollment has begun to recede, however, it hasn’t declined as rapidly as the unemployment rate over the past couple of years. This has led some to assume there is something unusual or disturbing going on with the SNAP program. Close examination indicates, however, that this isn’t the case (as CBO’s analysis also indicates).
When the economy begins to emerge from downturns, reductions in poverty — and in SNAP participation — virtually always follow only with a significant lag. As CBO explained in 2012:
When CBO made this observation, it was predicting that the number of individuals receiving SNAP benefits in fiscal year 2015 would be 46.2 million. This is virtually identical to CBO’s current estimate of 46.0 million participants for the current fiscal year.
Why should the decline in SNAP participation lag the decline in the unemployment rate to this extent? The key point here is that the unemployment rate is an incomplete — and inadequate — measure for assessing changes in the labor market. As former Federal Reserve chair Ben Bernanke explained in July 2013, the unemployment rate “overstates the health of our labor markets given [labor-force] participation rates and many other indicators of underemployment and long-term unemployment.” An array of other key economic measures that are relevant to SNAP participation and costs have shown much less improvement.
- While the unemployment rate has fallen considerably, part of that decline reflects people giving up looking for work and dropping out of the labor market because they’ve concluded they can’t find a job. To measure what is actually happening to jobs and employment, analysts often look directly at the employment rate (rather than the unemployment rate) — i.e., the share of people age 16 and over who have a job. After falling from 63 percent in 2007 to 58.4 percent in 2011, the share of people 16 and over with a job has improved only modestly. It stood at only 59 percent in 2014. To be sure, part of the erosion reflects the aging of the population. But this figure highlights the fact that the labor market has not recovered nearly as much as the decline in the unemployment rate would suggest. This is the point that Bernanke was making.
- In addition, long-term unemployment remains exceptionally high. In no recession from the end of World War II to 2007 did the percentage of unemployed workers who were long-term unemployed workers — people who had been out of work more than six months and were still looking for a job — ever exceed 26 percent of the unemployed. Yet in January 2015, some 31.5 percent of the nation’s 9 million unemployed workers were long-term unemployed. This is especially relevant because the long-term unemployed are much more likely to have exhausted their assets and other support — and to qualify for and seek help from SNAP — than workers unemployed for shorter stretches.
- On a related front, the number of unemployed workers not receiving unemployment benefits — the group of the unemployed that is most likely to qualify for SNAP because they have neither wages nor unemployment insurance (UI) benefits — has continued to grow and was actually higher in 2014 than at the bottom of the recession. There were an average of 14.3 million unemployed workers in 2009, of whom 5.1 million didn’t receive UI benefits. By 2014, the number of unemployed had fallen to 9.6 million — but 6.9 million were without UI benefits — 35 percent more than in 2009, when the economy was at its lowest point.
This reflects the end of federal unemployment benefits for the long-term unemployed as well as cuts in state unemployment benefits in a number of states. Today, fewer than three in ten (27 percent) of unemployed workers receive unemployment benefits. This is the lowest level on record (with data back to 1971). [9] - Another important factor is that the share of workers who want to work full time but can only find part-time work neared historic highs during the recession and remains elevated today. The Bureau of Labor Statistics’ most comprehensive alternative unemployment rate measure, which includes people who are working part time because they cannot find full-time jobs and people who want to work but aren’t actually looking, stood at 11.3 percent in January — 2.5 percentage points higher than at the start of the recession. By this measure, about 18 million people are unemployed or underemployed, twice the 9.0 million people in the official unemployment measure.
These disappointing labor-market realities also are reflected in data on poverty. In 2013, the most recent year for which official poverty data are available, 45 million people were poor. This was 8 million more than in 2007 (before the recession) and 1.7 million more than in 2009 (when the economy hit bottom).
A final important economic factor is the erosion of wages at the low end of the wage scale. Between 1973 and 2013, the share of male workers who earn below-poverty hourly wages (i.e., wages too low to lift a family of four to the poverty line with full-time, year-round work), rose from 17 percent to 24 percent. Looking just at a more recent period, the wages that workers at the 10th percentile of the wage distribution received in the last quarter of 2014 were3 percent below the 2009 levels, after adjusting for inflation; wages at the 25th percentile of the wage distribution were 5 percent below the 2009 level.
The erosion of the minimum wage has played a role here. The current wage floor of $7.25 an hour is 24 percent below the peak value in the late 1960s, after adjusting for inflation. While the minimum wage equaled about half the average hourly wage of private non-supervisory workers in the 1950s and 1960s, it now equals 35 percent of this average wage. The Council of Economic Advisers estimates that increasing the value of the minimum wage in 2014 to its real average value in 1979 would have directly increased wages for the lowest 8 percent of wage earners.
The point here is that a substantial share of formerly unemployed workers continue to qualify for SNAP when they find jobs because their wages are low. (And as noted, SNAP does a much better job than it used to of serving eligible working-poor families; a larger share of such families now participate in the program.)
The erosion of wages for low-paid work is one of the reasons that the proportion of SNAP recipients who are working while receiving SNAP has substantially increased. More than half of families with children that receive SNAP have earnings while they are receiving SNAP benefits. This percentage continued to grow even during the recession.
This leads to a larger observation. Developments in the economy — and policy decisions made in other policy areas outside SNAP and the purview of this Committee — have a significant bearing on SNAP participation and costs. When real wages erode at the bottom of the wage scale, the minimum wage is frozen for an extended period of time while prices rise, or state governments reduce the number of weeks or the amount of unemployment benefits, SNAP participation and costs increase.
A similar dynamic operates on the housing front. When the number of poor households that pay more than half of their income for rent and utilities rises (due to rents rising faster than incomes, reductions in federal housing assistance, or the like), more poor households qualify for the SNAP program’s excess shelter deduction. This raises their SNAP benefit so they can afford both to feed their families and pay the rent. Between 2003 and 2013, the number of low-income households paying more than half of their income for rent and utilities soared from 4.7 million to 7.5 million — an increase of nearly 60 percent.
As noted, the number of SNAP recipients is expected to continue declining as the economic recovery more fully takes hold for lower-income workers. In addition, while the SNAP “participation rate” — the percentage of eligible households that receive benefits — is now at its highest level on record, it may decline somewhat in the years ahead. Research shows that SNAP participation rates are higher for households that qualify for larger benefits. Researchers believe that the temporary increase in the SNAP benefit level enacted as part of the Recovery Act led to an increase in the SNAP participation rate — and that with the end of the benefit increase, the participation rate will likely decline somewhat over time.
III. SNAP and Employment
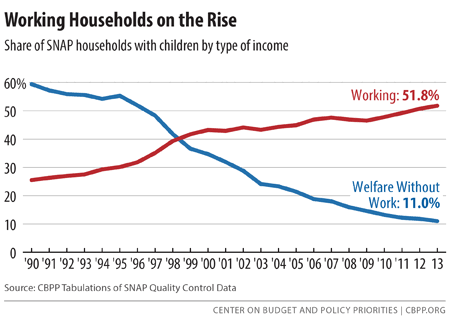
One of the most significant changes in SNAP in recent decades has been its transformation from principally a welfare supplement program to principally a work support program. As Figure 8 shows, in 1990, 60 percent of SNAP households with children received cash welfare assistance and had no earnings, while about 25 percent had earnings from employment. By 2013 (the latest year for which these data are available), only 11 percent received welfare and lacked earnings, while 52 percent worked and had earnings.
This is a dramatic change. Among SNAP families with children, there used to be about 2½ times more families receiving welfare and not having earnings than there were working families. Now, there are nearly five times as many working families as non-working families receiving welfare cash assistance.
To be sure, a substantial share of SNAP households still lack earnings while on SNAP, though this percentage is lower than it used to be. But this needs to be understood in context. Research has shown that losing a job is the most common event that leads new participants to enroll in SNAP. Households that experienced a job loss were 63 percent more likely to seek SNAP than low-income families that didn’t experience a job loss.
If a household loses its job and enrolls in SNAP, and then leaves the program when it lands a new job, the program data will show the household as being jobless while on SNAP. But the household will have maintained a strong attachment to the labor force, and SNAP will have done its job in helping the family put food on the table until it could get back on its feet.
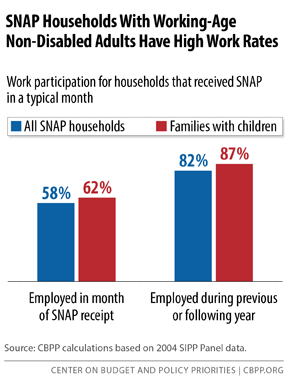
Accordingly, to understand the program’s connection to work, we need to understand the degree to which SNAP participants work before and after going on SNAP, not just their work status while they are receiving benefits. Among SNAP households with a working-age adult who isn’t disabled, more than half work while receiving SNAP, and more than 80 percent work in the year before or after a typical month receiving SNAP. The rates are higher for families with children — more than 60 percent work while receiving SNAP, and 87 percent work in the prior or subsequent year. [10]
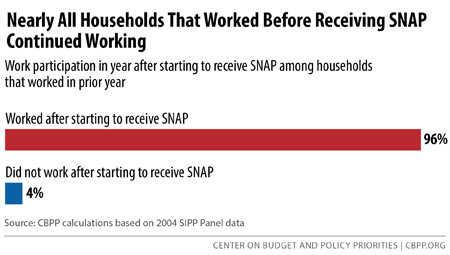
Of particular note, among households that worked before enrolling in SNAP, 96 percent worked in the year after starting to receive SNAP; only 4 percent did not. This suggests that turning to SNAP does not lead people to cease working or trying to work.
Indeed, the number of SNAP households that have earnings while participating in SNAP more than tripled between 2000 and 2013, from about 2 million to about 7.1 million. The increase continued even during the recession, which suggests that more people have been turning to SNAP because of low wages or underemployment (for example, when one wage-earner in a two-parent family loses a job, when a worker’s work hours are cut, or when a worker turns to a lower-paying job after being laid off). During the recession, the number and share of SNAP households with earnings increased even as the overall number of Americans who are employed declined and the number of long-term unemployed swelled.
These data are consistent with the leading academic research in the field, which finds that SNAP does not have significant work disincentive effects. A comprehensive review and synthesis of the research literature that examined the behavioral effects of an array of safety-net programs, including SNAP, and was conducted by some of the field’s leading scholars and published by the National Bureau of Economic Research, found SNAP’s overall impact on work to be small. This doesn’t mean, however, that SNAP couldn’t do better in helping participants that lack jobs to secure them — a topic to which I will return shortly.
How Long Do People Stay on SNAP?
One set of data that can help illuminate these issues, but can also engender confusion, concern how long participants remain on SNAP. The implications that’s often drawn is that if people stay on a program for very long periods of time, the program may not be appropriately connecting them to the labor market.
As analysts know, the issue of how long participants remain on SNAP (or any other program) is complicated and often misunderstood. An analogy to a hospital room helps to explain why — and is crucial to understanding SNAP caseload dynamics.
Consider a hospital room with two beds. Over a 30-day period, one bed is occupied by the same person throughout. The other bed is occupied by 5 different people who have short hospital stays and then leave. If you ask what share of those who are patients in the hospital room on any given day are “long stayers,” the answer is 50 percent (one of the two people then in the room). But if you ask what share of all patients over the course of the month were long stayers, the answer is 16 percent — one in six.
That is precisely what the SNAP rolls are like. The most recent study of SNAP caseload dynamics found that of all people who entered the program between 2008 and 2012, some 26 percent left the program within four months, 52 percent left within 12 months, and 67 percent left within 24 months. For families with children, the typical (or median) spell on SNAP was 12 months. For elderly people living alone, by contrast, the median length of time on the program was more than 51 months.
These data show that most people going on SNAP who are not elderly or disabled do not remain on the program continuously for extended periods of time. (Some do return when they encounter subsequent financial hard times and then leave the program again.)
But at the same time, if you take the SNAP caseload in a given month and ask what is the typical length of stay on the program of those participating in that particular month, the answer is more than five years. This is the equivalent of asking what share of the hospital beds in our hypothetical hospital room were occupied by a long stayer on a given day.
Finally, data on the length of stay on the program cannot, by themselves, yield sufficient information on the relationship of SNAP to employment. As noted earlier, with the erosion of wages on the low end of the pay scale, especially for male workers with no more than a high school education, people can work at low wage jobs for a number of years and remain eligible for SNAP throughout that time.
The SNAP Employment and Training Program
People sometimes ask if SNAP has work requirements. It does, and they are stronger than people often realize. In fact, for childless adults, they are the most stringent of any federal program. People aged 18 to 50 who are not raising minor children may receive SNAP benefits for only three months (while they are not employed at least half time) out of every three years, even if they have looked diligently for work but cannot find it.
When the amendment establishing this requirement was offered on the House floor in 1996, its sponsors said that if a SNAP recipient couldn’t find a job on his or her own, the individual would be provided a workfare slot and only those refusing to do workfare would be cut off after three months. In most places, however, the workfare (or other qualifying work) slots were never created. Currently only five states operate the requirement this way. In the rest, people who do not find a job on their own in three months are cut off, regardless of how hard they may be looking for work.
I have also heard this requirement mistakenly described as one that cuts off benefits after three months for people who won’t search for a job, but that isn’t accurate. Job search does not count under the requirement.
In my view, job search ought to count. I also believe that people who cannot find a job should be offered a work or training slot — and cut off SNAP if they refuse to take it — rather than being cut off because no slot has been offered to them. The people who are subject to this three-month benefit limit have average income of only 19 percent of the poverty line (about $2,200 a year) and typically don’t receive any other income or nutrition support.
In recent years, this requirement has largely been suspended in many states; the provision enacted in 1996 authorized states to obtain temporary waivers of this requirement during periods when the economy is weak and unemployment is elevated, and most have done so statewide in recent years. As noted earlier, most states will no longer qualify for those statewide waivers as their local unemployment rates improve. At least 1 million individuals will lose food assistance in 2016 as a result of this requirement.
Turning to SNAP participants who have children, SNAP work rules and requirements essentially complement those in the Temporary Assistance for Needy Families block grant, the program established under the 1996 welfare law. The 1996 law gave states options to impose tough SNAP sanctions on TANF households who fail to comply with TANF work or other behavioral requirements. This includes the termination of SNAP benefits for the entire family for up to six months (unless the family has a child under age 6).
States use this flexibility to design and augment the force of their TANF work and behavioral requirements. States also operate SNAP employment and training (E&T) programs for SNAP participants who are not subject to work requirements in TANF or other programs, and states can and do impose SNAP benefit sanctions on participants who fail to comply with SNAP employment and training program rules.
USDA data show that between 70,000 and 100,000 people live in a household where an individual’s SNAP benefits have been terminated for failure to meet a work requirement. This number is an understatement; these data do not include households where the entire household has been removed from the program for not meeting a work requirement.
The SNAP program does, however, have a weakness in this area: due to limited funding, the SNAP employment and training program is able to provide work or training slots for only a relatively modest portion of SNAP recipients who lack employment and aren’t enrolled in, or subject to, another work program or another set of work requirements such as those under TANF.
Another weakness is that SNAP employment and training programs have not been especially effective at placing participants in private-sector jobs or helping them gain skills that would enhance their ability to find and retain jobs. The SNAP E&T program isn’t unique here. A number of employment and training programs have mixed or disappointing track records.
Fortunately, there is now hope for improvement here. The 2014 Farm Bill created a major demonstration project under which up to ten states will test innovative employment and training strategies, with a rigorous, independent evaluation being conducted of the effects on employment, earnings, and other factors. We currently have limited knowledge about what strategies are successful in increasing employment among SNAP participants, and these pilots should provide valuable information on how the SNAP employment and training program can better serve SNAP participants to achieve desired results.
USDA will shortly announce the states selected for the demonstration, and I hope and expect that a broad range of approaches will be tested. I would urge policymakers on both side of the aisle to let the demonstration run its course and not rush to make big changes in SNAP employment and training rules before we have the results. The last several decades have seen a number of Congressional efforts to improve other federal employment and training programs without the type of knowledge that these demonstrations should yield. Despite good intentions, such earlier efforts to improve employment and training programs have often yielded disappointing results. We need this time to be different, and that entails being patient until the demonstration results are in, and then applying them.
There is, however, another hopeful opportunity in which I urge the Committee to become involved. Historically, the job training programs funded and operated under the Workforce Investment Act have largely bypassed SNAP participants, focusing instead on people who already possess job experience and skills. (A GAO study found that SNAP E&T participants generally have limited education — they often aren’t high school graduates — and limited job skills.) Fortunately, the bipartisan Workforce Investment Act reauthorization Congress that enacted last year calls for these training programs to orient more to disadvantaged individuals. The new law also encourages state workforce agencies to collaborate more closely with state SNAP E&T programs, and it includes an option for states to submit a combined workforce plan that includes programs like SNAP E&T. Connecting SNAP participants to a broader range of employment and training services should allow more of these individuals to gain the skills needed to find employment, with positive effects both for these individuals and for SNAP costs (which will be lower if more participants secure jobs). I would recommend that the Committee work to make sure that this promising aspect of the new job training law is realized in practice. To this end, a review of how the Department of Labor and local workforce boards are expanding job training options for SNAP participants under the new law would be worthwhile.
Finally, in thinking about SNAP and employment, I would urge the Committee to weigh the effects of various policies not only on employment among adults currently on SNAP, but also on the future employment prospects of children in families that receive SNAP. As noted earlier, research suggests that when poor families with children receive SNAP while the children are young, the children (especially girls) are more likely to be employed and not on welfare as adults. This suggests that care should be taken to protect children’s access to the important nutritional assistance that SNAP provides.
IV. A Final Thought on Strengthening Program Integrity
I understand the Committee will be undertaking a comprehensive review of SNAP over the next year. I would recommend that as part of this oversight, the Committee consider ways to facilitate greater use of data matching to further strengthen program integrity and improve client service through improved efficiencies. There may be opportunities to enhance this aspect of program operations across the country.
One issue to explore is how to provide more SNAP caseworkers with strong capacity to access data in real time when working with clients and determining and renewing eligibility or processing reported changes in household income. Several states — such as Utah, Washington, and Idaho — have developed special tools that help their eligibility workers conduct data matches across a wide range of state and federal databases, such as Motor Vehicles, State Vital Statistics, the Social Security Administration, Child Support, Unemployment Insurance, state tax records, consumer credit checks, and other commercial databases. These databases help states verify the income and other eligibility factors a household reports, and can do so without asking clients to take time off from work for repeated visits to food stamp offices to provide documents. And with ready access to information to verify clients’ statements, caseworkers can take immediate action as needed (without waiting for clients to turn in paper verification to the local office and for that paperwork to make its way to the caseworkers days or even weeks later). In addition, ready access to third-party data can help to detect instances where households may not have reported information accurately. The matches occur nearly instantaneously and help detect both inadvertent mistakes and fraud. But not all states currently use tools such as these.
Similarly, some states pay (with the support of federal matching funds) a private company, Equifax, for access to employment and wage records. Employers with large numbers of low-wage workers often prefer to have a third party handle government inquiries regarding their employees’ wages and hours. State SNAP agencies report that when their case workers are able to easily access income information for applicants and participants, that increases accuracy and reduces paperwork burdens on both participants and employers. The Committee may wish to explore whether access to these private third-party data is something the program can and should provide to all states. The federal government, for example, now provides such data to state Medicaid programs through the federal data hub.
Another interesting data matching option that could increase program accuracy while reducing paperwork is using state wage records to verify the income of SNAP participants and applicants. Currently, a few states, including Texas, are testing this approach via a waiver. This mode of verifying income is not typically used because SNAP requires that applicants verify their income using current records, and state wage data often are a number of months old. As result, state wage records can’t be used to definitively determine an individual's current income (although states can use it to retroactively test the veracity of client information). Under the waiver, Texas is testing the targeting of this verification method for participants with steady employment and earnings. If it proves accurate, it may represent a way to reduce paperwork burdens for both applicants and state SNAP staff.
Helping states share these tools and innovations with other states — including exploring ways that the federal government might establish or procure IT solutions that all states can use to strengthen program integrity, increase efficiencies and improve customer service, instead of requiring each of the 50 states to individually research the terrain — could be considered, given the federal dollars at stake. The Committee could look into whether there are opportunities to remove barriers to states’ adoption of such systems or to incentivize more states to implement them.
V. Conclusion
The Agriculture Committee is undertaking a close look at SNAP. I hope the results of this work lead the program to become still more effective.
In so doing, I hope the Committee will keep in mind the accomplishments the program has made and proceed with appropriate caution. The well-being of millions of vulnerable Americans is at stake. I would urge that the Committee adopt the Bowles-Simpson principle of protecting the disadvantaged and avoiding measures that would increase hunger, poverty and hardship in a nation as abundant as ours. Thank you.
End Notes
[1] “Hunger in America: The Federal Response,” Field Foundation, 1979.
[2] Kenneth Hanson and Victor Oliveira, “The 2005 Gulf Coast Hurricanes’ Effect on Food Stamp Program Caseloads and Benefits Issued,” Economic Research Service, U.S. Department of Agriculture, ERS Report Number 37, February 2007, http://www.ers.usda.gov/media/200715/err37_reportsummary_1_.pdf.
[3] Congressional Budget Office, “The Supplemental Nutrition Assistance Program,” April 2012, http://www.cbo.gov/sites/default/files/cbofiles/attachments/04-19-SNAP.pdf.
[4] H. Luke Shaefer and Kathryn Edin, “Rising Extreme Poverty in the United States and the Response of Federal Means-Tested Transfer Programs,” http://npc.umich.edu/publications/u/2013-06-npc-working-paper.pdf.
[5] Hilary W. Hoynes, Diane Whitmore Schanzenbach, and Douglas Almond, “Long Run Impacts of Childhood Access to the Safety Net,” National Bureau of Economic Research Working Paper 18535, 2012, www.nber.org/papers/w18535.
[6] The most recent year for which USDA publishes estimates is 2012.
[7] From 2009 through 2013, the temporary SNAP benefit increase enacted as part of the 2009 Recovery Act also contributed to the increase in costs. The temporary benefit increase ended on October 31, 2013.
[8] Congressional Budget Office, “The Supplemental Nutrition Assistance Program,” April 2012. Two other studies of SNAP rolls during the Great Recession also found that their patterns have been consistent with previous economic cycles. Marianne Bitler and Hilary Hoynes, “The More Things Change, the More They Stay the Same? The Safety Net and Poverty in the Great Recession,” National Bureau of Economic Research, Working Paper 19449, September 2013, http://www.nber.org/papers/w19449.pdf and Peter Ganong and Jeffrey B. Liebman, “The Decline, Rebound, and Further Rise in SNAP Enrollment: Disentangling Business Cycle Fluctuations and Policy Changes,” National Bureau of Economic Research, Working Paper 19363, August 2013, http://www.nber.org/papers/w19363.pdf?new_window=1.
[9] Claire McKenna, “The Job Ahead: Advancing Opportunity for Unemployed Workers,” National Employment Law Project, February 2015, http://www.nelp.org/page/-/UI/Report-The-Job-Ahead-Advancing-Opportunity-Unemployed-Workers.pdf?nocdn=1.
[10] The figures are based on data from the Survey of Income and Program Participation (SIPP) for the mid-2000s, but preliminary analysis finds that they declined only modestly during the recession. Preliminary analysis of SIPP data for 2008-2010 finds that among non-disabled working-wage SNAP households, the percentage that worked in the year before or after a typical month of SNAP receipt edged down by only 3 percentage points, from 82 percent to 79 percent, despite the sharp rise in unemployment.