President Trump’s Budget Would Shift SNAP Costs to States, Increasing Risk of Hunger and Weakening Response to Recessions
The Supplemental Nutrition Assistance Program (SNAP, previously known as food stamps) has sharply reduced severe hunger and malnutrition in recent decades, and SNAP reduces the depth and length of recessions by expanding automatically when need rises, bolstering consumer demand in a weak economy. President Trump’s 2018 budget would undermine this success by ending SNAP’s status as a national program and shifting more than $100 billion of SNAP costs over the next decade to the states by forcing states, for the first time, to pay a share of SNAP benefit costs — 10 percent starting in 2020, rising to 25 percent in 2023 and beyond. The budget also would give states new flexibility to cut SNAP benefit levels to “manage their costs” ― flexibility that many states would likely use. The result: more people at risk of hunger and harsher, more damaging, and longer economic downturns.
SNAP benefits have been federally financed since the program obtained its current structure more than 40 years ago, in part to help address regional disparities in hunger, poverty, and resources by ensuring that low-income households have access to adequate food regardless of where they live. This funding structure has also helped keep hunger low during recessions, when states’ balanced budget requirements typically prompt them to cut services for the needy even though more people need help.
States are in no position to absorb more than $100 billion in new costs over the next decade without cutting SNAP benefits.States are in no position to absorb more than $100 billion in new costs over the next decade without cutting SNAP benefits and taking other steps that could increase hunger and hardship. The cost shift would:
- Impose a significant new cost on states. The annual cost shift to states would equal about $17 billion to $18 billion a year once fully implemented, the Administration estimates. To put these costs in perspective in terms of state budgets, 25 percent of SNAP benefits in Texas — about $1.3 billion per year — is roughly equivalent to the state’s share of the annual salaries of 64,000 of the state’s teachers.
- Force states to cut spending, raise taxes, or both — and especially to cut benefits and services during recessions. States must balance their budgets each year. To absorb large new SNAP costs, they would need to either cut services and programs on which their residents now depend or generate new in-state revenue (or some combination of the two). The impact would be greater in recessions, when declining state revenues typically force states to cut spending in order to meet their balanced budget requirements.
- Hit states at a time when their revenues cannot meet existing needs, let alone absorb new costs. Most states are struggling to balance their current budgets, even before any federal cost shifts. Two-thirds of states are facing or have addressed revenue shortfalls for this year, next year, or both. Plus, many states still haven’t yet fully recovered from the Great Recession. For instance, the average state has cut funding for higher education by 18 percent per student since before the recession, after adjusting for inflation. In the longer term, significant structural weaknesses in state revenue systems will limit states’ capacity even to keep up with existing needs.
- Compound the damage to states from other massive cost shifts in President Trump’s budget. In total, the budget would shift as much as $453 billion a year to states and localities once the cuts were fully implemented in 2027 — an amount equal to roughly 37 percent of state general fund budgets that year. For context, states now spend 35 percent of their general fund budgets on K-12 education.
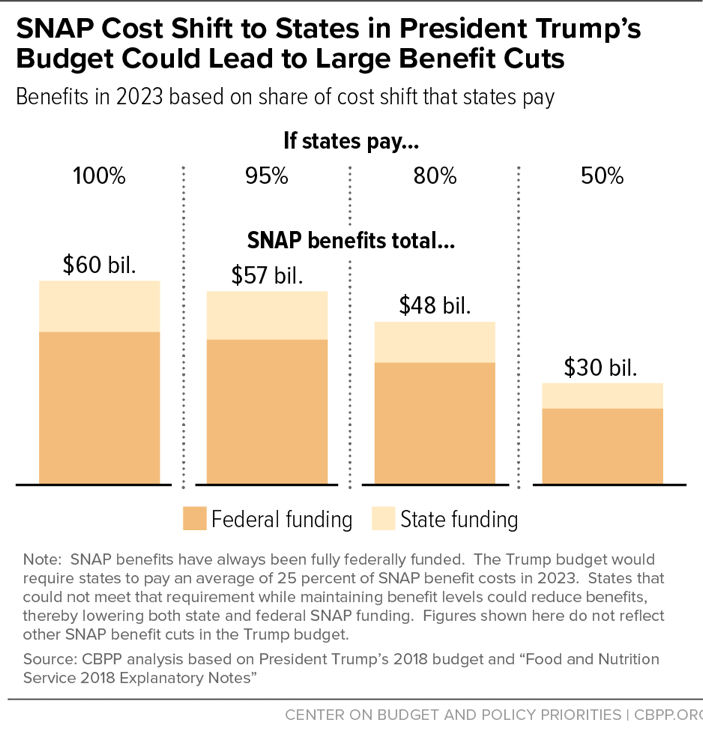
Given their existing budget challenges, states likely would reduce their SNAP costs by cutting benefits, causing higher food insecurity and additional hardship and stress in low-income families and communities. If states could only absorb an average of 80 percent of the cost shift (still a substantial burden), SNAP households would receive roughly $12 billion less in benefits each year. That would shrink SNAP benefits by more than $25 per person per month. Consequently, many more families would struggle to afford a healthy diet, and regional disparities in food insecurity and poverty would likely grow. In addition, states and localities would face new indirect costs as added stress and hunger in families raised medical, foster care, and other costs.
These cuts also would undermine SNAP’s important role in reducing the length and severity of recessions. When people lack access to food assistance, they spend less at local stores, which threatens jobs at those local stores, puts less money in local economies, and slows the national economy.
Apart from its damaging cost shift, President Trump’s budget includes another $75 billion in SNAP benefit cuts over ten years, which would end assistance to millions and cut benefits to millions more, targeting the unemployed, low-income working families with children, and the elderly and disabled. These other cuts include an abrupt benefit “cliff” — i.e., an immediate benefit cutoff, rather than a gradual phase-out — for households as their earnings rise, a further curtailing of federal waivers from SNAP benefit time limits for unemployed adults in high-unemployment areas, and an end to the small minimum benefit available mostly to seniors and people with disabilities. (See Appendix Table 1.)[1]
President Trump’s Budget Would Shift Billions in SNAP Costs to States
Since its inception as a national program over 40 years ago, SNAP benefits have been financed with federal funds, while states (and some local jurisdictions) share in administrative costs. That program design grew out of two policy insights with long-standing bipartisan support. First, minimizing hunger and malnutrition is a national priority, both as a moral imperative to ease hardship and suffering and because hunger and malnutrition limit the country’s economic potential. Second, states often lack the resources to reduce hunger significantly, especially during recessions. Federal funding is necessary to ensure that Americans, no matter where they live, have enough to eat.
SNAP has been an extraordinary success, responding to changes in poverty and the economy to expand with rising need and shrink as need recedes. Today it reaches over 40 million low-income individuals, including working families, children, seniors, and people with disabilities. SNAP reduces food insecurity, lifts millions out of poverty, and promotes long-term health and well-being, particularly among children.
President Trump’s budget would reverse this progress by terminating SNAP’s status as a national program. The budget would ultimately require states to pay an average of 25 percent of SNAP’s benefit costs, though each state’s specific share would be “based on a formula that incorporates the economic indicators that drive SNAP participation along with State resources.” As a result, some states’ share would be higher than 25 percent and others would be lower.
The cost shift to states would begin in 2020, when states would be required to pay 10 percent of benefit costs. That share would rise each year, reaching 25 percent in 2023 and later years.
The Administration estimates that the change would cut federal SNAP spending by $116 billion over ten years; the annual reduction would be $17 billion to $18 billion starting in 2023.[2]
The cost shift to every state would be significant. If Texas’ share were 25 percent, for example, it would need to come up with about $1.3 billion annually in state and local funds to maintain the SNAP assistance Texans now receive. (See Appendix Table 2 for the estimated cost shift to each state.)
States Unlikely to Absorb This Large Cost Shift
States are in no position to absorb new costs of this magnitude.
States Would Have to Cut Spending and/or Raise Taxes
States must balance their budgets each year, so they must offset any loss in revenue or increase in costs through spending cuts, revenue gains, or both. The federal government covers the full cost of SNAP benefits, so states do not need to account for these benefits in their budgets. The President’s plan, though, would force states to move SNAP benefits on-budget, where they would be subject to balanced budget rules. When the cost shift began in 2020, states would need to either cut services and programs their residents currently depend upon or find new in-state revenue that covers the cost of the services that otherwise would be lost (or some combination). And as the cost shift grew over the next few years, states would need to cut even more, or raise even more revenue.
The challenge would be even greater in recessions. Job losses in recessions reduce households’ income and consumption and thus state income tax and sales tax collections. Since states still need to balance their budgets, they typically reduce spending on services and programs, even though more people need help. States also take other steps, including raising revenue and drawing on reserves, but spending cuts are typically the dominant approach, especially after states empty their reserves. In the five years following the last recession, states imposed $290 billion in cuts to public services, raised $100 billion from tax and fee increases, and drew down $60 billion in reserves.[3] Emergency federal aid totaling about $160 billion saved states from doing even more damage to their schools and other public services. It’s unclear if federal aid on that scale would be available during a future recession.
State Revenues Do Not Cover Existing Needs, Let Alone New Costs
Most states are already struggling to balance their current budgets, even before any federal cost shifts. State revenue growth has been weaker than expected over the last several months, leaving 28 states with budget shortfalls in the current fiscal year — more than in any year since 2010, in the aftermath of the Great Recession. Most of these states have cut services, used reserves, and taken other steps to balance their budgets.
Further, these mid-year budget problems appear to indicate continuing problems. More than half the states lack the revenue needed to maintain services at existing levels in 2018. All told, two-thirds of the states are facing or have addressed revenue shortfalls this year, next year, or both.
State revenue growth has been weak for several reasons. Income tax collections are lagging expectations as wealthy taxpayers appear to be postponing selling stocks and other assets in the hope that policymakers will cut capital gains tax rates. Sales tax collections are below their historical average as consumers have remained cautious long after the end of the recession, and untaxed Internet sales have continued to grow. Plus, the collapse in oil prices has hurt states whose revenues depend on oil extraction. Some states have cut taxes deeply, reducing their revenue further.
These revenue challenges are particularly disturbing because many states still have not fully recovered from the Great Recession, which caused a dramatic decline in revenues and resulted in sharp funding cuts for schools and other state services. For instance, the average state has cut higher education by 18 percent per student since before the recession, after adjusting for inflation.[4]
In the longer term, significant structural weaknesses in state revenue systems will limit states’ capacity to keep up with existing needs, let alone absorb new costs. State sales tax systems, for example, are increasingly antiquated because they exempt many services and Internet purchases from taxation, even as the economy shifts more and more to these forms of consumption.
President’s Budget Would Impose Other Large Cost Shifts
The budget also includes large cost shifts outside SNAP that would make it much harder for states to absorb new SNAP costs.[5] The budget includes large, damaging cuts to Medicaid — a program whose costs are shared by the federal and state governments — plus cuts to other entitlement programs that help low-income people get through hard times and make it into the middle class. It also includes deep cuts to a wide range of other services and programs that states and localities provide, including job training, child care assistance, and affordable housing.
In total, the budget would shift as much as $453 billion annually to states once the cuts were fully implemented in 2027 — an amount representing about 37 percent of state general fund budgets that year. For context, states currently spend 35 percent of their general fund budgets on K-12 education.
Budget Encourages States to “Manage” New Costs by Cutting SNAP Benefits
The Agriculture Department’s (USDA) budget documents note that to help “states manage their costs,” they would receive new flexibility to set benefit levels.[6] In a state-federal matching program such as the Administration proposes, federal funding would be based on the amount of funding the state could put up. In this case, for every dollar a state provided for SNAP benefits, the federal government would provide $3, on average. States thus could “manage” their costs by reducing the amount of food assistance each family in need receives, which would cut the total cost of SNAP benefits and, by extension, the funding needed to meet the state’s required share of that cost. (Put another way, the smaller a state’s SNAP program is, the fewer state dollars are needed to cover a given share of its cost.) Given the extreme difficulty states would have in absorbing the new SNAP costs at current benefit levels, they likely would do exactly that. (See Figure 1.)
If states cut SNAP benefit levels, federal SNAP costs would fall as well. (See Box 1.) The Administration’s estimates do not include any additional savings from assuming states would cut benefits; the Administration assumes that every state would fully offset the loss of federal SNAP funds with state funds. That assumption is highly unrealistic. The Congressional Budget Office has confirmed that state actions to reduce benefits could lead to significant additional savings from this proposal.[7]
Exactly how much states would cut SNAP benefits is unknown. Table 1 presents the cuts to households and additional federal savings in 2023 depending on how much of the $15 billion cost shift that states could offset with their own funds. If every state somehow offset all of the lost federal funds, the cost shift would not produce any benefit cuts to households, though other SNAP cuts in the President’s budget would affect large numbers of beneficiaries.
Box 1: The Math of a State Match
The Administration’s estimates of SNAP cuts from the President’s budget assume that states will pay the full amount of the cost shift, avoiding any benefit cuts. But if states cannot do so, they must cut SNAP benefits, which in turn would increase the federal savings.
To see why, consider a state where low-income households qualify for $100 million in SNAP benefits under SNAP program rules — benefits currently funded with all federal money. If SNAP were converted to a match program where the state had to pay 25 percent of benefit costs but could cut benefits to help it meet that 25 percent requirement:
- To maintain existing benefit levels, the state would need to provide $25 million. The federal government would pay the other $75 million, a $25 million federal savings compared to current law.
- If, however, the state could only pay $20 million, it would need to cut total SNAP benefits to $80 billion in order to meet the 25 percent requirement (since $20 million is 25 percent of $80 million). This would mean a 20 percent cut in total SNAP benefits, from $100 million to $80 million.
- If the state cut total benefits to $80 million, the federal share would fall to $60 million (75 percent of $80 million) and the federal savings would grow from $25 million to $40 million.
If, however, states could only make up 80 percent of the lost federal funds, they would have to cut benefits by more than $12 billion each year for SNAP households, on top of the budget’s other SNAP benefit cuts. This cut alone would shrink benefits by more than $25 per person per month in nominal dollars. Every SNAP household would experience the cut.[8] By 2023 (and in later years), as a result of the cost shift, SNAP benefits nationally would shrink by about 20 percent nationally, and federal SNAP spending would fall by about 40 percent.
Alternatively, if states could only cover half of the lost federal funds, benefits would fall by $30 billion a year — more than half — or about $65 per person per month, on average.
It is worth noting that participating in SNAP is optional for states. Nothing would prevent a state from dropping out of SNAP entirely rather than pay a mandated portion of SNAP benefits.
| TABLE 1 | |||||
|---|---|---|---|---|---|
| SNAP Benefit Cuts and Federal Savings Would Rise If States Could Not Absorb Full Cost Shift | |||||
| Fiscal year 2023 estimates, based on Administration estimates (in billions) | |||||
| Of the $15 billion in SNAP benefits states would need to pay to maintain benefit levels, assume they are able to pay: | |||||
| All of it* | 95 percent | 80 percent | 50 percent | None | |
| Total SNAP Benefits | $60 | $57 | $48 | $30 | $0 |
| State share (25%) | $15 | $14 | $12 | $8 | $0 |
| Federal share (75%) | $45 | $43 | $36 | $23 | $0 |
| From this provision: | |||||
| Benefit Cut | $0 | -$3 | -$12 | -$30 | -$60 |
| Percent | 0% | -5% | -20% | -50% | -100% |
| Federal savings | -$15 | -$17 | -$24 | -$38 | -$60 |
| Percent | -25% | -29% | -40% | -63% | -100% |
| Total, including other SNAP cuts | |||||
| Benefit Cut | -$8 | -$11 | -$20 | -$38 | -$68 |
| Percent | -12% | -16% | -29% | -56% | -100% |
| Federal savings | -$23 | -$25 | -$32 | -$46 | -$68 |
| Percent | -34% | -37% | -47% | -67% | -100% |
Benefit Cuts Would Mean More Hardship, Indirect Costs to States, Longer Recessions
SNAP (then called the Food Stamp Program) grew out of a bipartisan federal commitment to ensure low-income Americans had enough to eat, no matter where they lived; policymakers recognized that states could not adequately address the problem. Today, though too many families still face food insecurity, the country has virtually eliminated the widespread hunger and malnutrition that plagued poor families in the 1960s and before. The Administration budget’s dramatic policy shift could instigate a reversal of that progress over the last 40 years — putting more Americans at risk of hunger, increasing regional disparities, further straining state and local resources, and stressing the economy during downturns. If states were compelled to cut benefits under the proposal:
- SNAP benefits would no longer support the minimal cost of a healthy diet. SNAP benefits are based on the cost of USDA’s Thrifty Food Plan (TFP), which reflects the minimal cost of a bare-bones, healthy diet. But, under President Trump’s proposal, budget-constrained states would likely reduce benefits, delinking them from a meaningful minimal-cost diet, which would erode families’ ability to afford sufficient nutrition. A growing body of research suggests current benefit levels, which average $1.40 per person per meal, may already be inadequate to fully meet families’ nutritional needs (see Box 2), so benefit cuts could be devastating.
- Geographic disparities in food insecurity and poverty would increase. SNAP is designed to address disparities across states in hunger, poverty, and resource capacity. Poor households with similar circumstances are eligible for the same SNAP benefit regardless of where they live — unlike other benefits, where states set eligibility rules and benefit levels. (For example, cash assistance under Temporary Assistance for Needy Families for a single-parent family of three ranges from $170 per month in Mississippi to $789 in New York and $923 in Alaska.[9]) Under the President’s proposal, states would adjust benefits based on their ability to commit funds, so SNAP’s ability to respond to hunger and poverty consistently across the country would begin to unravel. Introducing such disparity in SNAP benefit levels across states would weaken SNAP’s effectiveness as an equalizing anti-poverty and food assistance program.
- Increased food insecurity would drive up other government costs. Though President Trump’s proposal would create savings in SNAP, the likely increase in food insecurity could impose indirect costs by creating additional hardship. Health issues related to inadequate and poor nutrition, for example, could result in expensive medical care and conditions that make it harder for individuals to work, depressing economic productivity. The added stress on families also could result in a range of new costs for states and localities, such as by boosting the number of children in foster care or the number of adults with alcohol or drug addictions.
- SNAP would no longer respond effectively to recessions. SNAP reacts automatically to changes in unemployment and poverty, expanding when need increases (as it did during the recent recession) and shrinking when need recedes (as it is doing in the current economic recovery). This means that SNAP is reliably available to provide food assistance to any household that meets the program’s eligibility standards.
SNAP not only supports households that experience unexpected shocks like job loss or illness, but also serves as an “automatic stabilizer” for the broader economy during economic downturns. Because SNAP benefits are delivered and spent quickly, the program boosts economic activity in communities across the country. Under the President’s proposal, however, when a recession hit, each additional federal dollar needed for SNAP would require an additional state contribution at a time when state revenues would already be declining. States would need to cut benefits (or raise revenues) to serve additional applicants. Unable to effectively expand with rising need, SNAP would no longer serve as an automatic economic stabilizer as it has in previous recessions, stalling recovery.
Box 2: Research Suggests SNAP Benefits May Already Be Inadequate
A growing body of research suggests that SNAP benefit levels may be insufficient for low-income families to afford an adequate, nutritious diet, and that additional food assistance would increase food expenditures, curb food insecurity, and improve diet quality.a
A household’s SNAP benefits are calculated by subtracting the amount of income they are expected to spend on food from the maximum SNAP benefit. The maximum benefit is based on the cost of USDA’s Thrifty Food Plan (TFP) for a given household size. The TFP is a market basket of goods that includes the type and quantity of food that families of different sizes can buy to achieve a nutritious diet at minimal cost. Each month, the TFP cost is updated to reflect food inflation. Periodically, USDA revises the market basket to incorporate the most recent dietary standards, holding the cost constant apart from inflationary adjustments. The TFP was last updated in 2006.
For several reasons, the TFP — and, by extension, SNAP benefits — may underestimate the minimal cost of a realistic, nutritious diet.
- The TFP assumes families spend far more time obtaining and preparing food than they actually do. The plan presumes households buy unprocessed foods and cook meals from scratch, which would require much greater preparation time than households currently spend. Also, it doesn’t account for the time and cost of transportation to buy food, which can be substantial for those with limited access to food stores that provide a wide variety of food at affordable cost. The underlying time demands of the TFP are misaligned with the time available to low-income households to prepare food.b
- The TFP does not reflect the variety of foods most people consume. Some research shows that the TFP, to meet the cost constraint, assumes that a household will consume certain foods in quantities up to 20 times higher than the national average and omits other, commonly consumed foods.c
- The TFP does not meet all key dietary standards. The TFP is meant to represent a minimal cost, healthy diet. It meets many science-based recommendations of nutritional need but fails to meet nutritional guidelines for vitamin E, potassium, and sodium.d
a Patricia M. Anderson and Kristin F. Butcher, “The Relationships Among SNAP Benefits, Grocery Spending, Diet Quality, and the Adequacy of Low-Income Families’ Resources,” Center on Budget and Policy Priorities, June 14, 2016, https://www.cbpp.org/research/food-assistance/the-relationships-among-snap-benefits-grocery-spending-diet-quality-and-the; “Summer Electronic Benefit Transfer for Children (SEBTC) Demonstration: Summary Report,” Abt Associates, May 2016, https://www.fns.usda.gov/sites/default/files/ops/sebtcfinalreport.pdf.
b Julie A. Caswell and Ann L. Yaktine, eds., Supplemental Nutrition Assistance Program: Examining the Evidence to Define Benefit Adequacy, 2013, https://www.fns.usda.gov/sites/default/files/ops/IOMSNAPAllotments.pdf; James P. Ziliak, “Modernizing SNAP Benefits,” Hamilton Project, May 2016, http://www.hamiltonproject.org/assets/files/ziliak_modernizing_snap_benefits.pdf.
c Adam Drewnowski and Petra Eichelsdoerfer, “Can Low-Income Americans Afford a Healthy Diet?” Nutrition Today, 44(6): 246-249, https://www.ncbi.nlm.nih.gov/pmc/articles/PMC2847733/.
d “Thrifty Food Plan, 2006,” USDA Center for Nutrition Policy and Promotion, April 2007, https://www.cnpp.usda.gov/sites/default/files/usda_food_plans_cost_of_food/TFP2006Report.pdf.
Appendix: SNAP Cuts in the President’s 2018 Budget
President Trump’s 2018 budget proposes to cut SNAP by more than $193 billion or more than 25 percent over ten years.[10] Its largest SNAP cut is the cost shift to states detailed in this report, but other provisions would cut eligibility for millions of households and reduce benefits for millions more. The unemployed, the elderly, and low-income working families with children would bear the brunt of these cuts.
| Appendix Table 1 | ||
|---|---|---|
| SNAP Cuts in the President’s 2018 Budget | ||
| Proposal | Federal Savings Over Ten Years | |
| Impose a 25 Percent Match Requirement on States | -$116.2 billion | |
| Restrict Categorical Eligibility | -$31.1 billion | |
| Limit Able-Bodied Adults Without Dependents Waivers | -$20.7 billion | |
| Eliminate Minimum Benefit | -$2.7 billion | |
| Cap Large Households’ Benefit | -$1.8 billion | |
| Retailer Fees | -$2.4 billion | |
| Effects from Eliminating Low Income Home Energy Assistance Program (LIHEAP)/Terminating the SNAP-LIHEAP Connection | -$13.3 billion | |
| Impose Standardized Utility Allowances Across States | -$10.4 billion | |
| Child Support Enforcement Measures | -$0.2 billion | |
| Interactions and Special Immigrant Visa Proposal* | about $5.5 billion | |
| Total | -$193.3 billion | |
For more information, see “Administration’s 2018 Budget Would Severely Weaken and Cut the Supplemental Nutrition Assistance Program,” Center on Budget and Policy Priorities, May 31, 2017, https://www.cbpp.org/research/food-assistance/administrations-2018-budget-would-severely-weaken-and-cut-the-supplemental.
| Appendix Table 2 | ||||||
|---|---|---|---|---|---|---|
| President Trump’s Proposed Budget Would Shift 25 Percent of SNAP Benefit Cost to States | ||||||
| 25 Percent of FY 2016 SNAP Benefit Cost (in millions) |
States’ Required Contribution to SNAP over 10 years (in millions)1 |
|||||
| State/Territory | The magnitude of the average annual state contribution that would be required once the provision is fully in effect. Some states’ required contribution would be higher (and others lower) based on a formula. | 10-year cut assumed in the President’s budget for this provision ($116 billion) allocated to each state based on its share of 2016 SNAP benefits | ||||
| Alabama | $314 | $2,186 | ||||
| Alaska | $44 | $306 | ||||
| Arizona | $351 | $2,442 | ||||
| Arkansas | $144 | $1,006 | ||||
| California | $1,809 | $12,607 | ||||
| Colorado | $182 | $1,268 | ||||
| Connecticut | $171 | $1,194 | ||||
| Delaware | $55 | $384 | ||||
| District of Columbia | $53 | $367 | ||||
| Florida | $1,305 | $9,093 | ||||
| Georgia | $666 | $4,639 | ||||
| Hawaii | $121 | $843 | ||||
| Idaho | $64 | $445 | ||||
| Illinois | $760 | $5,297 | ||||
| Indiana | $267 | $1,861 | ||||
| Iowa | $127 | $884 | ||||
| Kansas | $86 | $596 | ||||
| Kentucky | $245 | $1,709 | ||||
| Louisiana | $387 | $2,695 | ||||
| Maine | $64 | $444 | ||||
| Maryland | $270 | $1,880 | ||||
| Massachusetts | $297 | $2,072 | ||||
| Michigan | $542 | $3,776 | ||||
| Minnesota | $151 | $1,050 | ||||
| Mississippi | $204 | $1,419 | ||||
| Missouri | $296 | $2,061 | ||||
| Montana | $42 | $290 | ||||
| Nebraska | $60 | $419 | ||||
| Nevada | $157 | $1,097 | ||||
| New Hampshire | $30 | $210 | ||||
| New Jersey | $306 | $2,130 | ||||
| New Mexico | $173 | $1,208 | ||||
| New York | $1,231 | $8,574 | ||||
| North Carolina | $562 | $3,917 | ||||
| North Dakota | $20 | $137 | ||||
| Ohio | $599 | $4,173 | ||||
| Oklahoma | $221 | $1,543 | ||||
| Oregon | $268 | $1,869 | ||||
| Pennsylvania | $682 | $4,753 | ||||
| Rhode Island | $68 | $475 | ||||
| South Carolina | $306 | $2,129 | ||||
| South Dakota | $36 | $252 | ||||
| Tennessee | $418 | $2,913 | ||||
| Texas | $1,327 | $9,247 | ||||
| Utah | $75 | $526 | ||||
| Vermont | $29 | $203 | ||||
| Virginia | $292 | $2,037 | ||||
| Washington | $363 | $2,531 | ||||
| West Virginia | $125 | $869 | ||||
| Wisconsin | $231 | $1,607 | ||||
| Wyoming | $12 | $84 | ||||
| Guam | $27 | $185 | ||||
| Virgin Islands | $14 | $99 | ||||
| United States2 | $16,649 | $116,000 | ||||
End Notes
[1] For further details see Dorothy Rosenbaum et al., “Administration’s 2018 Budget Would Severely Weaken and Cut the Supplemental Nutrition Assistance Program,” Center on Budget and Policy Priorities, May 31, 2017, https://www.cbpp.org/research/food-assistance/administrations-2018-budget-would-severely-weaken-and-cut-the-supplemental.
[2] The Administration’s calculation of the amount that states would pay for SNAP benefits ($116 billion over ten years) is based on SNAP benefits before the budget’s other cuts are taken into account. If those other cuts are taken into account first, the total cost shift to states would be lower: about $105 billion (or $15 to $16 billion a year in 2023 and later years). As discussed below, however, the Administration’s estimates of the cuts from this provision are likely far too low, because they assume every state will be able to pay its entire share to maintain current benefit levels.
[3] Elizabeth McNichol, “Out of Balance: Cuts in Services Have Been States’ Primary Response to Budget Gaps, Harming the Nation’s Economy,” Center on Budget and Policy Priorities, April 18, 2012, https://www.cbpp.org/research/out-of-balance.
[4] Michael Mitchell, Michael Leachman, and Kathleen Masterson, “Funding Down, Tuition Up: State Cuts to Higher Education Threaten Quality and Affordability at Public Colleges,” Center on Budget and Policy Priorities, updated August 15, 2016, https://www.cbpp.org/research/state-budget-and-tax/funding-down-tuition-up.
[5] Iris J. Lav and Michael Leachman, “The Trump Budget’s Massive Cuts to State and Local Programs,” Center on Budget and Policy Priorities, June 13, 2017, https://www.cbpp.org/research/state-budget-and-tax/the-trump-budgets-massive-cuts-to-state-and-local-services-and.
[6] Fiscal Year 2018, Budget of the U.S. Government, p. 125, https://www.whitehouse.gov/sites/whitehouse.gov/files/omb/budget/fy2018/budget.pdf. The budget documents say that states would receive “new flexibility regarding benefit levels,” which we interpret to mean that they could cut SNAP maximum benefits across the board but could not eliminate eligibility for specific groups.
[7] Congressional Budget Office, “An Analysis of the President’s 2018 Budget,” July 13, 2017, https://www.cbo.gov/publication/52846, p. 8; Congressional Budget Office, “Proposals for the Supplemental Nutrition Assistance Program – CBO’s Estimate of the President’s Fiscal Year 2018 Budget,” July 13, 2017, https://www.cbo.gov/publication/52903.
[8] Changes to SNAP maximum benefit levels do not affect households that receive the minimum benefit, but because the budget would also eliminates the minimum benefit, every SNAP household would experience a benefit cut.
[9] Megan Stanley, Ife Floyd and Misha Hill, “TANF Cash Benefits Have Fallen by More Than 20 Percent in Most States and Continue to Erode,” Center on Budget and Policy Priorities, October 17, 2016, https://www.cbpp.org/research/family-income-support/tanf-cash-benefits-have-fallen-by-more-than-20-percent-in-most-states.
[10] As discussed in the paper, these estimates likely understate the cut because federal cuts are likely to be greater under the state match provision if states are unable to pay a full 25 percent of current program costs.
More from the Authors

Areas of Expertise

Areas of Expertise