Research Note: Number of People in Families With Below-Poverty Earnings Has Soared, Especially Among Black and Latino Individuals
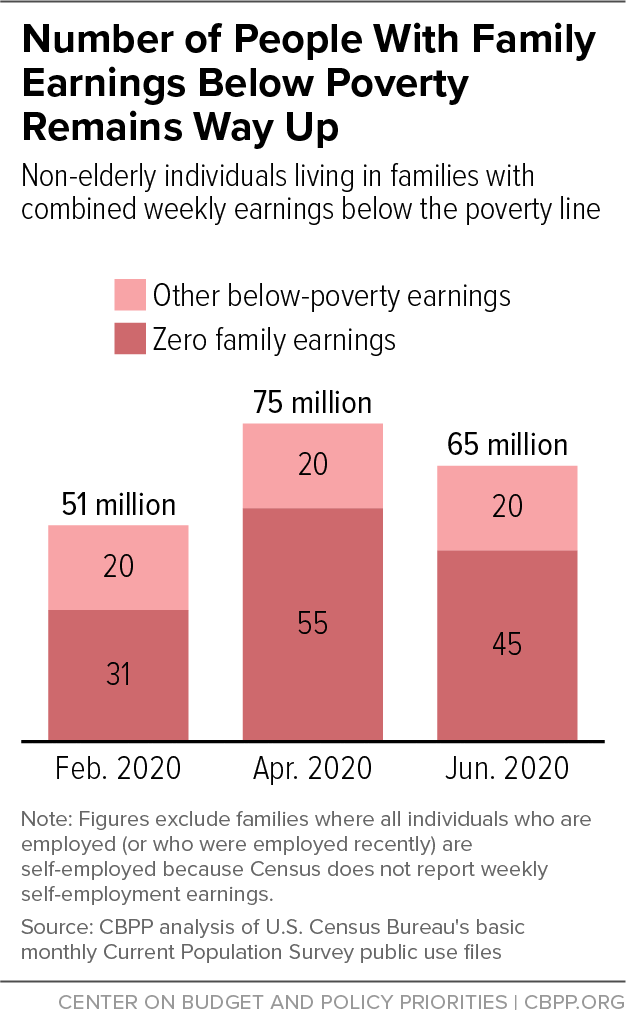
About 65 million non-elderly individuals lived in families with combined weekly earnings below the poverty line in June, CBPP analysis of new Census Bureau data shows — far above the pre-pandemic (February) level of 51 million, though below the April figure of roughly 75 million. (See Figure 1 and Table 1.)
The Bureau of Labor Statistics’ official monthly statistics on the record losses in jobs and wages show the pandemic’s devastating impact on workers as individuals. But they don’t directly show what this means for families’ ability to make ends meet. Our new analysis shows the extent to which families have lost earning power and may now need government help in order to meet basic needs. Government assistance is likely keeping many families’ total income (including government benefits such as unemployment assistance) above the poverty line.
From February to June 2020:
- The number of non-elderly individuals living in families with combined weekly earnings below the poverty line rose by 14.1 million (28 percent), from 51.0 million to 65.1 million.
- The number of non-elderly individuals with no family earnings rose by 13.3 million (43 percent), from 31.3 million to 44.7 million.
- Among non-elderly Black and Latino individuals, the number with below-poverty family earnings rose by 3.6 million (40 percent) and 4.0 million (34 percent), respectively. Among non-elderly, non-Latino whites, the increase was 4.4 million (17 percent).
- The number of children in families with below-poverty earnings rose by 4.9 million (34 percent), from 14.4 million to 19.4 million.
Between June 2019 and June 2020, the number of non-elderly individuals with below-poverty family earnings rose by nearly 10 million. (“Earnings” refers to pay from work and does not include other sources of income, such as interest payments, child support, Social Security, or unemployment insurance benefits. Census traditionally measures poverty based on questions about this broader range of income sources, but those data are not yet available for 2020.)
Many of these families with below-poverty earnings are now receiving help from relief measures, including expanded unemployment and SNAP benefits. But the relief measures enacted to date, including those boosting unemployment benefits and expanding eligibility, are slated to expire in coming months, while the Congressional Budget Office and others project that unemployment will remain high through 2021.
The new data are for the week of June 7 and thus predate the worrisome increases in coronavirus cases that have led some states to reimpose public health restrictions, which could produce more earnings losses.
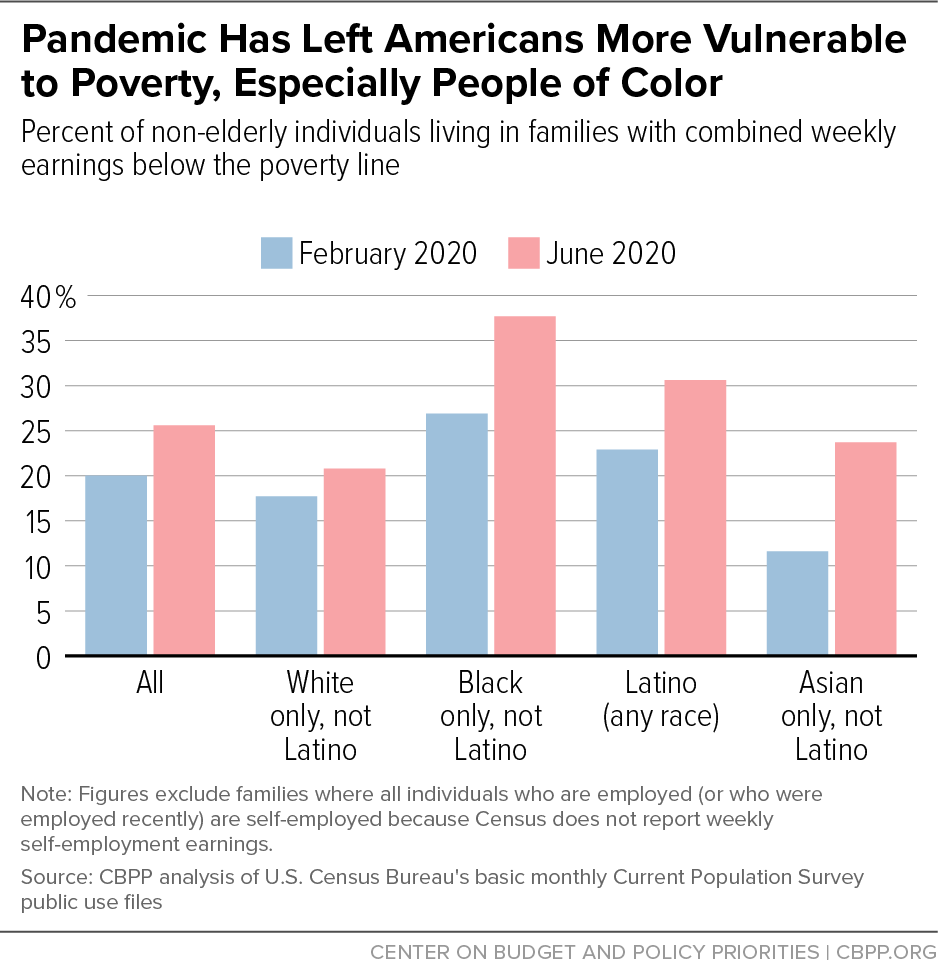
Our analysis also shows that the current recession has hit people of color the hardest. (See Figure 2 and Table 2.) Of special note, Black and Latino workers not only are overrepresented in some of the most-affected industries, but were already at a disadvantage when the recession started due to the nation’s long history of inequitable policies and practices in employment, education, and housing. All racial and ethnic groups have experienced sharp earnings losses, but the share of the non-elderly population living with below-poverty earnings started higher and rose more for Black and Latino individuals than for white individuals. From February to June 2020, the share of non-elderly individuals living with below-poverty family earnings:
- Rose by 10.8 percentage points among Black individuals, from 26.9 percent to 37.7 percent;
- Rose by 7.8 percentage points among Latino individuals, from 22.9 percent to 30.6 percent;
- Rose by 3.2 percentage points among non-Latino white individuals, from 17.7 percent to 20.8 percent.
Among non-elderly Asian individuals, the share living in weekly earnings poverty started lower than for non-elderly, non-Latino white individuals but rose more, by 12.0 percentage points from February to June.
Comparing over the last 12 months to avoid any seasonal influence also shows a large increase in poverty for the overall population. Between June 2019 and June 2020, the share of non-elderly individuals with below-poverty family earnings rose by 4.1 percentage points.
Of those with below-poverty earnings prior to the crisis, some had earnings but earned less than the poverty line; others were between jobs and looking for work or were out of work for other reasons, such as illness, school, or early retirement.
Methodology
These figures are from our analysis of the outgoing rotation group (ORG) of the U.S. Census Bureau’s basic monthly Current Population Survey (CPS).[1] The ORG, which makes up about one-fourth of the basic monthly CPS sample, includes questions about individuals’ usual weekly earnings. Using those data, and annual thresholds for the official poverty measure divided by 52 weeks (and adjusted for monthly inflation by the official Consumer Price Index for all urban consumers), we calculated the number of individuals in families with earnings below the weekly poverty line.[2] (We counted a two-adult two-child family poor in February 2020 if its weekly earnings were below $504; the weekly threshold in June was $503.) The June 2020 survey covered earnings in the week beginning June 7.
The estimates are less precise than the Census Bureau’s official annual poverty figures, in part because the ORG sample is relatively small (about 12,300 households in February) and participation in the survey declined non-randomly in the pandemic (to about 10,900 in June). The smallest group shown here — non-elderly Asian individuals — is based on a sample size of 474 households in the June 2020 survey.[3]
| TABLE 1 | ||||
|---|---|---|---|---|
| Number of Non-Elderly Persons Living in Families With Weekly Earnings Below Poverty Line (in Millions) | ||||
| Percent Change | ||||
| Feb. 2020 | Apr. 2020 | June 2020 | Feb. to June | |
| With Below-Poverty Family Earnings: | ||||
| All | 51.0 | 75.4 | 65.1 | 28% |
| Under 18 | 14.4 | 20.7 | 19.4 | 34% |
| White only, not Latino | 25.5 | 36.4 | 29.9 | 17% |
| Black only, not Latino | 9.1 | 13.3 | 12.7 | 40% |
| Latino (any race) | 12.0 | 19.5 | 16.0 | 34% |
| Asian only, not Latino | 1.8 | 3.8 | 3.7 | 103% |
| In Families With No Earnings: | ||||
| All | 31.3 | 55.4 | 44.7 | 43% |
| Under 18 | 6.8 | 13.2 | 11.2 | 64% |
| White only, not Latino | 16.8 | 28.7 | 21.5 | 28% |
| Black only, not Latino | 6.0 | 10.2 | 9.4 | 56% |
| Latino (any race) | 5.9 | 11.8 | 9.2 | 58% |
| Asian only, not Latino | 1.2 | 3.0 | 2.8 | 128% |
| TABLE 2 | ||||
|---|---|---|---|---|
| Percent of Non-Elderly Persons Living in Families With Weekly Earnings Below Poverty Line | ||||
| Feb. 2020 | Apr. 2020 | June 2020 | Percentage- Point Change Feb. to June | |
| With Below-Poverty Family Earnings: | ||||
| All | 20.0% | 29.8% | 25.6% | 5.6% |
| Under 18 | 21.4% | 30.9% | 28.5% | 7.1% |
| White only, not Latino | 17.7% | 25.5% | 20.8% | 3.2% |
| Black only, not Latino | 26.9% | 39.6% | 37.7% | 10.8% |
| Latino (any race) | 22.9% | 37.1% | 30.6% | 7.8% |
| Asian only, not Latino | 11.6% | 24.4% | 23.7% | 12.0% |
| In Families With No Earnings: | ||||
| All | 12.3% | 21.9% | 17.6% | 5.3% |
| Under 18 | 10.1% | 19.6% | 16.6% | 6.4% |
| White only, not Latino | 11.7% | 20.1% | 15.0% | 3.3% |
| Black only, not Latino | 17.9% | 30.4% | 27.8% | 9.9% |
| Latino (any race) | 11.2% | 22.4% | 17.7% | 6.4% |
| Asian only, not Latino | 7.7% | 19.3% | 17.6% | 9.9% |
End Notes
[1] These figures reflect three refinements to a previous version of this analysis released on June 16, 2020. First, when calculating weekly earnings, we assigned zero earnings to workers who reported that they were absent from work all week without pay, even if they reported a “usual weekly earnings” amount. Second, for individuals classified as hourly workers, we calculated their weekly earnings as their hourly wage times their actual hours worked during the reference week. Third, we excluded families where all individuals who are employed (or who were employed recently) are self-employed because Census does not report weekly self-employment earnings.
[2] The analysis includes people in one-person family units.
[3] The latest official poverty estimates from the CPS Annual Social and Economic Supplement were based on 68,000 households interviewed in February through April 2019.
The Census Bureau multiplies each CPS respondent’s results by a “sample weight” to represent the total U.S. population. For the ORG sample, Census provides special ORG sample weights for persons ages 16 and older, which we use in this analysis. For children under 16, we use their final sample weight multiplied by their family head’s ORG-to-final-sample weight ratio.
More from the Authors