January 30 Data Release Will Capture Only a Portion of the Jobs Created or Saved By the Recovery Act
On January 30, the Recovery Accountability and Transparency Board will post on its website, www.recovery.gov, data on jobs funded by the American Recovery and Reinvestment Act (ARRA). This data release will capture only a portion of the jobs created and saved by the Act, due to ARRA’s limited reporting requirements.
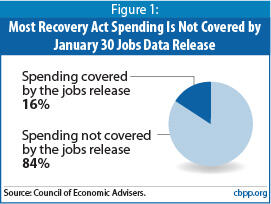
According to the Council of Economic Advisers, ARRA’s reporting system covered only 16 percent of ARRA expenditures through the end of 2009. [1] Most of ARRA’s distributed dollars to date have gone directly to individuals (including greater jobless benefits and food stamps) and states (including greater federal support for Medicaid). Although these dollars are likely protecting or creating hundreds of thousands of jobs, none of the aid for individuals or the Medicaid support are reflected in the January 30 jobs data release.
Moreover, the release will not even capture all of the jobs created by the 16 percent of ARRA funds for which the government reported. Recipients of ARRA grants and loans, for instance, will report on the jobs that they created or retained, but such reporting will not capture the jobs that were indirectly generated by the projects in question, such as by suppliers of goods and services to the projects.
Separate from the January 30 jobs data release, ARRA requires the Council of Economic Advisers (CEA) to report each quarter on the law’s full impact in protecting or creating jobs. The CEA’s most recent quarterly report, issued on January 13, provides a better measure of ARRA’s jobs impact than what the Administration will report on January 30.
Most Recovery Act Spending Is Not Included in the January 30 Jobs Data Release
Some 84 percent of the Recovery Act’s spending through December 31, 2009 is outside of the jobs reporting requirements in the Act. But there is substantial reason to believe that this 84 percent includes some of the most effective job-creation and job-protection measures, even though it would have been meaningless to mandate that the specific jobs created by these programs be tracked.
- Jobs generated by federal aid going directly to individuals will not be reported.These provisions, totaling nearly $45 billion as of the end of December, include a boost in unemployment insurance benefits for laid-off workers and an increase in food stamp benefits for vulnerable families (see Appendix). The tens of millions of individuals receiving these benefits spend them at grocery stores and other businesses, making it easier for these businesses to retain their existing employees or hire more workers. The employees of those businesses consequently have more income than they would have otherwise, allowing them to spend more, which props up the revenue of other businesses. Economist Mark Zandi of Moody’s Economy.com estimates that every dollar spent on extending unemployment insurance benefits produces $1.61 in economic activity, and every dollar spent on temporarily increasing food stamp benefits produces $1.74 in economic activity. [2] Although this increased economic activity produces and sustains jobs, the Recovery Act exempts individual recipients of Recovery Act aid from the jobs reporting requirements because it is impractical for individuals to track how their spending affects jobs after it leaves their hands.Image
- Jobs generated by additional Medicaid funds to states will not be reported. As of the end of December, states had spent $41 billion in extra Medicaid support provided through the Recovery Act (see Appendix). According to the Government Accountability Office, states have used these funds in part to pay hospitals, doctors, and others to provide health care to the rising number of families that have lost jobs and income and therefore are eligible for public insurance. [3] As a result, health care providers have more income and hence are more able to sustain or increase the number of doctors, nurses, and other staff they employ. The GAO reports that states have also used the extra Medicaid support to avoid cuts in other areas of state government (such as education and human services) and to minimize tax increases that otherwise would be necessitated by state balanced budget requirements. Such actions have bolstered income for state residents, jobs for state employees, and profits for private firms contracting with the government.
Despite the value of this spending for sustaining and creating jobs, the Recovery Act exempts states from reporting jobs created with the Medicaid funds. The technical reason for this exemption is that generally the Act covers jobs created with “appropriations,” and Medicaid is not considered an “appropriation” under federal budget rules. But there is also a practical reason: Medicaid spending occurs through a very large number of individual transactions between states and primarily private sector health care providers. For states to track the jobs produced and sustained in the private sector by these myriad transactions would be impractical and overly burdensome on states. - Jobs generated by tax cuts will not be reported. As of the end of December, Recovery Act tax cuts had delivered about $106 billion to hundreds of millions of individual and business taxpayers. Although taxpayers have saved some of this money, they have also spent much of it at businesses in their communities and other parts of the United States. This spending has produced income for U.S. businesses, allowing these firms to keep current employees and in some cases hire more. But it is impractical to expect individuals and businesses receiving tax breaks to determine the impact of their tax break spending on U.S. jobs. As a result, the Recovery Act exempts recipients of tax breaks from the jobs reporting requirements.
Even Among Spending Included in the Jobs Report, a Significant Share of Jobs Are Missed
While most recipients of Recovery Act funds are exempted from reporting on jobs , some recipients are required to submit quarterly reports. Data from the first quarterly reports were released in October. Data from the second quarterly reports will be released January 30, 2010.
Even among projects included in these reports, a significant share of the jobs saved or created by the Recovery Act are missed. That is in part because no recipients were required to report on jobs indirectly generated by the project. Hence, no jobs saved or produced by the Recovery Act in firms that serve as suppliers to Recovery Act projects were included, though clearly these suppliers benefited from the Act. In addition, recipients were not required to estimate the number of jobs induced in the economy as a result of the workers on Recovery Act projects spending the wages they received. The Council of Economic Advisers estimates that these “induced” jobs will account for 36 percent of all “job-years” produced by the Recovery Act. The Council defines a “job-year” as one job for one year.
| TABLE 1: | |||
| Alabama | 27,000 | Montana | 7,000 |
| Alaska | 5,000 | Nebraska | 11,000 |
| Arizona | 43,000 | Nevada | 20,000 |
| Arkansas | 17,000 | New Hampshire | 9,000 |
| California | 256,000 | New Jersey | 65,000 |
| Colorado | 33,000 | New Mexico | 12,000 |
| Connecticut | 26,000 | New York | 141,000 |
| Delaware | 6,000 | North Carolina | 62,000 |
| District of Columbia | 10,000 | North Dakota | 5,000 |
| Florida | 112,000 | Ohio | 79,000 |
| Georgia | 63,000 | Oklahoma | 23,000 |
| Hawaii | 8,000 | Oregon | 28,000 |
| Idaho | 10,000 | Pennsylvania | 84,000 |
| Illinois | 96,000 | Rhode Island | 8,000 |
| Indiana | 48,000 | South Carolina | 28,000 |
| Iowa | 23,000 | South Dakota | 6,000 |
| Kansas | 19,000 | Tennessee | 40,000 |
| Kentucky | 27,000 | Texas | 147,000 |
| Louisiana | 26,000 | Utah | 18,000 |
| Maine | 10,000 | Vermont | 5,000 |
| Maryland | 36,000 | Virginia | 48,000 |
| Massachusetts | 53,000 | Washington | 45,000 |
| Michigan | 69,000 | West Virginia | 10,000 |
| Minnesota | 41,000 | Wisconsin | 44,000 |
| Mississippi | 17,000 | Wyoming | 4,000 |
| Missouri | 40,000 | TOTAL U.S. | 2,068,000 |
| Source: Council of Economic Advisers, “The Economic Impact of the American Recovery and Reinvestment Act of 2009, Second Quarterly Report,” January 13, 2010, p. 21. Notes: Figures estimate job impact of all ARRA spending in 4th quarter based on Council of Economic Advisers’ statistical projection of likely path of GDP given the relationship of GDP and employment in 1990-2007. Total U.S. estimate is allocated to states based on average of three methods: state share of non-farm employment, state share of Recovery Act outlays through December 2009, and an estimation based on state shares of particular job sectors. State figures do not add to total U.S. figure due to rounding. | |||
Change in How Recipients Estimate Jobs Impact
In response to recommendations from the Government Accountability Office and to improve the Act’s transparency, the White House changed the way it is asking recipients to count job impacts. Because of these changes, the figures to be released January 30 will not be consistent with the figures released in October 2009 and cannot be added to the October numbers to get an accurate, cumulative total of the number of jobs saved or created by projects included in the recipient reports.
In October, recipients were required to estimate how many jobs were saved or created by ARRA funds using complicated guidance as to how to make those estimates. This created some confusion among recipients, in part because it was difficult to understand how to make the estimate when ARRA funds were used to pay a portion of a worker’s salary. For the January reports, by contrast, recipients are required to count the number of work hours directly funded by the Act and divide these hours by the number of hours in a full-time work schedule for the quarter. This simpler method is easier for recipients, but will make the figures in the January reports inconsistent with those released in October.
Comprehensive Estimates of Recovery Act Jobs Are Available
The January 30 jobs data release will be a useful source of information about jobs created or retained by the Recovery Act, but estimating the full jobs impact of the Act requires a comprehensive approach. The Recovery Act requires such comprehensive estimates be produced quarterly by the Council of Economic Advisers.
In the most recent of these reports, issued on January 13, 2010, the Council employs two different statistical models to estimate the jobs impact of the Recovery Act as of the fourth quarter of 2009. The first statistical model concludes the Act saved or created 2.1 million jobs; the other estimates the number at 1.8 million jobs. Both findings are consistent with the Congressional Budget Office’s estimate of the Recovery Act’s fourth quarter 2009 jobs impact — 800,000 to 2.4 million jobs. The CEA’s estimates are somewhat higher than the estimates of private forecasters IHS/Global Insight, Macroeconomic Advisers, and Moody’s Economy.com, which range from 1.1 million to 1.6 million jobs.[4]
It is impossible to know precisely how many jobs were saved or created by the Recovery Act, but the Council’s estimates, along with the estimates of other professional forecasters, support the view that the Recovery Act has saved or created a large number of jobs.
| APPENDIX: | ||||
| Extended Unemployment Compensation | Extra $25/Week in Unemployment Benefits | Increased Food Stamps | Extra Medicaid Funds to States | |
| Alabama | $227 | $113 | $133 | $451 |
| Alaska | $19 | $22 | $17 | $95 |
| Arizona | $347 | $162 | $173 | $986 |
| Arkansas | $205 | $80 | $77 | $306 |
| California | $4,146 | $1,335 | $605 | $4,954 |
| Colorado | $426 | $112 | $71 | $369 |
| Connecticut | $496 | $147 | $58 | $636 |
| Delaware | $63 | $25 | $18 | $162 |
| District of Columbia | $71 | $28 | $21 | $163 |
| Florida | $1,554 | $547 | $435 | $2,305 |
| Georgia | $849 | $262 | $270 | $863 |
| Hawaii | $115 | $30 | $38 | $171 |
| Idaho | $113 | $49 | $29 | $142 |
| Illinois | $1,504 | $465 | $307 | $1,460 |
| Indiana | $783 | $226 | $142 | $695 |
| Iowa | $215 | $80 | $57 | $253 |
| Kansas | $209 | $76 | $42 | $231 |
| Kentucky | $336 | $117 | $133 | $557 |
| Louisiana | $109 | $67 | $141 | $653 |
| Maine | $74 | $30 | $39 | $289 |
| Maryland | $379 | $117 | $93 | $801 |
| Massachusetts | $1,029 | $251 | $126 | $1,448 |
| Michigan | $1,507 | $463 | $289 | $1,207 |
| Minnesota | $523 | $168 | $66 | $967 |
| Mississippi | $137 | $62 | $94 | $367 |
| Missouri | $356 | $157 | $152 | $760 |
| Montana | $53 | $24 | $19 | $88 |
| Nebraska | $61 | $28 | $25 | $132 |
| Nevada | $469 | $123 | $41 | $229 |
| New Hampshire | $59 | $26 | $15 | $106 |
| New Jersey | $1,662 | $378 | $104 | $1,084 |
| New Mexico | $122 | $41 | $57 | $290 |
| New York | $1,940 | $601 | $541 | $5,678 |
| North Carolina | $1,026 | $336 | $224 | $1,195 |
| North Dakota | $13 | $8 | $11 | $39 |
| Ohio | $1,049 | $353 | $294 | $1,523 |
| Oklahoma | $190 | $65 | $94 | $428 |
| Oregon | $522 | $163 | $115 | $429 |
| Pennyslvania | $1,674 | $507 | $256 | $1,547 |
| Rhode Island | $152 | $42 | $26 | $242 |
| South Carolina | $410 | $148 | $137 | $442 |
| South Dakota | $8 | $6 | $16 | $61 |
| Tennessee | $426 | $170 | $218 | $785 |
| Texas | $1,254 | $437 | $573 | $2,636 |
| Utah | $126 | $48 | $38 | $161 |
| Vermont | $47 | $20 | $13 | $139 |
| Virginia | $334 | $120 | $129 | $754 |
| Washington | $682 | $201 | $146 | $839 |
| West Virginia | $78 | $38 | $55 | $226 |
| Wisconsin | $527 | $234 | $99 | $708 |
| Wyoming | $29 | $13 | $5 | $42 |
| Source: Recovery.gov | ||||
End Notes
[1] Council of Economic Advisers, “The Economic Impact of the American Recovery and Reinvestment Act of 2009,” Second Quarterly Report, January 13, 2010, p. 29.
[2] Mark Zandi, “The Impact of the Recovery Act on Economic Growth,” Testimony before the Joint Economic Committee, October 29, 2009, p. 3.
[3] Government Accountability Office, “RECOVERY ACT Funds Continue to Provide Fiscal Relief to States and Localities, While Accountability and ReportingChallenges Need to be Fully Addressed,” September 2009.
[4] Council of Economic Advisers, “The Economic Impact of the American Recovery and Reinvestment Act of 2009, Second Quarterly Report,” January 13, 2010, pp. 25-26.
More from the Authors