This report was commissioned by the Center on Budget and Policy Priorities’ Full Employment Project. Views expressed within the report do not necessarily reflect the views of the Center.
Summary
The most recent releases of Gross Domestic Product (GDP) imply that the current level of U.S. output is almost equal to the Congressional Budget Office’s (CBO’s) estimate of the “potential level of GDP,” a measure of how much the U.S. economy could produce if its resources were fully and efficiently utilized. The World Bank further estimates that this closing of the output gap has occurred not just in the U.S. but across most advanced economies (World Bank 2018). Ten years after the onset of the Great Recession, according to this view, the economy has finally returned to its potential level and economic policy instruments should be gradually returned to normal levels, a process the Federal Reserve is now implementing.
In this brief, based on our earlier research, we challenge this conclusion. According to our analysis, CBO’s and other similar estimates of potential output are too pessimistic, and as such, they encourage policymakers, such as those at the Federal Reserve, to accept lower levels of potential than those which could be achieved. This pessimistic view and associated policies could be extremely costly to U.S. households.
Our findings include:
- In deriving potential GDP, current methods used by key agencies tend to under-respond to the shocks they should respond to and over-respond to the shocks that they should not respond to.
- Most recently, this has led to some frequently used estimates of potential GDP that are as much as $1.2 trillion, or nearly $10,000 per household, below our preferred estimate.
- Methods that do not feature the under-/over-responsiveness problem we document imply that more active stimulus on the part of the Federal Reserve is warranted to enable actual GDP to finally catch up to potential.
- The benefits of this policy shift would include significantly greater household incomes and higher employment levels than those engendered by the current policy stance.
Should the Federal Reserve be Raising Rates due to a Closing Output Gap?
On December 13th, 2017, the Federal Open Market Committee (FOMC) of the Federal Reserve announced that it was raising interest rates for the third time that year. In its announcement,[1] the FOMC cited several factors, including a low unemployment rate, high rates of utilization of inputs by firms, and more broadly, a general view that the U.S. economy was approaching its capacity. This perspective, which we will loosely refer to as the “Fed view”, is buttressed by the Congressional Budget Office’s (CBO’s) recent estimates of the “potential level of GDP” (an attempt to measure how much the U.S. economy could produce if its resources were fully and efficiently utilized), which suggest that the U.S. economy is currently at or near this potential level of GDP. The World Bank further estimates that this closing of the output gap has occurred not just in the U.S. but across most advanced economies (World Bank 2018). Ten years after the onset of the Great Recession, according to this view, the economy has finally returned to its potential level and economic policy instruments should be gradually returned to normal levels, a process the Federal Reserve is now implementing.
However, as illustrated in Figure 1 below, the fact that the current level of economic activity is approximately equal to the CBO’s estimate of potential does not reflect the fact that U.S. GDP has made up for lost ground; rather, it primarily reflects downward revisions in estimates of the productive capacity of the U.S. economy since the Great Recession. In 2007, prior to the Great Recession, the CBO was projecting that the U.S. economy in 2017 would be generating approximately 13 percent more income per year than it currently is. Since the start of the Great Recession, the CBO has been progressively revising its forecasts of potential GDP downwards.
Figure 1: Recent Revisions in CBO Estimates of U.S. Potential Output.
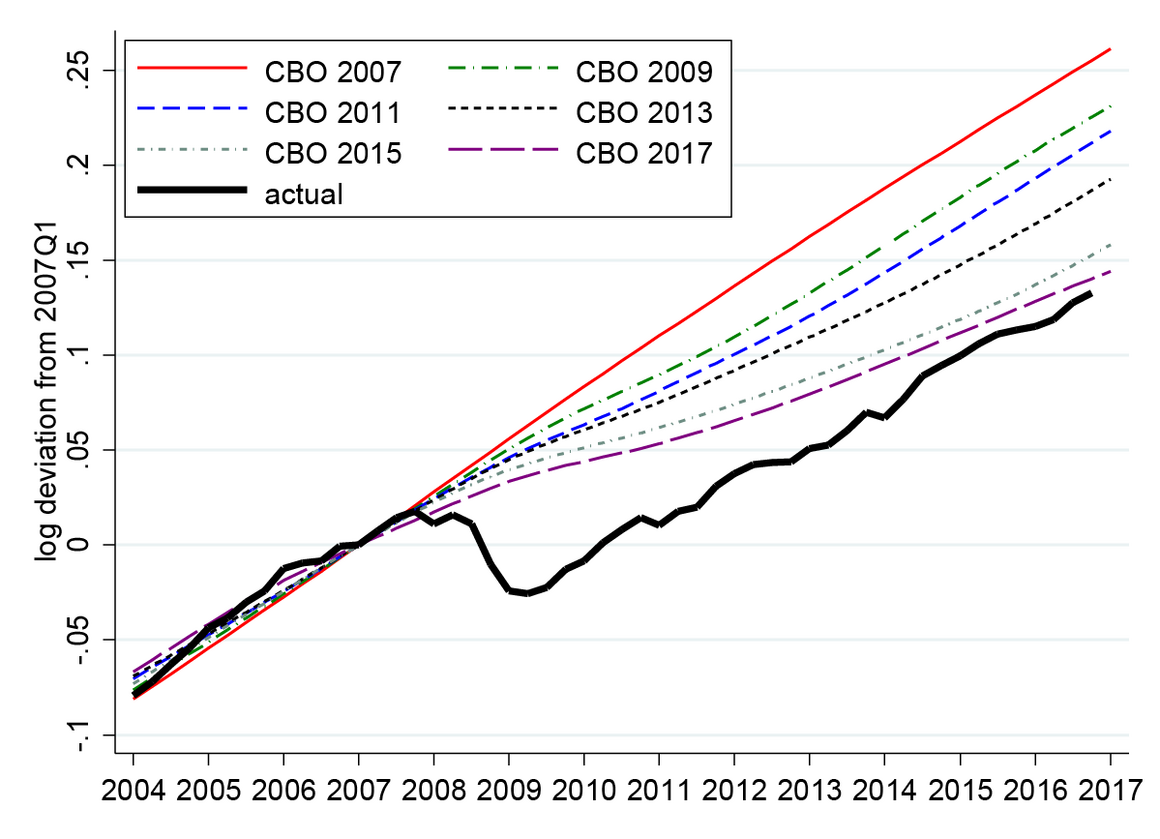
Notes: The figure plots estimates of U.S. potential output from the Congressional Budget Office made at different time periods. The solid black line represents real GDP in the U.S.
The Federal Reserve has embraced this view, with Janet Yellen claiming in a recent testimony to Congress that “a key reason” for the slow growth since the Great Recession was structural factors, such as declines in the labor force due to demographics, outside the Fed’s purview.[2] Is the Federal Reserve correct in its view that slow growth in potential output since the Great Recession implies that the U.S. economy is currently close to its productive capacity and that further monetary or fiscal stimulus would primarily serve to increase inflationary pressures? There are reasons to be skeptical of this view. One such reason is that the productive capacity of the economy may itself not be immune to the decisions of monetary policymakers. This view, promulgated recently in Blanchard (2017), argues that monetary policy actions (as well as other demand shocks, like a recession or period of stronger-than-expected growth) can themselves affect the productive capacity of the economy, even lastingly over substantial time periods. Under this logic, demand shocks might well have reduced the level of potential output in the U.S. economy following the Great Recession, as suggested by Figure 1, but more aggressive monetary and fiscal policies could still be warranted because these could help raise the productive potential of the economy in the long run through their stimulative effects on private investment (leading to a larger capital stock) and labor force participation (by bringing discouraged workers back into the labor force).
Economists discuss these dynamics under the rubric of “hysteresis,” meaning that negative shocks to demand can have lasting, negative impacts on the key factors that determine potential GDP, most notably labor supply, capital investment, and productivity. Note that our formulation introduces the possibility of “reverse hysteresis,” the idea that policy can boost these supply-side factors with positive implications for potential GDP.
Another reason for skepticism about the “Fed view” is historical. There is no shortage of historical episodes during which policymakers mistakenly provided stimulus because they overestimated the productive capacity of the economy and vice versa. A particularly famous example is from the 1970s during the “Great Inflation” period. A popular view for why inflation rose so significantly over this period is that the Federal Reserve mistakenly believed that the productive capacity of the economy was significantly higher than it actually was and therefore provided monetary stimulus when more temperance was called for. At a minimum, this experience calls for caution in interpreting real-time estimates of potential output and how far the economy might be from capacity. Indeed, in new research (Coibion, Gorodnichenko and Ulate 2017), we provide novel empirical evidence, in the spirit of the example from the 1970s, that suggests that current estimates of U.S. potential output are far too pessimistic. The immediate implication is that the Federal Reserve is making the opposite mistake from the 1970s, by removing monetary stimulus at a time when it remains very much warranted.
How Official Estimates of the Potential Level of GDP Are Made
There are a number of institutions that must estimate the productive capacity of an economy. Central banks, for example, need to know whether the level of economic activity is too high or too low to determine whether they should be raising or lowering rates, where high and low must be defined relative to a notion of a potential level of GDP. Budget-related organizations, like the CBO, need to construct estimates of potential GDP to estimate long-run trends in government spending and tax receipts. International organizations, like the Organisation for Economic Co-operation and Development (OECD) and the International Monetary Fund (IMF), similarly require measures of potential output in an economy to assess its long-run fiscal solvency. Private forecasters create estimates of long-run growth in an economy that are used for business decisions.
Constructing estimates of the productive capacity of an economy is clearly no easy task and these organizations use a number of different approaches, often in conjunction. The “production function” approach, used most prominently by the CBO, involves measuring how much of different inputs (capital, labor, etc.) could potentially be utilized if the economy were operating at its efficient level, meaning that there is neither inflationary nor deflationary pressure. It then uses its estimates of those inputs to assess how much could ultimately be produced by the economy. Another class of methods relies on statistical decompositions of GDP (and other variables) into components that represent the trend (of potential output) versus deviations from the trend (the cycle). A third general approach is to estimate a stylized model of the economy and then use that estimated model to infer what the productive capacity of the economy has been, is, and will be in the future. A fourth approach is less formal and applies “judgment” to any of the above based on practitioners’ perceptions of the relative strengths and weaknesses of these formal methods combined with other evidence that they observe. Agencies and institutions responsible for creating estimates of potential output commonly use a combination of these approaches.
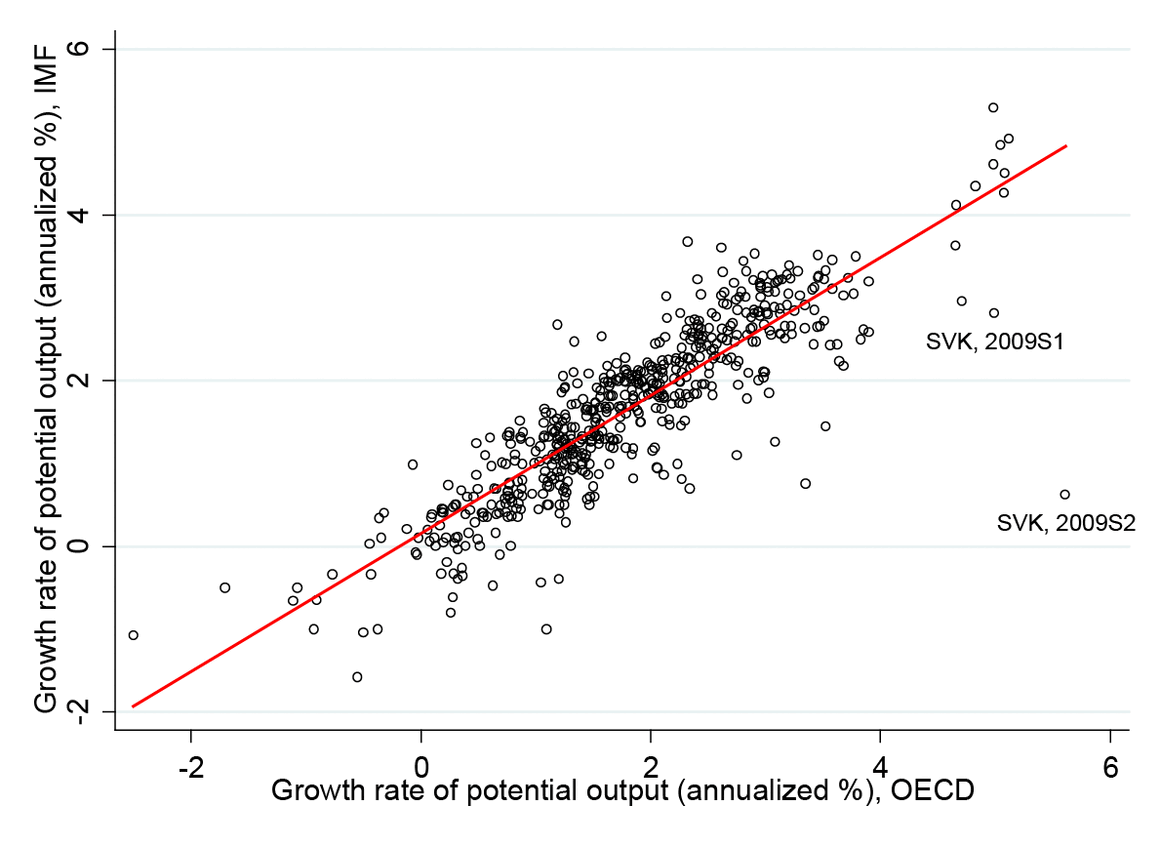
As shown in Appendix Figures 1 and 2, different agencies and institutions generally reach similar conclusions about estimates of potential output and its growth rate. Growth rates of potential GDP made by two different agencies (the IMF and OECD) for 25 countries over the period of 2003-2016 are strongly and positively correlated. Though differences arise on occasion, historical estimates over a longer period for a single country, the U.S., yield a similar finding across a larger range of sources of estimates of potential output growth, including independent estimates from the CBO, the Federal Reserve, the IMF, and the OECD. Most importantly for our work, there is broad consensus on the major changes in the productive capacity of the U.S. economy over time, especially the fact that productive capacity of the U.S. economy has grown unusually slowly since the onset of the Great Recession.
Should We Believe Recent Revisions in Estimates of Potential Output?
Given the importance that estimates of the productive capacity of an economy play in both fiscal and monetary policy decisions, it is essential to assess the quality of these estimates. Estimates of potential GDP that are biased down, for example, could lead policymakers to restrict the economy’s growth at great cost to the economic opportunities of households within that economy. Conversely, estimates of the economy’s capacity that are biased up could lead to severe inflationary periods that also come at great cost. In our recent research, we propose a way to assess the quality of real-time estimates. Specifically, we argue that high-quality estimates of potential GDP should respond to shocks that are perceived as affecting potential GDP, such as permanent changes in technology (“supply” shocks), but not respond to transitory monetary and fiscal policy changes (“demand” shocks). Separating out these effects is of great consequence for both policy and living standards. For example, if estimates of potential GDP conflate a temporary negative demand shock with a permanent negative supply shock, that will invoke the “biased-down” scenario noted above.
We apply this intuition to real-time estimates of potential output from the CBO, the Fed, the IMF, the OECD, and private forecasters, and assess how they respond to three supply-side shocks (changes in productivity, tax rates, and oil prices) as well as three demand-side shocks (changes in monetary policy in addition to anticipated and unanticipated changes in government spending). For ease of exposition, we present in Figure 2 below results for how real-time estimates of potential output across a wide range of countries from the IMF respond to one supply shock (productivity in that country) and one demand shock (monetary policy in that country), but similar results hold for other shocks and other real-time estimates of potential GDP, both across countries and in the U.S.
Figure 2. Response of the growth rate for actual output and IMF’s measure of potential output (nowcast).
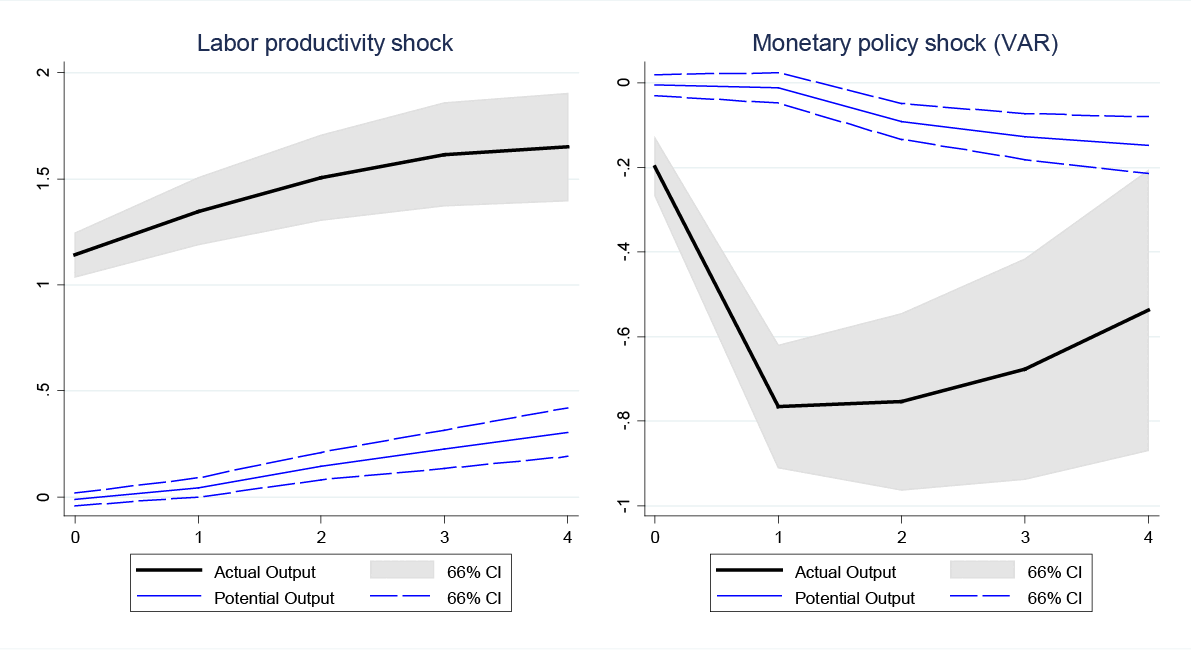
Notes: The figure shows impulse response functions (IRFs) for growth rates of actual and potential output (nowcast). The horizontal axis measures time in semesters (6 months). The vertical axis measures growth rate of output per year.
In response to a positive productivity shock, the upper, solid line in the figure shows that output rises immediately and stays permanently higher, from around 1 to 1.5 percent per year. This is consistent with this shock being a permanent supply change that should therefore be interpreted as affecting the productive capacity of the economy. But the lower lines in the figure, which are the IMF’s estimates of potential GDP, start out much lower and rise only gradually and modestly after this change in productivity. Real-time estimates of potential output therefore display an insufficient response to the supply-side shocks that immediately affect the productive capacity of the economy.
Turning to a contractionary demand shock originating from monetary policy, we find that actual output (once again, the dark, solid line) responds in a transitory manner (effects die out after a few years), consistent with these policy changes not having long-lived effects on the productive capacity of the economy, i.e. there is no evidence for “hysteresis” (a permanent change from a temporary shock). Yet the real-time estimates of potential output from the IMF decline after this contractionary shock in a gradual but protracted manner, indicating that the fall in output induced by monetary policymakers leads the IMF to gradually lower its estimates of potential output after this policy change, as they mistake a temporary impact for one that is longer-lasting. Real-time estimates of potential output therefore display an excess sensitivity to demand-side shocks that should have little effect on potential output.
Jointly, these results underscore the central finding of our research: real-time estimates of potential output under-respond to the shocks they should respond to and over-respond to the shocks that they should not respond to. Why are statistical agencies, policy institutions, and private forecasters not adjusting their estimates of potential output correctly? One possibility is that it is impossible in real-time to know whether changes in GDP are coming from permanent supply-side factors or transitory demand-side changes. In this case, one might expect statisticians to tentatively change their estimates of potential output in the same direction as contemporaneous changes in GDP as they await additional data which will allow them to distinguish which explanation proves to be the right one. But as we show later, it is possible to distinguish between supply and demand shocks in real-time, so this cannot be the right explanation.
Instead, we argue that these cyclical properties of real-time estimates of potential output are a natural consequence of the methods used to generate the estimates. Statistical filters applied to GDP, in particular, can loosely be thought of as moving averages of recent changes in GDP which are then labeled as potential GDP. These slow-moving averages by construction respond gradually but persistently to all changes in GDP regardless of their origin, much as we observe in Figure 4. To verify this, we create our own real-time estimates of GDP across countries and time by applying one such statistical filter (a one-sided Hodrick-Prescott filter) using the same data as would have been available to policymakers over time, and find that this simple approach to estimating potential GDP closely replicates the patterns documented for IMF and other sources of real-time estimates of potential GDP: under-responses to supply-side shocks and over-responses to demand-side shocks.
The key implication of these results is that observing a sequence of downward revisions in estimates of potential output, like those of the CBO for the U.S. since the start of the Great Recession, is completely uninformative about the economic source of the decline in output and about its expected duration. Any persistent decline in output will mechanically tend to lead to downward revisions in estimates of potential GDP over time, creating a costly downward bias to these estimates. To understand what has actually happened to potential output, therefore, one must dig deeper than the real-time estimates of the CBO, the IMF and OECD, or those of private forecasters.
Alternative Approaches to Estimating Potential GDP since the Great Recession
The inability of standard approaches to differentiate between supply and demand shocks suggests a natural starting point: methodologies that can do precisely that. One such approach was developed by Blanchard and Quah (1989, “BQ” henceforth). They propose a statistical approach based on the joint dynamics of output and unemployment that identifies demand shocks as those that have no permanent effect on output whereas supply-side shocks do. The potential level of GDP can then be reconstructed by creating an estimated level of GDP in the presence of only supply shocks. By construction, this approach rules out hysteresis, or lasting effects from demand shocks. But we view this as a reasonable starting point for several reasons. First, there is at most only tentative evidence supporting hysteresis, as discussed in Blanchard (2017). Second, the standard models used by central banks and other policy institutions also rule out hysteresis effects by assumption. Third, and most importantly, hysteresis effects will only reinforce the policy implications that we derive from these methods, so the two interpretations of the data yield the same policy conclusions.
To assess how well the BQ methodology works, we replicate what policymakers would have estimated for potential GDP had they applied this method each period in the U.S. given the data available to them at the time. Treating the BQ estimates of potential output in the same way as we did those of the CBO, IMF, etc., we consider how they respond to each of the three supply and demand shocks, both in the U.S. and other countries. Strikingly, and despite the fact that the BQ approach does not explicitly distinguish between different kinds of supply shocks and different kinds of demand shocks, we find that real-time estimates from the BQ methodology react quickly and fully to supply shocks but do not respond to demand shocks. In other words, the BQ methodology is successful at differentiating between different types of economic impulses in real time and can therefore provide a measure of potential GDP which is driven exclusively by long-lasting supply factors as opposed to temporary demand shocks.
Given this success of the BQ approach in distinguishing between different economic driving forces, we use it to revisit the evolution of the productive capacity of the U.S. economy since the start of the Great Recession. Figure 3 below plots the resulting estimates, starting with forecasts from 2007 continuing through real-time estimates as of 2017. Like the CBO estimates, they indicate that the Great Recession was followed by a decline in the productive capacity of the U.S. economy, but not nearly by as much. As of early 2017, the BQ methodology suggests that U.S. real GDP remained approximately 6 percentage points below its potential level, leaving a shortfall of approximately $1.2 trillion or nearly $10,000 per household.
Figure 3: Revisions in Estimates of U.S. Potential Output from Blanchard-Quah (1989) approach.
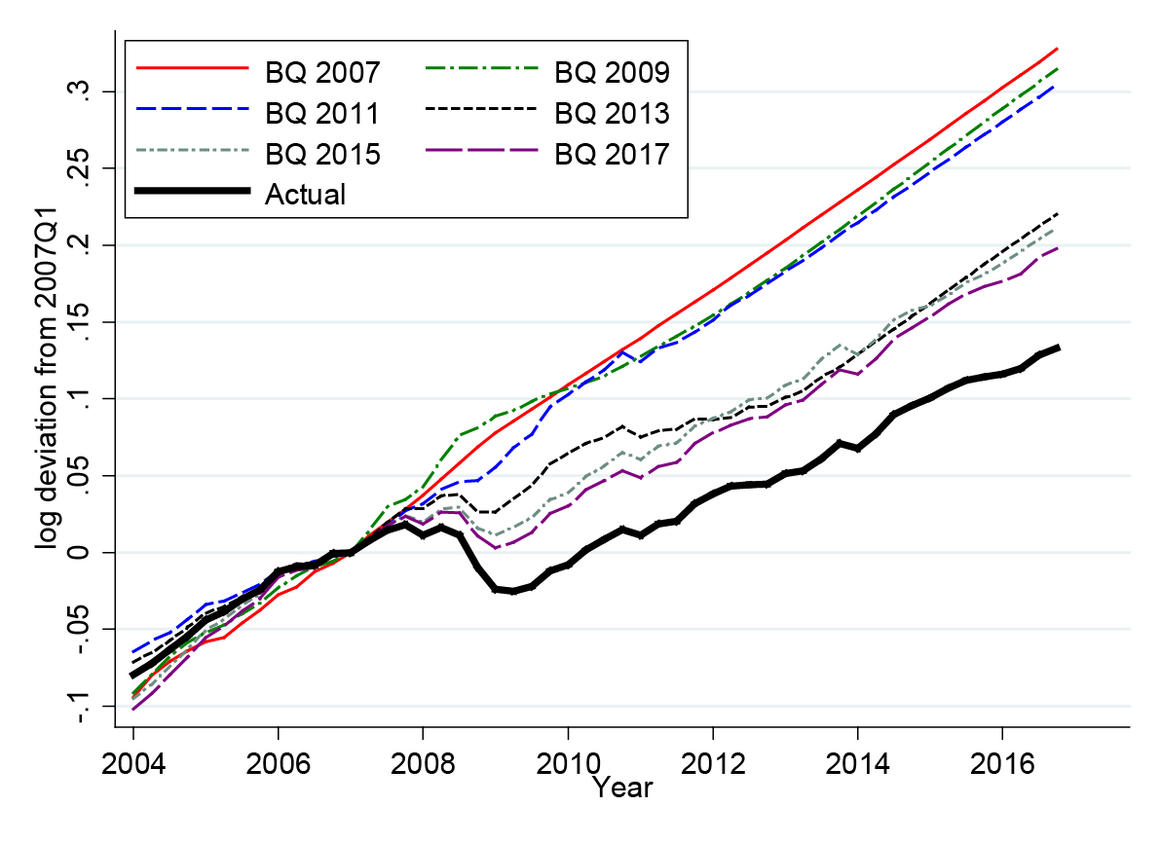
Notes: The figure plots estimates of U.S. potential output made at different time periods using the Blanchard and Quah (1989) methodology estimated in real time. The solid black line represents real GDP in the U.S.
Such a large amount of estimated slack is not unique to the BQ approach, however. A related approach, following Gali (1999), identifies changes in productivity through the joint dynamics of output and hours worked and allows for the construction of estimates of potential GDP growth as that driven exclusively by changes in productivity. As illustrated in Figure 4 below, this approach points toward even more remaining slack in 2017 than the BQ methodology. An alternative strategy is to use changes in consumption to help identify potential output. Consumption contains additional information about the persistence of income changes since, using Milton Friedman’s permanent income hypothesis, permanent changes in income should be the main driver of changes in consumption. Following Cochrane’s (2004) empirical formalization of this idea, we show in Figure 4 that this approach yields a 2017 estimate of potential GDP that is 11 percent larger than actual GDP. A final approach exploits the expectations-augmented Phillips curve suggested by Friedman (1968), which posits that deviations of inflation from expectations are tied to deviations of output from its potential level. This approach implies that the U.S. economy in 2017 was 5 percent below its productive capacity. Furthermore, our interpretation is consistent with the fact that inflation has consistently remained below its target in recent years. In short, each of these methods points toward a very large remaining shortfall in U.S. economic activity, one that could be closed through appropriate monetary and fiscal policies.
Figure 4: Alternative Approaches to Estimating U.S. Potential Output since the Great Recession
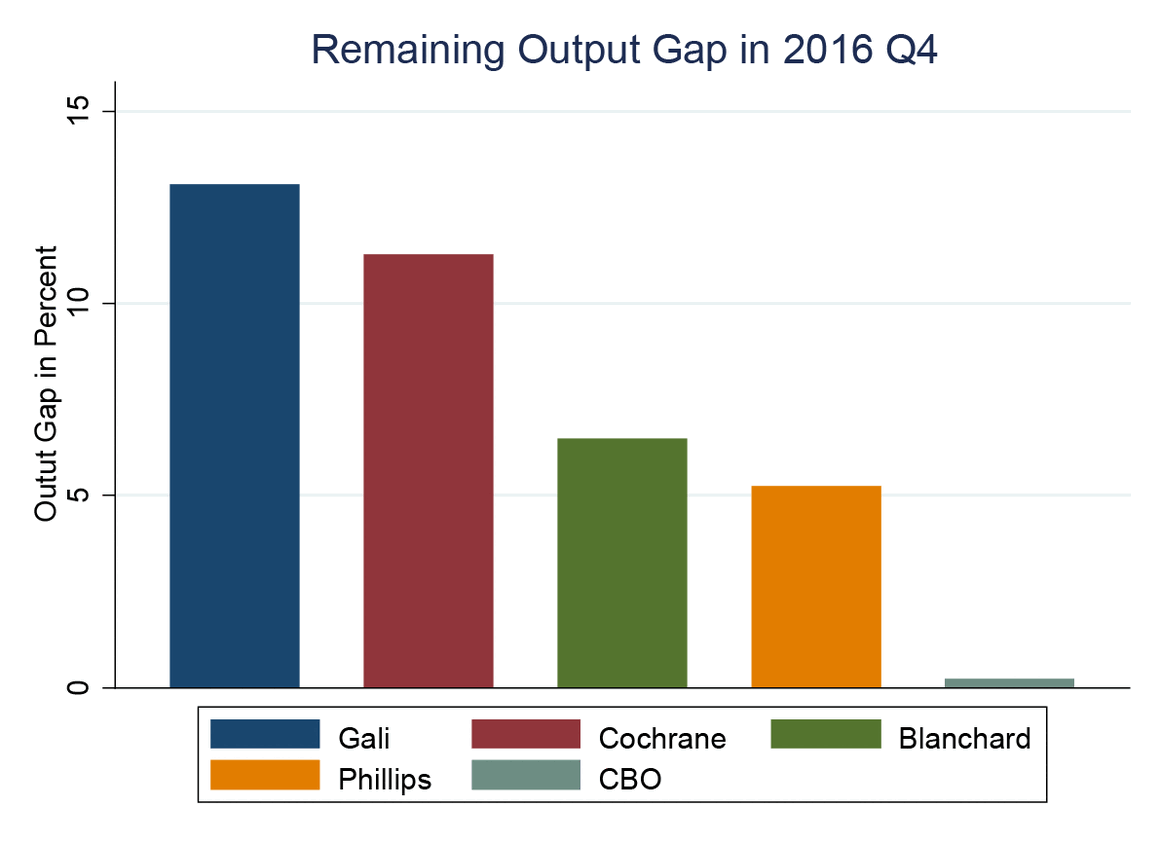
Notes: The figure plots estimated output gaps (shortfall of actual GDP relative to potential GDP) for 2016Q4 for different estimates of potential. “Gali” applies the method of Gali (1999), “Cochrane” applies the method of Cochrane (1994), “Blanchard” applies the method of Blanchard and Quah (1989), “Phillips” uses the Phillips curve, while “CBO” uses the CBO’s latest real-time estimate of potential GDP.
Policy Implications
As U.S. monetary policymakers proceed with their string of interest rate increases in the face of continuing low inflation and low rates of employment, they have received remarkably little pushback. This likely reflects the consensus view among the CBO, Fed, IMF, OECD, and private forecasters that the productive capacity of the U.S. economy has been dramatically lowered since the Great Recession. Our estimates suggest otherwise. Not only do we show that the real-time estimates of potential output emanating from these institutions may have little economic content about long-term growth prospects after major recessions, but the alternative approaches that we consider also point toward a much more optimistic view of the U.S. economy’s productive potential. These higher levels of potential output imply that the U.S. economy is significantly underperforming relative to its potential, effectively leaving over a trillion dollars on the table with each passing year.
The policy implications of this viewpoint are straightforward. Rather than gradually removing monetary accommodation, the Federal Reserve should be aggressively continuing the expansionary policies implemented after the Great Recession. In addition, it should not perceive the recently passed tax cuts as conflicting with its objectives (and therefore as something to be offset with even higher interest rates) but rather as being complementary to its objective of closing the output gap. Additional fiscal stimulus, such as through new spending on infrastructure, should be welcome, not just because of its potential to raise the productive capacity of the economy but also for its short-run stimulative effects.
Policymakers at the Federal Reserve responded aggressively to the financial crash. But they now seem to be in a rush to return to a more traditional policy-making environment and give themselves ammunition in the form of higher interest rates for the next recession. But with an output gap probably in excess of 5 percent, perhaps the focus should continue to be on the battle that has not yet been won rather than on the next battle which is likely to take an unexpected form.
References:
Blanchard, Olivier, and Danny Quah, 1989. “The Dynamic Effects of Demand and Supply Disturbances,” American Economic Review 79(4): 655-673.
Blanchard, Olivier, 2017. “Should One Reject the Natural Rate Hypothesis?” Manuscript.
Cochrane, John, 1994. “Permanent and Transitory Components of GNP and Stock Prices,” Quarterly Journal of Economics, 109(1): 241-265.
Coibion, Olivier, Yuriy Gorodnichenko, and Mauricio Ulate. 2017. “The Cyclical Sensitivity in Estimates of Potential Output,” NBER WP 23580.
Friedman, Milton. 1968. “The Role of Monetary Policy,” American Economic Review 57(1): 1-17.
Gali, Jordi, 1999. “Technology, Employment, and the Business Cycle: Do Technology Shocks Explain Aggregate Fluctuations?” American Economic Review 89(1): 249-271.
World Bank, 2018. “Global Economic Prospects: Broad Based Upturn but for How Long?” January 2018.
Appendix Figure 1: Comparison of IMF and OECD estimates (nowcast) for potential output growth rate
Appendix Figure 2: Comparison of estimates of potential output growth rate for USA.
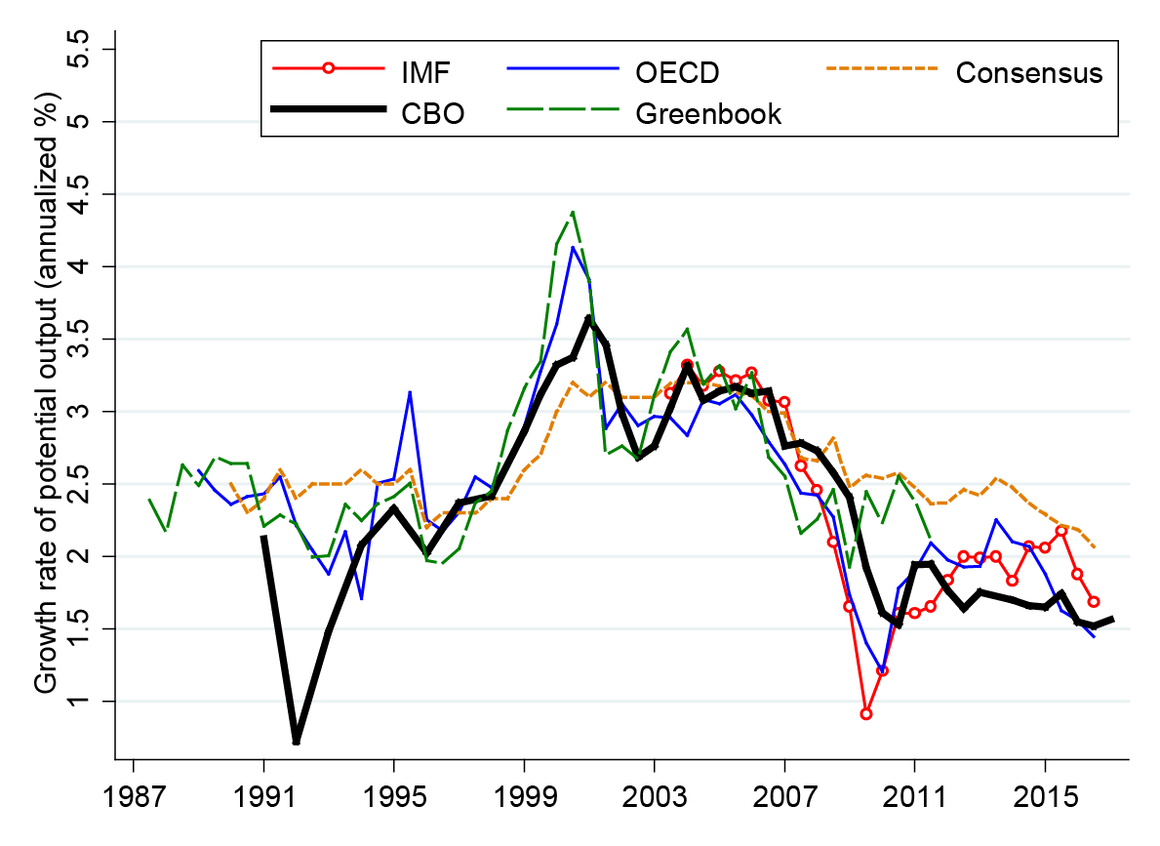
Notes: All series in the figure are based on real-time data. All series are at the semi-annual frequency. The potential output for IMF, OECD, and CBO is reported for the current calendar year. Potential output for Greenbooks is the semiannual average of quarterly growth rates of potential output for the quarters in a given semester. Series for Consensus Economics show the 6-10-year-ahead forecast for actual output growth rate (per year).
End Notes
[1] https://www.federalreserve.gov/newsevents/pressreleases/monetary20171213a.htm. In a September 26th, 2017 speech, Janet Yellen similarly argued that “the data we have in hand as suggesting a generally healthy labor market, not one in which substantial slack remains or one that is overheated.” (https://www.federalreserve.gov/newsevents/speech/yellen20170926a.htm).
[2] https://www.federalreserve.gov/newsevents/testimony/yellen20171129a.htm
More from the Authors
