Fiction and Fact: A Response to the Tax Foundation’s Distortion of Colorado’s TABOR
Colorado’s Taxpayer Bill of Rights, or TABOR, is a constitutional amendment passed in 1992 that places strict revenue and spending limits on state and local government. The evidence strongly suggests that TABOR has contributed to eroding public services in Colorado. Nevertheless, proponents of spreading Colorado’s TABOR to other states argue that TABOR has been a “success.”
A recent paper by the Tax Foundation argues both that Colorado currently has an adequate level of public services and that, to the extent there have been declines in services, that those declines are not related to TABOR. [1] The Tax Foundation charges that critics of TABOR — including the Center on Budget and Policy Priorities — use selective statistics to create a misleading attack on TABOR and its effect on Colorado. In fact, it is the Tax Foundation that is viewing Colorado through selective rose-colored glasses. [2] Each section below begins with a claim from the Tax Foundation about TABOR and is followed by a factual response.
TABOR, Colorado Budget, and Service Deficits
Claim: TABOR saved Colorado from a painful adjustment during the recent fiscal crisis because it smoothed Colorado’s spending over the business cycle by limiting state revenue in the 1990s.
The Tax Foundation claims that because TABOR required the state to return “surplus” revenue, “the revenue decline in Colorado did not hurt as much [as in other states] because the state was not allowed to spend all the money it collected during the good times.” [3] To support this contention, the Tax Foundation shows a figure that depicts the “revenue deficit” with and without TABOR in fiscal year 2002. According to the Tax Foundation logic, while actual TABOR revenues (revenues counted for purpose of the TABOR limit) fell from $8.88 billion in fiscal year 2001 to $7.75 billion in fiscal year 2002 — a difference of $1.125 billion — revenue that the state could keep only fell by $196 million because TABOR limited what the state kept in 2001 to $7.95 billion.[4]
The Tax Foundation’s “analysis” suggests that Colorado’s fiscal crisis consisted of only a $196 million shortfall in fiscal year 2002. In fact, Colorado’s fiscal crisis has been one of the most severe in the country. From fiscal year 2001 to fiscal year 2002, general fund revenues fell by 15 percent in Colorado. Due to the structure of TABOR, however, Colorado was forced to pay out $927 million in refunds from the TABOR surplus in fiscal year 2001. Revenues fell again from fiscal year 2002 to fiscal year 2003, but the budget drivers in Colorado — health care costs, people losing jobs and income and needing state services, higher education enrollment, public safety needs — kept rising at a normal rate. In January 2003, the National Conference of State Legislatures noted that Colorado’s budget shortfall had reached $802 million, or 13.2 percent of the state’s general fund — the second highest proportion in the nation. Thus, far from sparing Colorado from the fiscal crisis, TABOR forced refunds at a time of falling revenues and required legislators to cut funding in a time of rising need. Indeed, Colorado policymakers cut nearly $1 billion in general fund appropriations to balance budgets from fiscal year 2002 through fiscal year 2005. [5]
The notion that TABOR created a smaller “revenue deficit” is an inaccurate description of what actually occurred in Colorado and is misleading in its implications, namely that Colorado citizens were spared the pain of the fiscal crisis because of TABOR. The idea of TABOR reducing the “revenue deficit” in Colorado is the equivalent of saying a worker who has taken years of wage concessions to stay in her job is much better off when her job finally disappears because the difference between her most recent salary and no income is much smaller than between her salary in previous years and no income. This sort of logic ignores the numerous likely sacrifices that the worker had to make during the years of wage concessions — selling a home, selling a car, going without health care, not investing in further education, foregoing savings and contributions to her retirement account.
Colorado paid for its reduced “revenue deficit” in 2002 by creating a spending deficit in the 1990s. The drop in revenue in any one year does not reflect the cuts made in prior years to “afford” the lower base from which revenues dropped in 2001. To believe that TABOR eased the pain of the revenue shortfall, one has to accept, as the Tax Foundation does, that Colorado was funding its public services adequately by the time revenues fell in 2001-02. In fact, because of the arbitrary population plus inflation revenue limit, Colorado had been steadily cutting back state investment in the 1990s, while refunding billions of dollars to Coloradoans (see box “Why a Population Plus Inflation Growth Formula Cannot Provide a Constant Level of Public Services”).
-
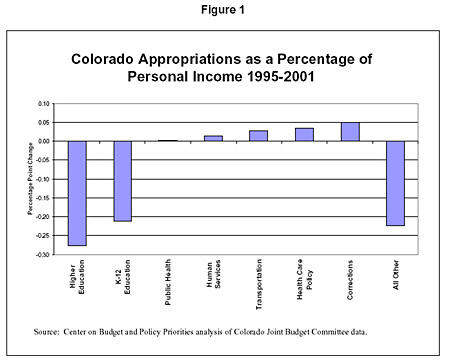
Colorado consistently underfunded major program areas in the 1990s (See Figure 1). [6] As a percentage of total state personal income, total own-source appropriations for the departments of higher education and K-12 education areas fell from fiscal year 1995 to fiscal year 2001. Spending as a percentage of personal income was flat in public health and rose modestly in human services, health care, corrections, and transportation.[7] In “all other” budget areas (combination of 15 areas), spending as a percentage of income fell. These funding cuts occurred during a time in which $3.25 billion was rebated to taxpayers and prior to the recession.
-
By not creating a real rainy day fund in the 1990s with a portion of the $3.25 billion in “surplus revenues,” Colorado policymakers were forced to cut nearly $1 billion in General Fund expenditures from fiscal year 2002 to fiscal year 2005. Some of the rebated revenues from the 1990s might have been used to avoid the deep spending cuts when revenues dropped sharply in fiscal year 2002. (Other states entered the downturn with combined rainy day and reserve funds of $49 billion, which helped cushion required budget cuts.) [8]
-
K-12 education spending per pupil in Colorado fell by more than $300 from 1992 to 2000. This underfunding of K-12 education helped fund tax rebates in the 1990s but also led voters to put another formula into the constitution — Amendment 23 — to ensure that education funding would not continue to lose ground. Amendment 23 has increased K-12 funding (Figure 2) but it has not solved Colorado’s overall budget problems. Instead, the constitutional protection for a large part of the budget has squeezed other parts of the budget harder since the guaranteed growth in K-12 funding must be absorbed by greater cuts in unprotected parts of the budget.
Claim: Colorado has several reserve funds for use in revenue shortfalls and TABOR did not stop the state from saving in a rainy day fund.
Colorado does not have several reserve funds and TABOR’s mandated refunds did prevent the state from saving adequately. The Tax Foundation argues that Colorado has “several” reserve funds that can be used to fill revenue shortfalls. They point to the statutory reserve fund of 4 percent of General Fund fiscal year appropriations and the mechanism of voter approval to keep surpluses. They also mention the existence of an emergency reserve fund but note that it can be used only in cases of natural disasters, not revenue shortfalls. Notwithstanding the definition of “several,” it is not accurate to characterize the existing statutory reserve fund in Colorado as a budget stabilization fund that could have filled the revenue shortfall. Simply, the structure of Colorado’s reserve funds is not designed to provide sufficient cushion during a revenue downturn.
Why a Population plus Inflation Growth Formula Cannot Provide a Constant Level of Public Services
There are several reasons why states cannot provide a constant level of public services under a population-plus-inflation formula.
- No existing measure of inflation — neither the Consumer Price Index nor the GDP deflator nor any other measure — correctly captures the growth in the cost of the kinds of services purchased in the public sector. State governments, for instance, are major purchasers of health care, the costs of which are rising far faster than the general rate of inflation.
- In most states, a rising share of the state population is utilizing public services. For instance, the number of senior citizens in most states is rising faster than the general population, putting new burdens on programs such as Medicaid.
- States often face the burden of providing new or expanded services for reasons outside the control of lawmakers. These include court mandates to increase school funding or other services, response to natural disasters or public health emergencies, major economic shifts such as plant closings, or other reasons.
- In an era of large federal deficits, states are increasingly expected to finance a substantial share of new domestic priorities. Some of these expectations take the form of formal mandates, such as the additional education expenditures required under the No Child Left Behind law. Others may reflect what one analyst has called “underfunded expectations,” such as the expectation that states and local governments will provide heightened levels of security as part of the war on terrorism.
- New public priorities may require new funding from states above and beyond levels of inflation. Recent state initiatives in areas such as K-12 class size reduction, prescription drug coverage for seniors, college scholarships for students with high levels of academic achievement, and other initiatives generally cannot be accommodated under the population-growth-plus-inflation formula.
It is important to note that all state programs — not just those with cost pressures exceeding the population-growth-plus-inflation level — are threatened by a rigid population-growth-plus-inflation limit. This is because such limits typically cover nearly all areas of state and local spending. So, if one spending area is forced to grow faster than the rate allowed under the limit (for instance due to court order, federal mandate or popular demand), then another spending area must grow at a slower pace — which is to say that in terms of the level of service provided, that second spending area must actually shrink.
- TABOR requires Colorado to establish an emergency reserve fund equal to at least 3 percent of state fiscal year spending. This fund may only be used for non-fiscal emergencies, such as natural disasters. The state’s emergency reserve cannot be used to offset revenue shortfalls, so it does not function as a rainy day fund. This fund is not relevant in dealing with fiscal shortfalls, despite the Tax Foundation’s suggestion.
- Colorado statutes require the state to set aside 4 percent of General Fund fiscal year appropriations into reserve specifically for revenue shortfalls in the state’s General Fund. This reserve fund must be replenished each year to the 4 percent level. This can be a problem when fiscal stress lasts a number of years in a row, as it has in the recent downturn. Policymakers can change the reserve requirement, however, in times of fiscal stress. In fiscal year 2002 the Colorado General Assembly reduced the required 4 percent reserve to 0 percent of General Fund appropriations. Similarly, in fiscal year 2003 the General Assembly reduced the required reserve funds to $131 million, or about 2 percent of appropriations.
- TABOR provides a strong disincentive to spending reserve funds. Unlike the rainy day funds of the vast majority of states, the Colorado reserve fund must be replenished every year. The annual replenishment requirement counts as fiscal year spending and thus is subject to Colorado’s spending limit. Because TABOR counts savings as spending, it would have been difficult, if not impossible, for Colorado to establish an adequate rainy day fund in the 1990s. If Colorado had established a real rainy day fund when TABOR was enacted, the state could have avoided the more than $1 billion in cuts during the fiscal crisis of 2002 and 2003.
TABOR and Health Outcomes
Claim: Health indicators other than access to prenatal care indicate that Colorado is a healthy state — Colorado ranks as the 13th healthiest state in the country — and “nothing indicates that TABOR caused the low ranking on prenatal care, or that a low ranking means that Colorado is failing to provide adequate prenatal care.”
State budget policies can and do affect government health policies and Colorado ranks poorly in these dimensions — access to prenatal care and health care expenditures. The Tax Foundation argues that because the United Health Foundation only identified “low access to adequate prenatal care” as a health challenge in the state and ranked Colorado as the 13th healthiest state in the country, Colorado is a healthy state. [9] While the Tax Foundation may not consider limited access to prenatal care a problem, a low ranking on the United Health Foundation’s measure means exactly that Colorado is failing to provide access to adequate prenatal care. Furthermore, the Tax Foundation misses the critical point that in areas where public policy can help the most in improving health, Colorado is failing.
Most of the measures in the United Health Foundation’s rankings are related to broad demographic and behavioral traits rather than access to health care. Colorado’s ranking as “13th healthiest state” has more to do with the state’s age profile than with access to health care. For example, Colorado has the 4th highest percentage of population age 15 to 44 years and the 4th lowest elderly population in the nation. Therefore pointing to Colorado’s better rankings on health outcomes such as prevalence of smoking, obesity, and limited activity days, as the Tax Foundation does, is largely irrelevant to the question of how budget policy affects access to health care and other outcomes.
Colorado legislators made policy decisions that directly decreased access to adequate prenatal care for low-income women. Colorado legislators did implement the Prenatal Plus Program in 1996 in an effort to increase access to prenatal care for low-income Colorado women. Despite significant participation by local clinics, financial pressures forced several local sites to close during the period from 1999 through the present. [10]
-
As the Colorado Department of Public Health concluded in its 2003 Annual Report, “[P]rogram enrollment remains at a relatively low percentage of those who qualify statewide due to the costs to local agencies of providing Prenatal Plus services, costs that exceed the current reimbursement rates. Agencies are reluctant to increase caseloads because of this burden.”
-
In 1999 three local sites — Otero County Health Department, Northeast Colorado Health Department, and Bent County Nursing Service — suspended services because of insufficient program funding.
-
Following significant cuts to local health departments in 2001 and 2002, six additional local sites discontinued Prenatal Plus services — Alamosa County Nursing Services, Conejos County Nursing Services, Delta County Health Department, Denver Health and Hospitals, Mesa County Health Department, and St. Mary’s Family Practice Residency Program in Grand Junction.
-
As a result of large state budget shortfalls in 2002, reimbursement rates to local Prenatal Plus providers did not increase in 2002 or 2003. This flat funding forced local clinics to absorb inflationary costs in providing prenatal services, thus putting further strain on local clinics’ ability to provide access for low-income women.
-
Reflecting the funding difficulties of local clinics, Colorado’s ranking on access to adequate prenatal care dropped from 23rd in 1990 to 48th in 2004.
Claim: Colorado overall compares favorably to other states in Medicaid enrollment and payment per enrollee.
The Tax Foundation selectively chose a time period to fit its preferred outcome, namely that Colorado compares favorably on Medicaid enrollment. In its analysis, the Tax Foundation found that from 1996 to 2001, Colorado had the second-fastest increase in Medicaid beneficiaries of the Rocky Mountain states and a much larger increase than the national average. Considered more broadly, Colorado’s Medicaid program does not compare favorably.
- Over the broader period of 1993 to 2002, Colorado’s growth in total Medicaid enrollment was 35th in the country.
- The state’s average annual Medicaid enrollment growth of 2.4 percent was well below the national average of 3.2 percent, despite the fact that Colorado’s poverty population (percentage of population in poverty) stayed the same while the national average poverty population fell. [11]
- Colorado’s Medicaid program is among the least generous in the nation. In 2004, Medicaid expenditures per state resident for Colorado’s Medicaid program were fourth lowest in the nation.[12]
Claim: The rise in the percentage of uninsured low-income children has nothing to do with tax and spending limits in TABOR.
The Tax Foundation’s “evidence” refuting any relationship between TABOR and rising uninsurance rates for low-income children is based on a misreading of national studies. The Tax Foundation claims that studies from the Centers for Medicare and Medicaid Services (CMS) and the Kaiser Commission conclude that the rise in uninsurance rates for low-income Colorado children has nothing to do with TABOR. In fact, neither report analyzes the drop in insurance coverage for low-income Colorado children, but instead are overviews of national trends in Medicaid. Therefore it is false to say that CMS and Kaiser have concluded anything about the relationship between changes in Colorado’s uninsurance rate and TABOR. The CMS report to which the Tax Foundation refers is a summary comment on SCHIP that notes the increase in uninsured children in the nation, from 13.1 percent in 1988 to 15.4 percent in 1998, is “mostly the result of fewer children being covered by employer-sponsored health insurance.” There is nothing specific to Colorado in this report.
More importantly, the Tax Foundation misses the point that the CBPP analysis made.
- Specifically, as documented in our previous paper, the percentage of low-income uninsured children in Colorado rose from 15 percent in 1991-92 to 27 percent in 2002-2003. During the same period, the national proportion of low-income children lacking health insurance fell from 21 percent to 19 percent. In other states, the growth in SCHIP coverage offset the decline in employer-based coverage. [13]
- Colorado’s percentage increase in uninsured low-income children was larger than any other state during this period and it is clear that Colorado’s policy actions have contributed to uninsurance among children. Budget problems stemming from TABOR led to decreased outreach efforts for Colorado’s Child Health Program (CHP+) and a freeze in CHP+ enrollment in 2003. The Tax Foundation unwittingly supports the link between TABOR and rising uninsurance for low-income children by pointing to one finding in the Kaiser Commission study of national trends in Medicaid — many children go without insurance because their parents are unaware of Medicaid eligibility. This is indeed what happened in Colorado; in the annual report to CMS on CHP+, the Colorado Department of Health Care Policy and Financing documented that all marketing activities for the state’s CHP+ program were stopped due the budget problems in Colorado.[14]
TABOR and K-12 Education
Claim: Colorado teachers are not underpaid by any reasonable standard.
By most reasonable standards, Colorado teachers are underpaid. While many factors affect the decision to enter or remain in public school teaching, low pay relative to the private sector does not work in Colorado’s favor in attracting and retaining good teachers. The Tax Foundation points to Colorado’s ranking of 22nd in 2003 in average teacher salary as evidence that teachers are paid adequately. Picking one year tells us little about teacher compensation versus other states and nothing about the trends in Colorado. Colorado is a relatively rich state, with the 11 th highest average annual wage of all 50 states, and thus would be expected to have higher than average teacher salaries. It is against the backdrop of the state’s relative wealth and high wage levels that pay should be judged, since schools must compete to attract and retain teachers in a competitive market where they may have alternative job prospects.
- Colorado’s per capita personal income was 7th highest in the nation in 2004 but average teacher salaries were below average on most measures.
- Despite having a per capita personal income 13 percent higher than the national average, Colorado’s average teacher salary is 4 percent below the national average teacher salary.
- The ratio of average teacher salary to per capita personal income in Colorado fell from 1.64 in 1991-92 to 1.21 in 2002-03, lowering Colorado’s ranking on this measure from 32nd to 49th. [15]
- The pay ratio of average teacher salaries to private sector earnings in Colorado was 1.07 in 2001-02, ranking it 50th in the nation — a fall from 30th highest in 1991-92.[16]
Claim: Colorado is an average state in terms of K-12 education spending.
By any reasonable measure Colorado is below average in public K-12 education funding. However, because of Colorado’s relatively low level of support for K-12 funding, voters in 2000 approved Amendment 23, which mandates state increases in K-12 funding above inflation. In concluding that Colorado spends an average amount on K-12 education in 2002, the Tax Foundation conveniently ignores the effect that TABOR had on education funding in the 1990s.
To support its claim that Colorado is an average state on K-12 education spending, the Tax Foundation notes that Colorado’s average rank is 27 in all 19 state ranking tables that the National Education Association (NEA) produced for school years 2000, 2001, 2002, or 2003. [17] To create this misleading statistic, the Tax Foundation lumps together rankings on education spending for higher education, K-12, and all education to conclude that Colorado is an “average” state in K-12 expenditures. Moreover, the selected rankings cited by the Tax Foundation largely related to capital spending for school, which is a different issue than operating spending.
By aggregating 19 different measures of education expenditure, the Tax Foundation ignores the history of K-12 education spending in Colorado, which led to the passage of Amendment 23 in 2000. The relevant indicators for Colorado’s investment in public K-12 education show that the state is not average in spending and has only recently begun to make up for years of relative underfunding.
- In 2000-01, Colorado ranked 49th in current expenditures per $1,000 of personal income for public K-12 schools. [18]
- Colorado’s per pupil spending has declined over time relative to the national average, despite above average personal income growth. From 1990 through 2001, Colorado’s per capita personal income increased from the national average to 13 percent above average. During the same period, current K-12 expenditure per pupil declined from 95 percent of the national average to 90 percent. Thus, as the state’s capacity to fund education increased relative the national average, the state’s commitment to education funding decreased.
- Colorado’s 7th place ranking on per capita state and local capital spending for K-12 does not support the Tax Foundation’s contention that Colorado spends adequately on K-12 education. Dividing any measure of education spending by total population is not a good indicator of funding spent on the target population — enrolled pupils. A per capita measure of education spending may understate or overstate the actual per pupil spending depending on the demographics of the state’s population. More importantly, K-12 capital spending is not a good measure of the state’s commitment to providing an adequate education. Finally, depending on the structure and reporting of capital spending, the actual level in any given year might bear little relationship to a state’s long-term capital investment in educational facilities.
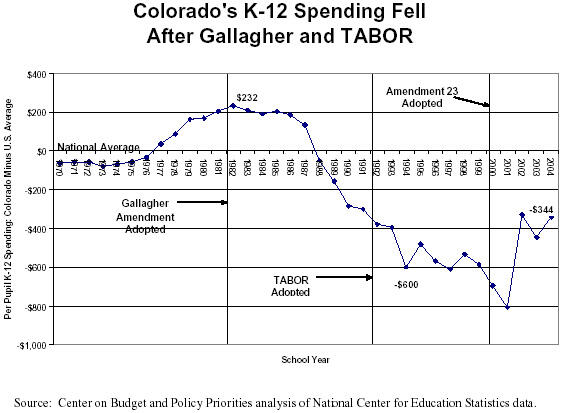
Figure 2 shows the history of per pupil expenditures on K-12 education in Colorado compared to the national average from 1970 through 2004. This table makes clear that Colorado’s K-12 education spending was close to or above average in the 1970s but dropped sharply after the Gallagher Amendment, which limited property taxes, passed in 1982 and again after TABOR passed in 1992.
- From 1970 to 1987, Colorado’s per pupil K-12 education expenditure was slightly below or above the national average, reaching a high point in 1982.
- From 1987 through 2001, expenditure per pupil declined nearly steadily from $132 above the national average to a low of $809 below the national average in 2001.
-
From 2001 though 2004, largely because of Amendment 23, K-12 education expenditure has regained ground relative to the national average and is now near its 1992 level relative to the national average.
The passage of Amendment 23 and the subsequent upturn in per pupil education expenditures does not mean that Colorado has created a sustainable structure in education funding. Amendment 23 provides some protection for K-12 funding from fiscal year 2002 through fiscal year 2011 by guaranteeing funding increases of at least inflation plus one percentage point per year. However, this provision will only allow catch up for years of relative decline in per pupil funding but will not result in a long-term mechanism for adequate school funding in Colorado.
TABOR and Higher Education
Claim: Colorado’s low ranking on state funds for higher education does not indicate that Colorado has a poor higher education system and it is misleading to suggest that the state’s low share of higher education funding has anything to do with TABOR. Colorado residents pay $1,200 less in tuition than residents of other states at comparable institutions.
The Tax Foundation’s assertion that TABOR is not connected to declining state funding for higher education in Colorado indicates a profound lack of understanding of how TABOR affects Colorado budgeting. Higher education in Colorado is the poster child for the problems of TABOR. For budget areas that do not have a constitutional mandate (K-12 education), are not accompanied by a potential loss of federal funds (Medicaid), or are not connected to other statutes guaranteeing funding (criminal codes that require adjudication and incarceration), Colorado legislators have more freedom to cut spending to fit under TABOR limits.
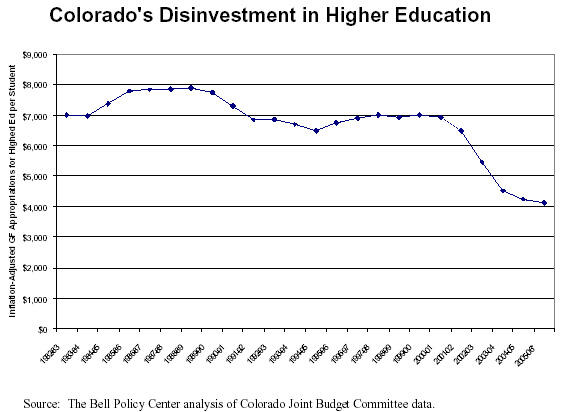
Higher education has taken a significant funding hit under TABOR and will continue to do so under TABOR. As the graph below shows, inflation-adjusted General Fund appropriations per student in Colorado was lower in 2002-03 than at any other time in the previous 20 years. [19]
- State general fund appropriations for higher education have declined from 19 percent of the budget in fiscal year 1992 to 10.6 percent of the budget in fiscal year 2005.
- Colorado ranked 48th in the country in state tax funds for higher education per $1,000 of personal income in fiscal year 2004; it is making the lowest level of state investment in higher education in more than 40 years. [20]
- Adjusted for student enrollment and inflation, Colorado’s General Fund contribution to higher education in 2004-05 was 38 percent below its level in 1991-92.
- During the recent fiscal crisis from fiscal year 2002 through fiscal year 2005, Colorado policymakers cut general fund appropriations for higher education by $177.4 million.[21]
The Tax Foundation’s argument that Colorado tuition is low when compared to institutions in other states turns the TABOR problem on its head. Under TABOR, the state must refund “surplus” revenue through the General Fund even if other funds, including the amount of tuition the university system collects, contribute to the “surplus.” In other words, tuition fees are counted against the TABOR limit in the same way that sales tax or income tax receipts are counted. If tuition increases contribute to the surplus revenue, then there is less money available for General Fund spending in other parts of the budget. Thus, TABOR has made policymakers reluctant to raise tuition and has kept tuition artificially low. This means that the university system is suffering both from inadequate state appropriations and inadequate tuition payments. Now, however, tuition is starting to rise and will likely continue to rise as higher education institutions are being converted to enterprise status, which makes tuition and other cash revenue that higher education institutions use exempt from TABOR limits. [22]
- Average annual state funding per in-state student fell by 35 percent from 2002 to 2005. To compensate for decreased state funding, the University of Colorado at Boulder increased tuition for in-state full-time students by 15 percent in 2004 and Colorado State University increased tuition for in-state students by 9.5 percent in 2004.[23]
- Financial aid is falling at the same time tuition is rising. Colorado policymakers have cut need-based financial aid by 13 percent in the past two years. State need-based aid as a percent of total resident tuition revenue is now at its lowest level in 10 years. [24]
- Starting in fiscal year 2006, Colorado will begin a new funding system for higher education that is unlike any other state. Vouchers and “fee-for-service” contracts will replace the direct appropriations that now exist. The College Opportunity Fund (SB 04-189) will also allow the General Assembly to designate institutions of higher education as enterprises. As noted above, this means that tuition and other cash revenue that higher education institutions use will be exempt from TABOR limits.
TABOR and Political Reality
The havoc caused by TABOR has had real political consequences for Colorado policymakers. Despite claims by the Tax Foundation that TABOR is not to blame for any “perceived inadequacies” in Colorado, developments there indicate a different reality.
- In the November 2004 election, the Republicans lost control of both chambers of the General Assembly for the first time since 1960. Observers generally attribute the loss in part to the inability of the legislature to craft a solution to TABOR.
- Since the November election, the General Assembly has crafted and passed HB 1194, a bipartisan agreement with Governor Owens’ backing, which will allow the state to retain surplus TABOR revenues through 2010. If approved by voters in November, HB 1194 will permit the state to keep an estimated $3.1 billion over the next five years. HB 1194 is a clear indication that Colorado policymakers, prompted by voters in the November 2004 election, recognize the problems that TABOR has inflicted upon the state since 1992 and are seeking funding to redress a portion of those problems.
- In an open letter explaining his support for HB 1194, Governor Owens noted that, “I believe most Coloradoans will object if we do nothing and, in coming years, the state cuts $200 million in higher education, transportation, health care, and other programs while, at the same time, provide taxpayer refunds under TABOR. Most Coloradoans would, I believe, be willing to forego refunds to meet these important needs.” [25]
Acknowledgement: We are grateful for the assistance of Robin Baker and Spiros Protopsaltis of the Bell Policy Center.
End Notes
[1] Chris Atkins, An Analysis of Misleading Attacks on Colorado’s Taxpayer Bill of Rights, Tax Foundation, March 24, 2005.
[2] TABOR’s impacts on Colorado are complicated because TABOR itself contains multiple provisions and because it interacts with several other provisions in the state constitution. The interaction between TABOR, the Gallagher Amendment (residential property tax restriction), and Amendment 23 (more recently enacted education guarantee) makes sorting out causality difficult. See Colorado Legislative Council, House Joint Resolution 03-1033 Study: TABOR, Amendment 23, the Gallagher Amendment, and Other Fiscal Issues, September 2003 for a discussion of the complex interacting provisions. Despite these complications, one can reasonably look at the provision of various types of public services before and after TABOR was enacted, and infer that TABOR had a role in bringing about the decline. In many cases. it is clear that the legislature took specific actions to reduce a service because TABOR required budget cuts to be made.
[3] Chris Atkins, An Analysis of Misleading Attacks on Colorado’s Taxpayer Bill of Rights, Tax Foundation, March 24, 2005, p. 1.
[4] The term “TABOR revenues” refers to the revenue sources to which TABOR applies. Revenues subject to the TABOR growth limit are primarily comprised of General Fund revenues and certain cash revenues. Federal funds and exempt cash revenues are not under the TABOR limit.
[5] John Ziegler, Update on Summary of Actions Taken to Balance Prior Year Budgets, Colorado Joint Budget Committee, November 9, 2004.
[6] All spending areas exclude federal funds. To maintain a consistent comparison over time, the starting point for Figure 1 is 1995. Because of budget restructuring, particularly in the large areas of “health care policy and financing” and “human services,” it is not possible to compare changes in these areas prior to 1995. Starting in fiscal year 1995, rather than in fiscal year 1992 prior to TABOR, does not affect the substantive conclusion.
[7] Transportation spending was adjusted to exclude “spending authority” for Transportation Revenue Anticipation Notes (TRANS). Voters approved the sale of TRANS in 1999 to fund about $1.5 billion in transportation projects. As this is not an ongoing funding source, it is not included in the estimates of baseline appropriations changes in Figure 1.
[8] Robert Zahradnik, Rainy Day Funds: Opportunities for Reform, Center on Budget and Policy Priorities, March 2005.
[9] United Health Foundation, America’s Health: State Health Rankings, 2004 Edition, p. 38.
[10] Information on program participation from annual reports of the Prenatal Plus Program Annual Report, Colorado Department of Public Health and Environment.
[11] Center on Budget and Policy Priorities analysis of Centers for Medicare and Medicaid Services (CMS) data.
[12] Center on Budget and Policy Priorities analysis of Centers for Medicare and Medicaid Services (CMS) and U.S. Bureau of the Census Current Population Survey (CPS) data.
[13] Leighton Ku, Matt Broaddus, and Victoria Wachino, Medicaid and SCHIP Protected Insurance Coverage for Millions of Low-Income Americans, Center on Budget and Policy Priorities, January 2005.
[14] SCHIP Annual Report, 2003, State of Colorado, http://www.cms.hhs.gov/schip/annual-reports/2003/charco03.pdf
[15] National Education Association, Digest of Education Statistics, various years and CBPP calculations of Bureau of Economic Analysis data.
[16] National Education Association, Digest of Education Statistics, various years and CBPP calculations of Bureau of Labor Statistics data.
[17] More accurately, the NEA tables are comprised of rankings on 15 school expenditure measures, not 19. Four of the measures have rankings for two years. The NEA tables cover state government expenditures on all education, state and local government expenditure on all education, state and local expenditures on higher education, state and local expenditures for K-12 education, and capital spending for higher education and K-12. Each of these indicators is divided on a base of either per capita, fall enrollment, average daily enrollment, percentage of national average, or percentage of personal income. To highlight its case for Colorado’s adequate education spending, the Tax Foundation cites Colorado’s 6th place ranking on per capita state and local capital spending for higher education and its 7th place ranking on per capita state and local capital spending for K-12.
[18] CBPP calculations of NationalCenter for Education Statistics data.
[19] Spending is expressed as General Fund appropriations for the Department of Higher Education in 2003 dollars per resident student full-time equivalent. Source: The BellPolicyCenter, based on Colorado budget data.
[20] The Bell Policy Center, TABOR Issue Brief: Higher Education. Online at http://www.thebell.org
[21] Colorado Joint Budget Committee, Memorandum, “Update on Summary of Actions Taken to Balance Prior Year Budgets,” November 9, 2004.
[22] The General Assembly must designate a particular program area as an “enterprise.” Once a functional area attains enterprise status, it must receive no more than 10 percent of its annual revenue from government sources and must be able to support itself financially. The revenue an enterprise generates does not count against the TABOR limit. In the case of higher education this means that tuition increases would no longer be bound by the overall TABOR cap.
[23] The Bell Policy Center, TABOR Issue Brief: Higher Education. Online at http://www.thebell.org
[24] The Bell Policy Center, TABOR Issue Brief: Higher Education. Online at http://www.thebell.org
[25] Governor Owens' letter to Coloradans regarding the budget solution : http://www.colorado.gov/governor/tabor.html
More from the Authors
