Study Praising Kansas’ Harsh TANF Work Penalties Is Fundamentally Flawed
Over the last six years, Kansas Governor Sam Brownback and Republican lawmakers have imposed harsh new policies making it more difficult for families to qualify for, maintain, and regain cash assistance through the Temporary Assistance for Needy Families (TANF) program — with the stated goal of reducing poverty and helping families. Using data collected by the state, the Foundation for Government Accountability (FGA) released a report in 2017 focusing on families terminated from TANF due to the program's work requirements; it concluded that "work requirements are working for Kansas families."[1] Others have used the FGA report to justify expanding work requirements to other programs. Our analysis of the same state data, however, indicates that the FGA analysis is fundamentally flawed. In addition, as this analysis and our companion report[2] explain, the FGA’s main conclusion that “Kansans thrive after leaving welfare' is false:
The FGA analysis is fundamentally flawed.
- In the year after leaving TANF, 3 in 4 parents terminated because of work sanctions had either no earnings or "deep-poverty earnings" — that is, earnings below 50 percent of the federal poverty line (FPL), or below $10,080 for a family of three in 2016.[3] Only 8 percent had earnings above the poverty line, or $20,160 for a family of three in 2016.
- For the parents exiting TANF due to a work sanction for whom we have four years of post-exit data available, nearly 7 in 10 had either no earnings or deep-poverty earnings in the fourth year after exit; only 17 percent had incomes above the poverty line that year. Their median earnings were just $1,601 (8 percent of the FPL) in the year after exit and $2,175 (11 percent of the FPL) in the fourth year after exit.[4]
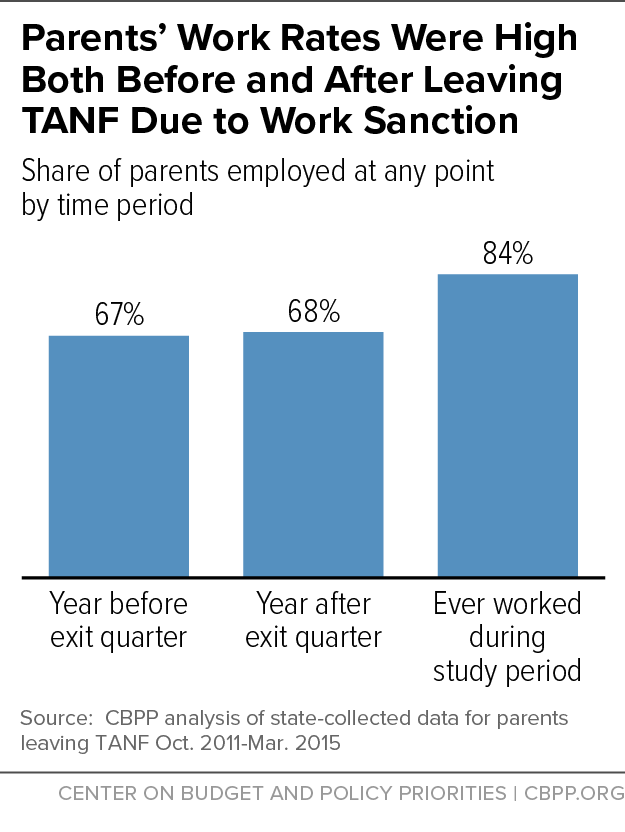
- Work for these parents was common but unsteady. Sixty-seven percent of parents worked in the year before exiting TANF, while 68 percent worked in the year after exit. But in an average quarter after exit, only about half were working, pointing to the unsteadiness of the jobs they hold.
The key flaws in FGA's analysis include:
- The data FGA presents don't support the report's claim that "Kansans thrive after leaving welfare." The FGA report, using data on parents that exited TANF because of a work sanction between October 2011 and March 2015, masks how low parents' earnings are by focusing on a highly exaggerated estimate of total earnings for all parents that exited due to a work sanction, rather than earnings per family. For example, four years after exit, FGA reports that total earnings for all 6,090 parents were $67.6 million, equivalent to $11,100 per family or about 55 percent of the federal poverty line for 2016 (the same year as our inflation-adjusted data).[5] Using the observed earnings data for a subset of parents for whom four years of post-exit data are available, average earnings four years after exit were just $8,427 or 42 percent of the federal poverty line. And, the FGA report fails to show that these parents' median earnings were far lower: just $2,175 or 11 percent of the federal poverty line four years after exit. Average earnings this low — and median earnings even lower — show that families leaving TANF because of a work sanction are not thriving.
- FGA's estimates of parents' earnings gains are substantially higher than those observed in the data. The FGA report claims that parents' incomes more than doubled within a year after exit and more than tripled within four years after exit, but this claim is based on FGA's highly exaggerated estimate of these parents' annual earnings over that period. Because four years of data are available for only a portion of the work-sanctioned parents, FGA indicates that it estimated total earnings by extrapolating from the available data. The FGA report did not sufficiently describe its methodology for us to replicate it, but when we converted FGA's estimates into averages and compared them to the actual average earnings for the subset of parents for whom four years of post-exit data are available, we found that the earnings gains were far smaller than FGA claims (see Table 1). (Shortly after this report was published, FGA provided additional clarity on their methodology, allowing us to replicate their estimates. See the Appendix.)
- Neither the FGA report itself nor other available data support the claim that TANF "can better manage resources for the truly needy" because of the harsh work sanctions and other policy changes. As a basis for its claim that TANF is better equipped to support the truly needy due to freed-up resources from no longer serving work-sanctioned families, the report relies on increases in Kansas' TANF work participation rate. The work participation rate, however, is a flawed measure of what a state does to help families in need and is heavily influenced by whether families with the greatest needs can obtain assistance in the first place. Families' access to cash assistance declined substantially after Kansas enacted its policy changes: for every 100 Kansas families in poverty in 2015-16, only ten received cash assistance from TANF — down from 17 families in 2011-12. Also, the number of adults participating in work activities for the required number of hours declined by almost two-thirds, from an average of 2,581 families per month in fiscal year 2011 to an average of just 931 families in fiscal year 2016.
- There is no basis for the report's claim that work requirements caused earnings to increase. In order to determine the impact of Kansas' policy changes, FGA would have needed to compare the earnings for two groups of recipients: one subject to the policy changes and the other remaining under the old policy. Because all families were immediately subject to the harsher work sanctions, FGA couldn't make such a comparison. At least two factors unrelated to the policy changes could have contributed to earnings increases among families leaving TANF: an improving economy and amelioration of the circumstances that led families to TANF in the first place, such as loss of a job or a serious illness.
In addition, the data contradict the premise underlying Kansas' work sanctions — that it is necessary to punish people by taking away cash assistance for an extended period to get them to work. The vast majority (84 percent) of parents that left TANF because of a work sanction worked at some point during the study period,[6] and parents were about just as likely to work before they left TANF (67 percent) as after (68 percent). In fact, a key consequence of the new policies is that families were less able to obtain basic assistance when they needed it.
Our findings are consistent with other TANF "leavers" studies that show that parents continue to struggle after they leave TANF. Some parents forced to leave TANF do not work after exit, and a large majority of those that do work have earnings insufficient by themselves to lift families out of poverty.
The substantial evidence that work requirements and harsh sanctions harm families living on the edge should serve as a cautionary tale not only to policymakers in other states, but also to President Trump and Republican congressional leaders, who may seek this year to severely cut other economic security programs and make it easier for states to pursue similar harsh policies in those programs, including the Supplemental Nutrition Assistance Program (formerly food stamps), Medicaid, and housing assistance.
Kansas' Revised Work Sanction Policy and Data on Work-Sanctioned Families
In November 2011, Kansas imposed harsh new penalties on parents that failed to comply with TANF work requirements. The new rules disqualify an entire family from TANF for three months the first time the family fails to meet the work requirements and for progressively longer periods for repeated instances of noncompliance. (Under the prior policy, sanctioned families could return to TANF as soon as they came into compliance.) Also, in July 2013, the state made it much easier to sanction families for missing a work program appointment.[7] These changes were part of a larger set of program changes that made it harder for families to receive cash assistance.[8]
In this critique, we analyze the same data FGA used for its analysis: a state-created data set that matches data for parents exiting TANF with earnings data from the state's quarterly unemployment insurance wage records. FGA's analysis and our critique of it focus on the 6,090 parents that exited TANF because of a work sanction between October 2011 and March 2015. Earnings records are available from the fourth quarter of 2011 through the first quarter of 2015. Any earnings in a quarter — no matter how small — indicate that a person was employed in a job that was required to provide quarterly wage data to the state. Because the analysis is limited to data available from quarterly unemployment insurance records, we do not know how many hours parents worked or their hourly wage.
The state data set includes earnings data for all 6,090 household heads (or "parents") in the exit quarter and in the four quarters before and after their exit quarter; for some of those parents — depending on when they exited — it also includes earnings data for two, three and four years after exit. FGA's analysis focuses on parents' earnings four years after exit, so we pay special attention to the 1,074 parents for whom these data exist because they exited in the early part of the study, a group we refer to as the "2012 cohort."
In the full cohort of 6,090 households, most — about 83 percent — were single-parent households. Our unit of analysis in this study is adults in the family, meaning that parents' earnings are combined for multiple-parent households.
| TABLE 1 | ||
|---|---|---|
| Characteristics of Exiting Cases, October 2011 to March 2015 | ||
| Household Size | Count | Percent |
| 1 member | 331 | 5.4% |
| 2 members | 2,496 | 41.0% |
| 3 or more members | 3,263 | 53.6% |
| Average | 2.83 | / |
| Total number of exiting households | 6,090 | / |
| Number of Households by Number of Adults | Count | Percent |
| 1 adult | 5,030 | 82.6% |
| 2 adults | 1,057 | 17.4% |
| 3 adults | 3 | <1.0% |
| Average | 1.17 | / |
| Number of Households in Each Cohort | Count | Percent |
| 2012 Cohort (Q4 2011 to Q1 2012) | 1,074 | 17.6% |
| 2012-2013 Cohort (Q4 2011 to Q1 2013) | 2,514 | 41.3% |
| 2012-2014 Cohort (Q4 2011 to Q1 2014) | 4,395 | 72.2% |
| Full Cohort (Q4 2011 to Q1 2015) | 6,090 | 100% |
TANF Serving Fewer Families in Need
Harsh TANF work sanctions are neither new nor unique to Kansas. In recent years, several states have implemented punitive work requirements despite evidence that these rigid policies exacerbate, rather than reduce, poverty for some of the most vulnerable families.[9]
As a result of these work policies and other punitive policies like shorter time limits, TANF is largely disappearing in a growing number of states; in 15 states (including Kansas), ten or fewer families receive TANF cash benefits for every 100 families in poverty.[10] For every 100 Kansas families in poverty in 2015-16, only ten received cash assistance from TANF — down from 17 families in 2011-12 and 52 families in 1995-96.
FGA's Own Analysis Contradicts Claim That Families "Thrived" After Leaving TANF
The data FGA presents in its report do not support the report's claim that "families thrive(d) after leaving" TANF.[11] FGA's claim is based on estimates of total earnings for the full group of families that left TANF because of a work sanction during the study period. By focusing on total earnings, FGA masks the fact that, even by its own estimates, parents leaving TANF because of a work sanction had earnings far below the poverty line, even four years after leaving the program.
Because the FGA report does not fully explain its methodology, we are not able to reconstruct its analysis, but we can use the report's data to estimate families' average earnings and then compare these figures to the federal poverty line (FPL). (As noted, FGA provided additional clarity on their methodology after we published this report; see the Appendix for details.) The report states that the 6,090 parents exiting TANF due to work sanctions from the fourth quarter of 2011 through the first quarter of 2015 had a total income of $19.5 million in the "baseline period" (presumably the year before exiting TANF), $39.8 million in the first year after exit, $48.0 million in the second year, $52.2 million in the third year, and $67.6 million in the fourth year.
We converted FGA's total earnings figures into average earnings (by dividing them by 6,090 parents) and compared the results to the 2016 FPL for a family of three, the size of the average family exiting TANF because of a work sanction (see Table 2). Under this calculation, the estimate for all parents' annual average earnings in the first year after exit was just $6,535 or 32 percent of the FPL. By the fourth year after exit, even though average earnings increased substantially — to $11,100 — they were still just 55 percent of the FPL.[12] The FGA report claims that adults removed from TANF found employment in 600 different industries, but the earnings data suggest that many of those industries did not provide earnings sufficient to lift families out of poverty and did not provide stable employment.
| TABLE 2 | |||||
|---|---|---|---|---|---|
| Up to Four Years After Exit, Earnings for Vast Majority of Work-Sanctioned Parents in Kansas Were Below Poverty and Deep-Poverty Lines | |||||
| Annual Earnings Data for Parents Exiting TANF Due to Work Sanction, by Cohort and Time | |||||
| Year Before Exit | One Year After Exit | Two Years After Exit | Three Years After Exit | Four Years After Exit | |
| FGA Estimates (Averages calculated by CBPP using FGA’s extrapolated total earnings data) | |||||
| Total earnings (in millions) | $19.5 | $39.8 | $48.0 | $52.2 | $67.6 |
| Annual average earnings | $3,202 | $6,535 | $7,882 | $8,571 | $11,100 |
| Average earnings as a percent of poverty | 16% | 32% | 39% | 43% | 55% |
| % Increase from baseline | 104% | 146% | 168% | 247% | |
| Cohort with four years of data (N=1,074) | |||||
| Annual average earnings | $3,850 | $5,334 | $6,666 | $7,582 | $8,427 |
| Average earnings as a percent of poverty | 19% | 26% | 33% | 38% | 42% |
| % Increase from baseline | 39% | 73% | 97% | 119% | |
| Cohorts with at least three years of data (N=2,514) | |||||
| Annual average earnings | $3,941 | $5,261 | $6,507 | $7,483 | N/A |
| Average earnings as a percent of poverty | 20% | 26% | 32% | 37% | N/A |
| % Increase from baseline | 33% | 65% | 90% | N/A | |
| Cohorts with at least two years of data (N=4,395) | |||||
| Annual average earnings | $4,270 | $5,684 | $7,028 | N/A | N/A |
| Average earnings as a percent of poverty | 21% | 28% | 35% | N/A | N/A |
| % Increase from baseline | 33% | 65% | N/A | N/A | |
| (Cohorts with at least one year of data) (N=6,090) | |||||
| Annual average earnings | $4,607 | $6,028 | N/A | N/A | N/A |
| Average earnings as a percent of poverty | 23% | 30% | N/A | N/A | N/A |
| % Increase from baseline | 31% | N/A | N/A/td> | N/A | |
Moreover, average earnings figures mask how little most of the work-sanctioned parents earned after exiting TANF, with the vast majority having deep-poverty earnings — that is, earnings below 50 percent of the FPL (or below $10,080 for a family of three in 2016). In the year after exit, 3 in 4 parents in the full cohort had either no earnings or earnings below 50 percent of the FPL. This includes the 1,938 parents who never worked in the post-exit year as well as the roughly 2,698 parents who worked at some point in that year. Only about 8 percent of the parents had earnings at or above the FPL.
The 2012 cohort was still doing poorly four years after exit. While the share of parents with earnings above poverty rose to about 17 percent, more than two-thirds still had either no earnings or deep-poverty earnings (see Table 3). Especially troubling, the share of parents with no earnings remained stuck at around 37 percent. The data are similar for the later cohorts, except that the average earnings in the pre-exit year are substantially higher in the later cohorts, possibly because Kansas' economy was improving and because some of the policy changes may have made it harder for those with the least earning potential to receive benefits.
These data do not support FGA's claim that families leaving TANF because of a work sanction were thriving. Earnings this low do not provide sufficient income for families in Kansas to cover their basic needs, including the cost of housing, utilities, and clothing as well as costs for child care and food that exceed what other government programs provide. Further, considerable research suggests that extremely low family income, which does not allow families to meet their basic needs, is likely to have long-term negative consequences for the health and development of Kansas children in these families.[13]
| TABLE 3 | |||
|---|---|---|---|
| Up to Four Years After Exit, Earnings for Vast Majority of Work-Sanctioned Parents in Kansas Were Below Poverty and Deep-Poverty Lines | |||
| Annual Earnings as a Share of 2016 Federal Poverty Line, by Earnings Group and Cohort | |||
| All Work Sanction Exits | 2012 Cohort Work Sanction Exits | ||
| One Year After Exit | One Year After Exit | Four Years After Exit | |
| Earnings Group | Share of All Parents (6,090 Total) | Share of All Parents (1,074 Total) | Share of All Parents (1,074 Total) |
| $0 Earnings | 32% | 36% | 37% |
| Earnings below FPL | 29% | 28% | 20% |
| 25 - 49% FPL | 15% | 16% | 11% |
| 50 - 74% FPL | 10% | 10% | 9% |
| 75 - 99% FPL | 6% | 4% | 6% |
| 100% FPL and Above | 8% | 6% | 17% |
| Total | 100% | 100% | 100% |
FGA Overstates Income Gains Among Families Leaving TANF
The FGA report claims that families' incomes more than doubled within just one year after exit and more than tripled within four years after exit. These figures grossly overstate the earnings increase observed in the data. Actual data for all 6,090 parents are only available for the first year after exit, so FGA estimated the total earnings for the second, third, and fourth years after exit by extrapolating from the subsets of parents for whom data in that year are available. The report doesn't describe the exact calculation involved.[14](See the Appendix for information FGA provided after we published this report.)
After converting FGA's total earnings figures into average earnings and comparing the results to the actual average earnings for the subset of parents for whom four years of actual post-exit data are available, we found that the earnings gains were far smaller than FGA claims. The actual average earnings in the first and fourth year after exit for the 2012 cohort were 39 percent and 119 percent higher, respectively, than in the year prior to exit (see Table 2). These are far smaller increases than the 104 percent and 247 percent increases that FGA claims. We also examined actual post-exit data for earlier years for the cohorts for which data are available and arrived at similar results.
It's not surprising that after leaving TANF, some families found more stability and saw their earnings increase. Families often turn to TANF when a change in their circumstances — such as losing a job, giving birth, getting divorced, fleeing domestic violence, or experiencing a medical issue — places them in a particularly vulnerable situation. These times are often a very low point in their earnings as well. Moreover, Kansas' economy was improving during the study, which likely helped some families increase their earnings. Yet these families remained quite poor and there is no evidence that the sanctions or other policies increased earnings over what they would have been in the absence of these policies, as explained below.
FGA's Employment Measure Masks Sharp Decline in Number of TANF Families Engaged in Work Activities
The FGA report claims that harsher work sanctions made Kansas' TANF program "better equipped to help the truly needy" and, with other policy changes, "led to more employment."[15] However, the data that the report presents (and other available data) do not support these conclusions. FGA uses three different measures to support its claim: the decline in the TANF caseload, the increase in the TANF work participation rate (WPR), and the increase in the employment rate for parents receiving TANF. None of these measures provides evidence to support FGA's claims.
FGA points to the decline in Kansas' TANF caseload as evidence that the Kansas TANF changes "are working." But in reality, it only indicates that fewer families were receiving TANF, not that fewer families needed assistance from TANF. In fact, access to TANF cash assistance declined substantially after Kansas enacted its policy changes: for every 100 Kansas families in poverty in 2015-16, only ten received cash assistance, down from 17 families in 2011-12.[16] In addition, while the state's steep caseload decline of 60 percent from October 2011 to October 2016 freed up TANF funds that Kansas could have devoted to employment programs and to helping the most vulnerable families, there is no evidence that Kansas did so. In fact, Kansas cut spending on employment programs by nearly half, from $13 million in fiscal year 2011 to $7 million in fiscal year 2015 (the latest year for which comparable data are available).[17]
FGA relies on two additional measures, the TANF WPR and the employment rate for adults enrolled in TANF, to further support its claim that Kansas is better equipped to handle the truly needy. Yet neither measure actually supports this claim. The WPR is the ratio of the number of adult TANF cash assistance recipients who are working or in specified work-related activities to the number of families that include adult TANF cash assistance recipients. It doesn't measure what a state does to help families in need and is heavily influenced by whether families with the greatest needs can obtain assistance in the first place. FGA also refers to the employment rate for TANF enrollees, presumably meaning the share of TANF recipients who are meeting their TANF work requirement through paid employment, although the report never provides a definition.
FGA claims that the work participation and employment rates of TANF recipients increased substantially after the harsh policies were put into place. But changes in these two measures simply reflect the fact that fewer non-working families were receiving assistance. The parents who remained as TANF recipients after the policy changes took effect were fewer in number and likely significantly different from those who participated before — because of the policy changes. The state cut off TANF recipients who were not meeting work requirements and who reached the TANF time limit — two groups of families that we know have higher rates of employment barriers than other recipients. As a result, the remaining TANF recipients had better work participation and employment rates, not because the state served them better, but because they likely were better off to begin with and were the only ones still eligible and participating in TANF.
After Kansas' policy changes took effect, the number of families participating in work activities for the number of required hours — such as employment, on-the-job training, and job search — fell by almost two-thirds, from an average of 2,581 families per month in fiscal year 2011 to an average of 931 families in fiscal year 2016.[18] The number of families that met their TANF work requirement through employment also declined substantially, from 2,007 families in fiscal year 2011 to just 872 families in fiscal year 2016. These data show that the Kansas TANF program is helping fewer parents find jobs today than before these changes went into effect.
Furthermore, FGA's claim that Kansas' work participation rate climbed to 36.4 percent while the national rate has dropped to 23.8 percent is not supported by the official work participation data published by the U.S. Department of Health and Human Services. In fiscal year 2011, Kansas' WPR was 27.6 percent, slightly below the national average of 29.5 percent. By fiscal year 2015, Kansas' WPR had increased to 34.5 percent and the national WPR had increased to 48.4 percent. By 2016, the last year for which data are available, Kansas' WPR had risen to 41.9 percent and the national rate had risen to 51.9 percent.
With the data set on earnings available, FGA could have examined the employment experiences of parents subject to the new work sanction policy throughout the study period, including both before and after exit. Doing so shows that work for these families was common but not steady:
- Some 84 percent of these parents worked at some point in the year prior to exit through the year after exit. And attesting to their strong attachment to the labor force, their employment rates at any point in the year were nearly just as high before exiting the program (67 percent) as after exit (68 percent) (see Figure 1). The relatively high employment rates before and after exit from TANF suggests that parents' stays on TANF may have been quite short, with families using the program as it was intended — as a temporary safety net when work is not available or feasible.
- In any given quarter of the post-exit year, just 49 percent of these parents were working, only modestly better than the 44 percent figure in an average quarter the year before exit. This suggests that the barriers to work that many work-sanctioned families face, such as lower education and volatile work schedules, remain after they leave TANF. Yet, these families no longer have access to TANF-funded employment programs that can help them gain a foothold on the economic ladder.
FGA Overstates What Descriptive Studies Can Tell Us
Our study, like FGA's, is a "descriptive" study that allows us to describe employment and earnings trends over time and assess how outcomes differ among various groups of TANF families. The data that we evaluated do not enable us to explain why the documented outcomes occur. The gold standard for testing the effectiveness of an intervention is a randomized control trial, which randomly assigns families to a treatment group that is subject to a new set of policies (such as a shorter time limit or work requirement) and compares their outcomes with those from a control group subject to the previous policies.
For example, evaluating the effectiveness of the harsher work sanctions policy would require a counterfactual — that is, a comparison of the employment and earnings of the families that were subject to the new work sanction policy to an otherwise similar comparison group that is subject to the old work sanction policy. Differences between the two groups then could be attributed only to the policy change. The FGA report ignores these research standards, drawing inappropriate conclusions from data that lack the rigor required to make such claims.
While descriptive studies do not provide evidence of whether Kansas' policy changes boosted employment and earnings — policymakers' purported goal — they can increase our understanding of the economic and work experiences of TANF families and suggest areas for rigorous experimentation aimed at improving such experiences.
Conclusion
Kansas families leaving TANF due to work requirements generally neither thrived nor obtained more opportunity; the vast majority did not find steady work opportunities that positioned them to make ends meet and protect their children from poverty. These findings sharply contradict claims by the state and FGA, whose deeply flawed analysis doesn't accurately reflect the realities that families exiting TANF face.
Appendix: Sharp Methodological Differences Between CBPP and FGA Reports
After this CBPP paper was originally published on January 23, FGA issued a response.[19] This new appendix, using information from that FGA response, provides more detail on why our earnings estimates differ from FGA's — and why FGA's claim that families that left TANF in Kansas because of a work sanction are thriving is not credible.
Like FGA, we analyzed earnings for TANF parents both before and after leaving the program, and we both used the same state dataset,[20] which matches data for those parents with earnings data from the state's quarterly unemployment insurance wage records. The key differences between our analysis and FGA's include:
FGA estimated parents' annual earnings, while we used their actual earnings reported in the dataset, adjusted for inflation. We created an earnings record for each TANF parent by linking the parents' quarterly earnings records — a standard procedure that researchers have used for decades in examining employment and earnings over time — and then calculating parents' annual earnings by summing four consecutive quarters of earnings data. We made two adjustments to the data: we adjusted them for inflation (reporting all earnings in 2016 dollars) and, for two-parent households, we summed both parents' earnings to create one earnings record for the family.
FGA, in contrast, based its analysis on quarterly earnings, which it used to estimate annual earnings by selecting one quarter of data and multiplying it by four. This is problematic because parents' earnings are not equal in every quarter. If the earnings estimate is based on a quarter with especially low earnings, it will be biased downward; if based on a quarter with especially high earnings, it will be biased upward. In the case of TANF recipients, their earnings are likely lowest at the point at which they turn to TANF — when they lose a job, their hours are reduced, or they experience a family crisis such as a health emergency. Events like these, after all, are what lead many families to apply for TANF in the first place. But that temporary situation may not accurately represent their experience over an entire year.
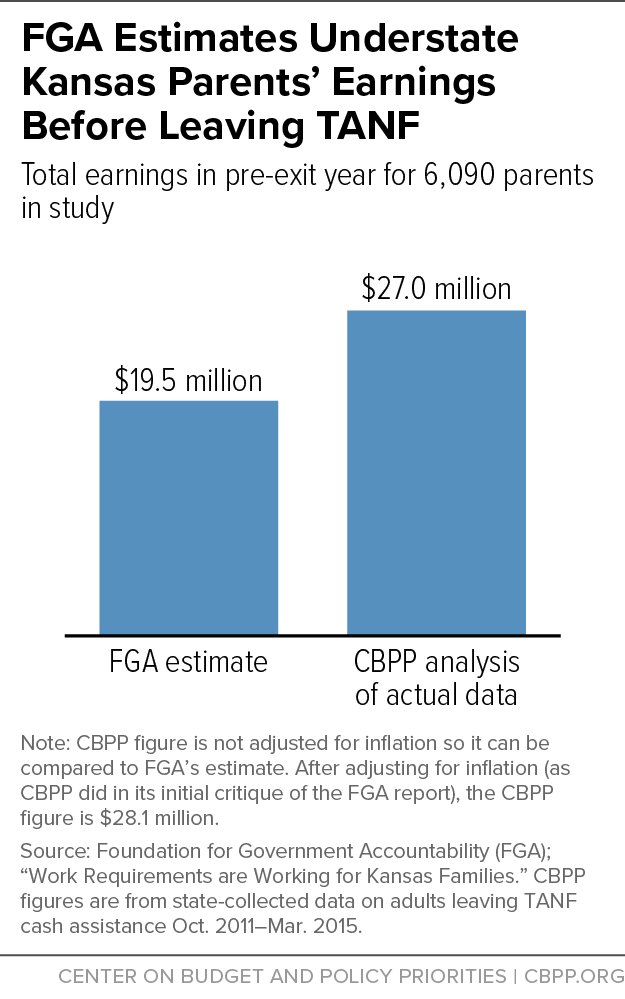
Due to FGA's flawed approach, its estimates of families' baseline earnings (that is, earnings in the year prior to exit) are far below the actual reported earnings for that year, which we used in our analysis. Our baseline represents reported annual earnings for the year prior to the quarter in which the parent exited TANF; while the dataset does not show how much of that prior year parents received TANF, it does show the quarter in which they exited TANF, and the earnings data it presents for the prior year reflect parents' actual experience. FGA, in contrast, constructed its baseline by multiplying the earnings in the quarter immediately prior to exit by four.
Because FGA selected a quarter in which parents had especially low earnings, its baseline is 39 percent lower than ours (see Figure 2) and does not accurately represent parents' actual earnings in the year prior to their exit quarter. This is one of the most serious flaws in the FGA analysis. FGA bases its claim that families thrive after leaving TANF on FGA's figures on how much their earnings increase over the baseline.
FGA estimated earnings over time using a complicated and unconventional methodology, while we report actual earnings for the subset of families with four years of post-exit data. The Kansas dataset provides earnings data for parents exiting TANF between October 2011 and March 2015. For every parent exiting during that period, earnings data are available for the four quarters prior to exit, the exit quarter, and the four quarters after exit. Earnings data are also available for 8, 12, or 16 quarters after the exit quarter for parents exiting during the earlier part of the study period, depending on the year in which they exited.
For our core analysis, we examined earnings for the year before and the year after parents exited TANF, using data for the full sample — that is, all 6,090 parents that exited during the study period. For our four-year analysis, we examined data only for the 1,074 parents for whom four years (16 quarters) of post-exit data are available.
FGA, in contrast, calculated the growth in earnings from the baseline using as much data as was available and then applied that growth rate to the full sample. This is an inappropriate approach, especially when observed data are available, and produces inaccurate results. (See Appendix Table 1 for a replication of FGA's analysis.) For example: to calculate total earnings in the fourth year after exit, FGA calculated the percentage growth in earnings from the baseline quarter through the last quarter of the fourth year for the cohort of parents for whom four years of post-exit data are available. FGA then applied that growth-rate percentage to the full sample's total earnings in the baseline quarter and multiplied the result by four to produce an annual earnings figure. To calculate total earnings in the third year after exit, FGA calculated the growth rate using data for the cohorts with at least three years of post-exit data; and so on.
Not only did FGA use a flawed methodology to calculate annual earnings, but because FGA calculated the growth rate based on its estimated baseline, which understates families' actual incomes, FGA's earnings growth figures are grossly exaggerated. For example, we estimate — based on parents' actual earnings for the year prior to exit — that earnings for the cohort with four years of post-exit data grew by 119 percent between the pre-exit year and the fourth year after exit. FGA's inflated estimate is 247 percent.
We followed the standard convention for studies like this of reporting average and/or median earnings and earnings distributions, while FGA presented only total annual earnings for all exiting parents. Following the convention for analyses of program participants' employment and earnings, we presented data representing the circumstances of the average or median parent and the distribution of employment or earnings for all parents included in the analysis. FGA focused only on earnings (omitting employment for these parents) and presented data on the estimated sum of earnings for all 6,090 parents exiting TANF.
FGA's total earnings figures — $19.5 million in the baseline year and $39.8, $48.0, $52.2, and $67.6 million for years one through four, respectively — are based on its estimated baseline earnings and extrapolated earnings over time as presented in Appendix Table 1. The problem with presenting total annual earnings for all parents exiting TANF is that there is no reference point to assess whether the earnings are sufficient to enable families to make ends meet.
To put FGA's total earnings into a more meaningful context, we divided total earnings for each post-exit year by the number of parents that exited TANF due to a work sanction (6,090) to obtain average earnings. This calculation shows that, even by FGA's own estimates, the average family leaving TANF in Kansas had very low earnings: just 32, 39, 43, and 55 percent of the poverty line for a family of three in years one through four after exit, respectively. If the FGA report had presented average earnings, those figures would not have supported FGA's claim that families thrived after leaving TANF because of a work sanction.
Moreover, average earnings based on the actual data were even lower than those derived from FGA's total earnings estimates. For the full group of parents exiting due to a work sanction, average earnings were just $6,028, or 30 percent of the federal poverty line in the year after exit; for the parents for whom four years of data is available, average earnings in the fourth year after exit were just $8,427, or 42 percent of poverty.[21] In other words, parents' average earnings rose over time, but not by enough for families to meet all their basic needs.
FGA's claims that Kansas' policies caused earnings to increase ignores the limits of what we can learn from descriptive studies. The data that both we and FGA evaluated are descriptive: they provide information on the employment and earnings of parents exiting TANF in Kansas over an extended period but do not enable researchers to explain why the documented outcomes occur. Thus, our analysis describes the circumstances of parents that left TANF, including comparing their earnings before and after exiting, but we do not make any claims about the role that Kansas' policy changes might have had on those outcomes. FGA, in contrast, explicitly attributes changes in parents' circumstances to Kansas' policy changes.
The gold standard for testing the effectiveness of an intervention is a randomized control trial, which randomly assigns families to a treatment group that is subject to a new set of policies (such as a shorter time limit or work requirement) and compares their outcomes with those from a control group subject to the previous policies. The FGA report ignores these research standards, drawing inappropriate conclusions from data that lack the rigor required to make them. Descriptive studies are useful, however, in increasing our understanding TANF families' work experiences and suggesting areas for rigorous experimentation aimed at improving outcomes.
| Appendix TABLE 1 | ||||||
|---|---|---|---|---|---|---|
| The Steps FGA Used to Extrapolate Earnings Data | ||||||
| Step #1: Calculate the Baseline and Quarterly Earnings by Cohort and Year from Observed Earnings | ||||||
| Number of Exiting Parents | Baseline, Quarter Before Exit | 1 Year After Exit, 4th Quarter | 2 Years After Exit, 4th Quarter | 3 Years After Exit, 4th Quarter | 4 Years After Exit, 4th Quarter | |
| Quarterly earnings — cohort 1 | 1,074 | $651,422 | $1,547,098 | $1,877,853 | $2,054,874 | $2,261,819 |
| Quarterly earnings — cohort 2 | 1,440 | $1,127,205 | $2,043,617 | $2,459,957 | $2,711,402 | |
| Quarterly earnings — cohort 3 | 1,881 | $1,487,581 | $3,170,807 | $3,713,495 | ||
| Quarterly earnings — cohort 4 | 1,695 | $1,604,512 | $3,183,932 | |||
| Sum quarterly earnings — cohorts 1-4 | 6,090 | $4,870,719 | $9,945,455 | $8,051,306 | $4,766,276 | $2,261,819 |
| Step #2: Sum Earnings in the Quarter Before Exit and Use It to Estimate Baseline Total Earnings | ||||||
| Number of Exiting Parents | Baseline, Quarter Before Exit | Baseline Year Estimated Earnings | ||||
| Sum quarterly baseline earnings for cohorts 1, 2, 3, and 4 | 6,090 | $4,870,719 | / | |||
| Multiply sum of earnings by 4 | 6,090 | / | $19,482,876 | |||
| Step #3: Sum Earnings in the 4th Quarter After Exit and Use It to Estimate First Year Total Earnings | ||||||
| Number of Exiting Parents | 1 Year After Exit, 4th Quarter |
1-Year Estimated Earnings | ||||
| Sum quarterly earnings for cohorts 1, 2, 3, and 4 | 6,090 | $9,945,455 | / | |||
| Multiply sum of earnings by 4 | 6,090 | / | $39,781,820 | |||
| Step #4: Calculate the Two-Year Growth Rate and Use It to Estimate Second Year Total Earnings (Use sum of quarterly earnings for cohorts 1, 2, and 3) | ||||||
| Number of Exiting Parents | Baseline, Quarter Before Exit | 2 Years After Exit, 4th Quarter | 2-year Growth and Estimated Earnings | |||
| Calculate earnings growth — baseline to year 2 | 4,395 | $3,266,208 | $8,051,305 | 146.5% | ||
| Apply growth rate to sum of quarterly baseline earnings | 6,090 | $4,870,719 | / | $12,006,476 | ||
| Multiply estimated quarterly second year earnings by 4 | 6,090 | / | / | $48,025,904 | ||
| Step #5: Calculate the Three-Year Growth Rate and Use It to Estimate Third Year Total Earnings (Use sum of quarterly earnings for cohorts 1 and 2) | ||||||
| Number of Exiting Parents | Baseline, Quarter Before Exit | 3 Years After Exit, 4th Quarter | 3-Year Growth and Estimated Earnings | |||
| Calculate earnings growth — baseline to year 3 | 2,514 | $1,778,627 | $4,766,276 | 168.0% | ||
| Apply growth rate to sum of quarterly baseline earnings | 6,090 | $4,870,719 | / | $13,052,312 | ||
| Multiply estimated quarterly third year earnings by 4 | 6,090 | / | / | $52,209,249 | ||
| Step #6: Calculate the Four-Year Growth Rate and Use It to Estimate Fourth Year Total Earnings (Use sum of quarterly earnings for cohort 1) | ||||||
| Number of Exiting Parents | Baseline, Quarter Before Exit | 4 Years After Exit, 4th Quarter | 4-Year Growth and Estimated Earnings | |||
| Calculate earnings growth — baseline to year 4 | 1,074 | $651,422 | $2,261,819 | 247.2% | ||
| Apply growth rate to sum of quarterly baseline earnings | 6,090 | $4,870,719 | / | $16,911,756 | ||
| Multiply estimated quarterly fourth year earnings by 4 | 6,090 | / | / | $67,647,024 | ||
End Notes
[1] Nic Horton and Jonathan Ingram, “Work Requirements are Working for Kansas Families: How Welfare Reform Increases Incomes and Improves Lives,” Foundation for Government Accountability, July 31, 2017, https://thefga.org/wp-content/uploads/2017/07/Work-Requirements-are-Working-for-Kansas-Families.pdf.
[2] See Tazra Mitchell, LaDonna Pavetti, and Yixuan Huang, “Life After TANF in Kansas: For Most, Unsteady Work and Earnings Far Below the Deep Poverty Line,” Center on Budget and Policy Priorities, updated February 20, 2018, https://www.cbpp.org/research/life-after-tanf-in-kansas-for-most-unsteady-work-and-earnings-below-half-the-poverty-line.
[3] While parents’ earnings alone may have not lifted a family out of poverty and/or deep poverty, other sources of income — such as child support or food assistance — may have lifted them above the threshold. This report focuses only on reported earnings in unemployment insurance records.
[4] These earnings are based on data for the 1,074 families for which we have four years of data after exit.
[5] Because our data span a five-year period and we wanted to compare earnings to the federal poverty line (which increases slightly every year), we adjusted our earnings data for inflation in 2016 dollars (the last year with a full year of inflation adjustment data) using the CPI-U-RS. The FGA report doesn’t say if its earnings are adjusted for inflation, but we now know it did not adjust for inflation. As such, its earnings estimates are slightly lower than ours, but not by nearly enough to explain the report’s exaggerated earnings.
[6] The full “study period” includes nine quarters: the exit quarter along with the four quarters before it and the four quarters after it.
[7] In Kansas, the entire family is disqualified for three months for the first time a family fails to meet the work requirement, for six months for the second instance of noncompliance, for 12 months for the third instance, and for ten years for the fourth. To regain assistance after the disqualification period, the TANF adult(s) must first participate in work activities for the required number of hours. Under the prior policy, sanctioned families had their benefits ended for the entire family but could return to TANF and begin receiving benefits as soon as they came into compliance with the required work activities.
[8] See Mitchell, Pavetti, Huang for a description of these additional policy changes.
[9] LaDonna Pavetti, “Work Requirements Don’t Reduce Poverty, Evidence Shows,” Center on Budget and Policy Priorities, updated June 7, 2016, https://www.cbpp.org/research/poverty-and-inequality/work-requirements-dont-cut-poverty-evidence-shows#finding1.
[10] Center on Budget and Policy Priorities, “Kansas’ TANF Cash Assistance Is Disappearing for Poor Families,” 2016, https://www.cbpp.org/sites/default/files/atoms/files/tanf_trends_ks.pdf.
[11] Horton and Ingram (2017), p. 6.
[12] We used the federal poverty line for 2016, the latest year for which we have a full year of inflation-adjusted data.
[13] Arloc Sherman and Tazra Mitchell, “Economic Security Programs Help Low-Income Children Succeed Over Long Term, Many Studies Find,” Center on Budget and Policy Priorities, July 17, 2017, https://www.cbpp.org/research/poverty-and-inequality/economic-security-programs-help-low-income-children-succeed-over.
[14] The report states that its calculations are based upon “the average increase from the truncated sample for each impact year and the baseline income for the full sample of 6,090 closures.” Horton and Ingram, footnote 33.
[15] Horton and Ingram, pp. 2 and 8.
[16] Ife Floyd, LaDonna Pavetti, and Liz Schott, “TANF Reaching Few Poor Families,” Center on Budget and Policy Priorities, updated December 13, 2017, https://www.cbpp.org/research/family-income-support/tanf-reaching-few-poor-families
[17] CBPP analysis of U.S. Department of Health and Human Services TANF financial data for fiscal years 2011 and 2015.
[18] Further, the number of TANF adults working in subsidized or unsubsidized employment also fell, from 2,007 adults in 2011 to 914 adults in 2015. CBPP analysis of work participation rate data for fiscal years 2011 and 2016.
[19] Jonathan Ingram, “Pro-dependency advocates miss the mark in attacking Kansas welfare reform,” The Hill, January 25, 2018, http://thehill.com/opinion/healthcare/370687-pro-dependency-advocates-miss-the-mark-in-attacking-kansas-welfare-reform.
[20] The FGA response to this CBPP report indicates that FGA followed families that left TANF between December 2011 and March 2015. To obtain the sample sizes listed in the FGA report, however, the starting point must be October 2011. We assume that FGA’s reference to December is an error and that our comparisons track the same groups of parents.
[21] Median earnings in those respective post-exit years were even lower for these two groups of parents, about $2,200 and $2,175, respectively.
More from the Authors

Areas of Expertise