Creating Opportunity for Children
How Housing Location Can Make a Difference
Executive Summary
Most parents want to raise their children in neighborhoods with good schools, safe streets, and neighbors who support their efforts to raise healthy, happy, and successful families. Their hopes are well-placed because a growing body of evidence supports two conclusions about how neighborhoods affect children’s well-being.
First, high-poverty neighborhoods, which are often violent, stressful, and environmentally hazardous, can impair children’s cognitive development, school performance, mental health, and long-term physical health. Second, poor children who live in low-poverty neighborhoods and consistently attend high-quality schools — where more students come from middle- or high-income families and do well academically, parents are more involved, teachers are likely to be more skilled, staff morale is higher, and student turnover is low — perform significantly better academically than those who do not.
Nearly 4 million children live in families that receive federal rental assistance. This assistance not only helps these families to afford decent, stable housing and make ends meet, but it also has the potential to enable their children to grow up in better neighborhoods and thereby enhance their chances of long-term health and success. Historically, however, federal rental assistance programs have fallen short in helping families live in neighborhoods that provide these opportunities.
Over several decades, policymakers have adopted measures to reduce the extent to which low-income families receiving federal rental assistance are concentrated in distressed neighborhoods and, instead, to improve these families’ access to safe neighborhoods with good schools, more opportunities for recreation and enrichment, and better access to jobs. To do so, policymakers have relied increasingly on housing vouchers (rather than housing projects) so that families may choose where to live rather than be limited to government-funded projects that often are situated in very poor, segregated neighborhoods.
Despite these efforts, in 2010 only 15 percent of the children in families that received rent subsidies through the Department of Housing and Urban Development’s (HUD) three major rental assistance programs — the Housing Choice Voucher (HCV) program, public housing, and Section 8 Project-Based Rental Assistance (as described in Box 1) — lived in low-poverty neighborhoods, where fewer than 10 percent of the residents had incomes below the poverty line. A greater share of such children (18 percent) lived in extreme-poverty neighborhoods, where at least 40 percent of the residents are poor.[1]
The HCV program has performed much better than HUD’s project-based rental assistance programs in enabling more low-income families with children — and particularly more African American and Latino families — to live in lower-poverty neighborhoods. (Only a small share of public housing or privately owned units with project-based rental assistance for families with children are in low-poverty neighborhoods.) Having a housing voucher also substantially reduces the likelihood of living in an extreme-poverty neighborhood, compared with similar families with children that either receive project-based rental assistance or don’t receive housing assistance at all.
Box 1: What Is Federal Rental Assistance?
Federal rental assistance enables 5 million low-income households to afford modest homes. Three major programs — Housing Choice Vouchers, Section 8 Project-Based Rental Assistance, and Public Housing — assist about 90 percent of these households.a In each of these programs, families generally pay 30 percent of their income for rent and utilities.
Housing Choice Vouchers: More than 5 million people in more than 2 million low-income households use housing vouchers. About half of these households have minor children in the home. Families use housing vouchers to help pay for modestly priced, decent-quality homes in the private market. The program is federally funded but run by a network of about 2,300 state and local housing agencies.
Public Housing: About 2.2 million people in nearly 1 million low-income households live in public housing. Forty percent of these households include children, while more than half are headed by people who are elderly or have disabilities. While federally funded, public housing is owned and operated by 3,100 local housing agencies nationwide.
Section 8 Project-Based Rental Assistance (PBRA): PBRA enables 2 million people in more than 1 million households to afford modest apartments, due to long-term rental assistance contracts between the private owners and the Department of Housing and Urban Development. About 30 percent of these households include children. Two-thirds are headed by people who are elderly or have disabilities.
a For more on these programs, see Center on Budget and Policy Priorities, “Policy Basics: Federal Rental Assistance,” January 25, 2013, https://www.cbpp.org/cms/index.cfm?fa=view&id=3890.
Nevertheless, a quarter of a million children in the HCV program live in these troubled neighborhoods despite the better options that a voucher should make available to them. As now administered, the HCV program does not adequately deliver on its potential to expand children’s access to good schools in safe neighborhoods. It can do better.
Based on the evidence on how housing location affects low-income families, particularly children, and the performance of federal rental assistance programs on location-related measures, we recommend two closely related near-term goals for federal rental assistance policy: 1) federal rental assistance programs should provide greater opportunities for families to choose affordable housing outside of extreme-poverty neighborhoods; and 2) the programs should provide better access for families to low-poverty, safe communities with better-performing schools.
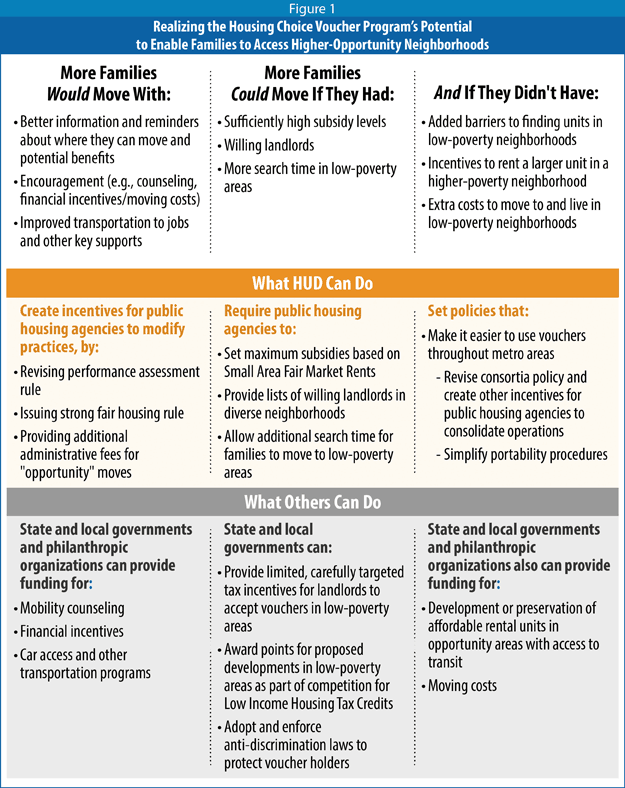
We can make substantial progress toward these goals in the next few years, even in the current fiscally constrained environment and even without congressional action or more funding. Federal, state, and local agencies can make four sets of interrelated policy changes that can help more families in the HCV program to live in better locations. (See Figure 1.)
- Create strong incentives for local and state housing agencies to achieve better location outcomes. Federal policy should provide incentives for agencies to reduce the share of families using vouchers in extreme-poverty areas and increase the share residing in low-poverty, high-opportunity areas. HUD could do this in three ways: by giving added weight to location outcomes in measuring agency performance, reinforcing these changes with a strong fair housing rule — the rule that will revise HUD grantees’ planning for how to achieve outcomes that further fair housing goals — and rewarding agencies that help families move to high-opportunity areas by paying these agencies additional administrative fees.
- Modify policies that discourage families from living in lower-poverty communities. Various HCV program policies impede families from moving to low-poverty areas and thereby unintentionally encourage families to use their vouchers in poor neighborhoods that often are highly racially concentrated. (Most extremely poor neighborhoods are predominantly African American and/or Latino.) HUD should finalize its proposed rule on public housing agencies’ fair housing obligations. It also should set its caps on rental subsidy amounts for smaller geographic areas than it now does, and — at least where necessary to help families move from extreme-poverty, highly racially concentrated neighborhoods to higher-opportunity communities with less poverty — require agencies to identify available units in these lower-poverty communities and extend the search period for families seeking to make such moves.
- Minimize jurisdictional barriers to families’ ability to choose to live in high-opportunity communities. HUD should modify the HCV program’s administrative geography to substantially reduce the extent to which the boundaries of housing agencies’ service areas impede the program’s ability to promote access to higher-opportunity neighborhoods. HUD could substantially lessen these barriers by encouraging agencies in the same metropolitan area to unify their program operations and by simplifying “portability” procedures.
- Assist families in using vouchers to live in high-opportunity areas. To expand housing choices in safe, low-poverty neighborhoods with well-performing schools, state and local governments and housing agencies should adopt policies — such as tax incentives and laws prohibiting discrimination against voucher holders — to expand participation by landlords in these neighborhoods in the HCV program and to encourage interested families to use their vouchers in these areas. Such assistance for families could include financial incentives to offset the additional costs of moving to high-opportunity areas, mobility counseling, and programs to expand access to cars and other transportation to and from these areas.
This focus on enhancing families’ ability to choose to move to areas with more opportunities for their children (or to remain in affordable housing in lower-poverty, high-opportunity neighborhoods) does not imply that policymakers should not pursue broader strategies to increase incomes, enhance safety, and improve educational performance in very poor areas. Quite the contrary. Nevertheless, those strategies often take many years to implement and can be costly, and in many cases, we don’t know very much about their effectiveness.
HUD has begun two programs that, over time, may make a significant difference for children living in public housing or privately-owned assisted housing. The Choice Neighborhoods Initiative provides funding to revitalize distressed HUD-funded properties as a means to support the broader goal of improving residents’ lives, as well as conditions in the surrounding neighborhoods, with parallel investments by partner agencies in education and public safety. In addition, the Rental Assistance Demonstration enables public housing agencies to leverage private funding to rehabilitate and preserve their properties, while giving residents a choice to move with tenant-based rental assistance. If implemented well and expanded, both programs have the potential to help more families live in higher-opportunity neighborhoods.
Helping children and their families to avoid living in violent neighborhoods of extreme poverty and enabling more of the families receiving federal rental assistance to live in low-poverty neighborhoods with high-quality schools should be high-priority goals for federal housing policy.
This paper has three sections. In Section 1, we review the evidence on how neighborhoods affect children; in Section 2, we outline where children in families with rental assistance live; and, in Section 3, we explain the key policy changes needed in federal rental assistance programs to create more opportunity for low-income children.
Table of Contents
- Executive Summary
- Section 1: For Better and for Worse, Neighborhoods Affect Low-Income Children’s Well-Being and Success
- Growing Evidence Links Living in Neighborhoods of Extreme Poverty to Impairments in Children’s Cognitive Development and Physical Health
- Damaging Effects of Toxic Stress
- MTO Families Did Not Experience Economic Gains for Adults or Educational Gains for Children
- Gautreaux Families Experienced Large and Long-Lasting Neighborhood Improvements That Appear to Have Benefited Children
- Moving to Opportunity’s Disappointing Educational Results May Be Related to Study’s Limitations
- Rigorous Study Provides Evidence That High-Opportunity Neighborhoods Improve Children’s Educational Achievement
- Conclusion
- Growing Evidence Links Living in Neighborhoods of Extreme Poverty to Impairments in Children’s Cognitive Development and Physical Health
- Section 2: Federal Rental Assistance Could Do More to Provide Access to Areas of Opportunity
- Families Using Housing Vouchers More Likely to Live in Low-Poverty Areas Than Other Similar Families
- How Federal Rental Assistance Programs Affect the Likelihood That Children Will Live in Extreme-Poverty Neighborhoods.
- Federal Rental Assistance Programs’ Impact on Access to Better-Performing Schools and Safer Neighborhoods
- Weakened Economy Has Undercut Efforts to Increase Voucher Holders’ Access to Lower-Poverty Neighborhoods Since 2000
- Conclusion
- Section 3: Improving Outcomes for Children in HUD's Rental Assistance Programs
- Recommendations: Realizing the Housing Choice Voucher Program’s Potential to Enable Families to Access Higher-Opportunity Neighborhoods
- Create Strong Incentives for Housing Agencies to Achieve Better Location Outcomes
- Modify Policies That Discourage Families From Living in Lower-Poverty Communities
- Minimize Jurisdictional Barriers to Families’ Ability to Choose to Live in High-Opportunity Communities
- Assist Families in Using Vouchers in High-Opportunity Areas
- Expanding Access to Higher-Opportunity Areas in HUD’s Project-Based Rental Assistance Programs
- Conclusion
- Recommendations: Realizing the Housing Choice Voucher Program’s Potential to Enable Families to Access Higher-Opportunity Neighborhoods
- References
Figures and Tables
Figures
Figure 1: Realizing the Housing Choice Voucher Program’s Potential to Enable Families to Access Higher-Opportunity Neighborhoods
Figure 2: Vouchers Cut Families' Exposure to Neighborhood Poverty, But Differences Among Groups Shrank Over Time
Figure 3: Key Elements of Moving to Opportunity (MTO) Families’ Experience
Figure 4: Moving to a Lower-Poverty Neighborhood Improved Adult Health
Figure 5: Low-Income Children Attending Low-Poverty Schools Made Strong Gains in Math and Reading, Compared With Children in Moderate- to High-Poverty Schools
Figure 6: More Families Receive Housing Choice Vouchers Than Other Rental Assistance
Figure 7: Housing Choice Vouchers Enable Larger Share of Children to Live in Lower-Poverty Neighborhoods Than Other HUD Programs
Figure 8: Housing Vouchers Increase Ability of Poor Black and Hispanic Families to Raise Children in Low-Poverty* Neighborhoods
Figure 9: Some Children in Nearly Every State Use Voucher Assistance in Extreme-Poverty Neighborhoods
Figure 10: Vouchers Help Black and Hispanic Families Avoid Extreme-Poverty Neighborhoods
Figure 11: Realizing the Housing Choice Voucher Program’s Potential to Enable Families to Access Higher-Opportunity Neighborhoods
Figure 12: Most Families in Public Housing or Project-Based Assisted Housing in Extreme-Poverty Neighborhoods Are Minorities
Tables
Table 1: Families Receiving Rental Assistance More Likely Than Poor Households and All Renters to Live Near Lower-Performing Schools
Table 2: Housing Vouchers Reduce Exposure to Neighborhood Violence
Table 3: Use of Vouchers Declined in Low-Poverty Neighborhoods and Rose in High-Poverty Neighborhoods Between 2000 and 2010, as the Economy Slumped and Poverty Increased
Appx. Table 1: Where Assisted Families With Children Live, by Poverty Concentration
Appx. Table 2: Racial and Ethnic Composition of Assisted Families With Children, by Program
End notes:
[1] These terms and definitions for “low-poverty” and “extreme-poverty” areas come from the Census Bureau.
Section 1: For Better and for Worse, Neighborhoods Affect Low-Income Children’s Well-Being and Success
Most parents want to raise their children in neighborhoods with good schools, safe streets, and neighbors who support their efforts to raise healthy, happy, and successful families. Conversely, most people believe that children’s chances of being healthy and successful are diminished when they grow up in neighborhoods where violence and crime are common, the schools are ineffective, and young people face enticements to engage in risky or destructive behaviors. Indeed, parents with sufficient resources typically pay more to secure housing in safe, healthy neighborhoods with good schools, thereby placing a large bet on the importance of neighborhoods to their children’s well-being.
Evidence supports such sentiments. Many studies find evidence of the influence of neighborhood poverty, for example, on children’s behavioral and emotional health, cognitive development, and educational achievement.[1] Other studies find significant associations between neighborhood poverty and adult employment, earnings, and related outcomes.[2] Residents of poor neighborhoods also tend to experience health problems — including depression, asthma, diabetes, and heart disease — at higher-than-average rates.[3]
It is particularly hard, however, to disentangle the influences of individual, family, neighborhood, and broader socio-economic factors on the well-being of children and adults. Researchers have thus found it difficult to identify the neighborhood qualities that matter most, to determine how strongly these qualities influence individual outcomes relative to family traits and other influences, and to understand the causal mechanisms at work.[4]
Adding to the difficulties, studies of poor families that have relocated from high-poverty neighborhoods to lower-poverty areas have shown mixed results. In particular, the Moving to Opportunity (MTO) demonstration — a major experimental study launched in the mid-1990s in five cities by the U.S. Department of Housing and Urban Development (HUD) — found striking improvements in mental health for girls and mental and physical health for mothers, but also negative mental health outcomes for boys and no economic gains for adults or educational gains for children. The absence of positive findings on the impacts of moving to lower-poverty neighborhoods on employment and education was disappointing and appeared to be inconsistent with the findings of other residential mobility studies, such as the influential but less rigorous studies of the Gautreaux program in Chicago, which was created as a result of the 1976 settlement of a lawsuit challenging segregation in public housing.
Recent research has made progress, however, in explaining these inconsistencies and clarifying how neighborhoods can affect children’s health and well-being. For example, a recent series of studies led by sociologists Robert J. Sampson and Patrick Sharkey found evidence that living in neighborhoods of concentrated disadvantage — defined in terms of racial segregation, rates of unemployment and welfare receipt, and the share of single-parent families — can impair children’s cognitive development and school performance, and that exposure to neighborhood violence is an important factor in these results.
These studies are consistent with the burgeoning research in neuroscience, molecular biology, epidemiology, developmental psychology, and related areas about the harmful effects on children of toxic stress, which supports the hypothesis that living in high-poverty neighborhoods can impair children’s cognitive development.
Follow-up research has also highlighted some of the MTO study’s important limitations and suggested that these limitations may have influenced key outcomes, particularly the disappointing educational outcomes for children. Meanwhile, a rigorous study by RAND researcher Heather Schwartz of low-income children living in public housing in Montgomery County, Maryland has independently bolstered the case for Gautreaux’s conclusion that low-poverty, high-opportunity neighborhoods can improve children’s educational achievement. These studies all are discussed in more detail below.[5]
This recent work, combined with earlier research, supports the following conclusions:
- High-poverty neighborhoods, which are often violent, stressful, and environmentally hazardous, can impair children’s cognitive development, school performance, mental health, and long-term physical health.[6] These effects occur both directly and indirectly by affecting, for example, parents’ mental health and parenting practices.
- Poor children who live for many years in low-poverty neighborhoods with high-quality schools — where more students come from middle- or high-income families and do well academically, parents are more involved, teachers are likely to be more skilled, staff morale is higher, and student turnover is low — perform significantly better academically than those who do not.[7]
These conclusions have clear implications for housing policy. First, housing policy should help children and their families to avoid living in violent neighborhoods of very high poverty; and second, it should help poor children and their families to live in low-poverty neighborhoods with high-quality schools. Of course, these conclusions also underscore the importance of broader policies to reduce the incidence as well as the concentration of poverty, revitalize poor neighborhoods, improve public safety in such neighborhoods, and improve school outcomes for disadvantaged children. But with nearly 4 million children living in families that receive federal housing assistance, achieving better results for children in these programs should be an important public policy goal.
Growing Evidence Links Living in Neighborhoods of Extreme Poverty to Impairments in Children’s Cognitive Development and Physical Health
Numerous studies show strong correlations between neighborhood (and school) poverty and poor student academic performance. In 2008-2009, for example, one-half of fourth and eighth graders in high-poverty schools failed the national reading test, compared with fewer than one in five children in low-poverty schools.[8] As noted, however, researchers have found it difficult to separate and measure the relative influence of family traits, school quality, and neighborhood characteristics other than school quality on students’ performance.
A recent series of statistical studies led by sociologists Robert J. Sampson and Patrick Sharkey attempts to address the questions about causality. These studies find consistent evidence that living in neighborhoods of concentrated disadvantage adversely affects children.
For example, a study of 6- to 12-year-old African American children in Chicago tracked students over time as they moved into and out of neighborhoods of concentrated disadvantage. The researchers were able to estimate the effects of neighborhoods on these children as their families moved and to isolate these effects from many non-neighborhood factors such as parents’ welfare receipt, income, work status, and marital status.
They found that children living in neighborhoods of concentrated disadvantage had reduced verbal ability — which research shows is a major predictor of educational, employment, and other important life outcomes — by a magnitude equal to one to two years of schooling.[9] Equally striking, the harmful effects not only became stronger the longer that children were exposed to such environments but lingered even after children had left the neighborhoods.[10]
Box 2: Measures of Neighborhood Poverty
Technically, the “neighborhood poverty rate” is the percentage of people in a census tract with incomes below the poverty line. But researchers and policymakers often use the rate of neighborhood poverty as a proxy for a complex set of factors that can influence the well-being of children and adults. These factors include but are not limited to: neighbors’ affluence, educational attainment, employment, welfare receipt, and marriage status; racial concentration; housing conditions; school quality; the availability of services and resources; and the incidence of crime. Researchers commonly use data at the census tract level (a census tract includes roughly 4,000 residents) because of confidentiality and other issues that arise in using data from smaller geographic areas, although census tracts are only a rough approximation of the geographic area of a “neighborhood.”
Just as poverty is not distributed evenly across neighborhoods, neither are these associated factors, and there is only a rough correspondence between poverty rates and the presence or absence of the associated factors in neighborhoods. While poor neighborhoods are generally more likely to experience higher crime rates than low-poverty neighborhoods, for example, two neighborhoods with identical poverty rates may exhibit very different crime patterns.
Research suggests that neighborhood poverty rates of 15-20 percent are a tipping point — that is, the point at which social problems associated with neighborhood poverty often begin to appear; these problems generally worsen at higher poverty rates, hitting a plateau at a poverty rate of about 40 percent.a Accordingly, the U.S. Census Bureau defines a “poor area” as a census tract with a poverty rate of at least 20 percent, and an “extreme-poverty area” as one with a poverty rate of at least 40 percent. An area with a poverty rate of less than 10 percent is designated a “low-poverty area.” Researchers use various measures of “concentrated poverty”; some define such areas as tracts with poverty rates of 30 percent or more, while others focus on areas with poverty rates of at least 40 percent.
Recognizing that neighborhood poverty rates are only a rough proxy for a variety of conditions that affect families, researchers often construct concepts of “concentrated disadvantage” or “high opportunity” that go beyond poverty rates. For example, the 2008 study led by Sampson discussed in this report uses a concept of “concentrated disadvantage” that combines measures of welfare receipt, unemployment, single-mother parenthood, child density, and racial composition, as well as poverty. At the other end of the spectrum, Margery Austin Turner and her colleagues have developed a concept of “high-opportunity” area based on measures of labor force participation, college completion, racial concentration, and job density, as well as poverty.b
For simplicity, we have chosen to focus on the extremes: low-poverty neighborhoods (where rates are less than 10 percent) and extreme-poverty neighborhoods (rates of at least 40 percent). Among neighborhoods fitting into one or the other of these categories, the variation in other factors that potentially affect well-being — such as crime rates and school quality — is relatively modest, which helps in drawing conclusions. The measures we have chosen also align with metrics that the Department of Housing and Urban Development uses in federal rental assistance programs.c
a Galster (2002), (2008), and (2012).
b Turner et al. (2012). Under the direction of john a. powell, the Kirwan Institute has developed sophisticated tools for mapping “opportunity” in neighborhoods and other geographic areas.
c For instance, HUD defines a “low-poverty census tract” in part as one with a poverty rate below 10 percent (24 C.F.R. 985.3(h)). HUD also has proposed to focus required efforts to “affirmatively further fair housing” on areas where 40 percent or more of the residents are poor and a majority are members of racial or ethnic minority groups.
The researchers identified various plausible mechanisms that could explain these outcomes: a fear of violence and other factors that may limit children’s interactions with others or affect parenting practices, perhaps by affecting parents’ mental health; poor school quality in neighborhoods of concentrated disadvantage; and the high degree of social and ethnic segregation found in the poor neighborhoods studied, which may narrow the “speech community” to which children are exposed.
A series of compelling studies led by Patrick Sharkey strongly supports the hypothesis that exposure to neighborhood violence –– which is more common in neighborhoods of extreme poverty –– has significant negative effects on children’s cognitive performance.[11] One study found that when preschool children were assessed within a week of a homicide occurring near their home, they were less able to control their impulses and pay attention, and they scored lower on pre-academic vocabulary and math tests.[12] (Researchers also found elevated levels of stress among the parents, which suggests that parental stress may be a causal pathway by which violence influences children’s performance, a hypothesis that is consistent with the research on toxic stress discussed below as well as the Sampson study discussed above.)
A more recent study by Sharkey, issued earlier this year,[13] compared the standardized test performance of New York City students in the week before a violent crime occurred on their block with that of students in the week after such crimes. The researchers found that exposure to violence significantly reduced students’ performance on English language assessments, particularly for African American students. Among African American students, the effect on scores was equivalent to 13 percent of the black-white gap in test scores and reduced students’ passing rates by 3 percentage points. Sharkey et al. note that while their study directly examines only the short-term effects of neighborhood violence, it has implications for students’ longer-term success, particularly if they are exposed to repeated incidents of violence over the course of a school year.[14]
These studies have limitations. For instance, while Sampson and his colleagues attempt to distinguish the causal effects of neighborhoods of concentrated disadvantage from family characteristics, these methods cannot fully exclude the possibility that unobserved individual or family characteristics, rather than neighborhood characteristics, are driving the results. (It is difficult to see, however, how individual or family characteristics might be large confounding factors in Sharkey et al.’s study of neighborhood violence and children’s cognitive performance, particularly the 2014 study, as such factors would have to be causally linked to the timing of homicides.)
Damaging Effects of Toxic Stress
These studies are consistent with parts of the growing research in neuroscience, molecular biology, epidemiology, and developmental psychology about the harmful effects of toxic stress, which constitutes a second major body of evidence in support of the hypothesis that living in high-poverty neighborhoods can impair children’s cognitive development. “Toxic stress” occurs when a child experiences frequent, prolonged, or excessive fear or anxiety as a result of being exposed to abuse, neglect, violence, or severe hardship, particularly when the child does not receive adequate adult support in coping with the stress. While much of the toxic stress research has focused on the effects of child abuse and family dysfunction, neighborhoods of concentrated disadvantage can also contribute.[15]
Severe stress can negatively affect the health and well-being of people at any age, but toxic stress appears to be particularly damaging to young children whose brains and bodies are still developing. Toxic stress affects brain development, early learning, and the body’s stress response system in ways that can have a long-term effect on young children’s cognitive development and physical health.[16] Research shows, for example, that toxic stress affects brain development in the areas that regulate emotion and executive function, the latter of which includes the ability to create and follow plans, focus attention, inhibit impulses, and incorporate new information –– abilities essential to children’s success in school. Toxic stress has also been linked to physical changes that increase the risk of long-term health problems such as heart disease.
Nurturing support from parents and other adults can mitigate the effects of stress on children. Yet poor parents living in high-poverty neighborhoods themselves experience hardships, stresses, and stress-related problems at higher rates than non-poor adults who don’t live in high-poverty neighborhoods, and these problems can hinder their ability to provide nurturing support for their children (and may engender or exacerbate negative outcomes among children). For example, the incidence of maternal depression, which can affect parenting patterns in ways that undermine the healthy development of children, is much higher among poor mothers than non-poor mothers, and there is strong evidence that neighborhood poverty is a contributing factor to this trend.[17] Researchers also have linked higher levels of stress hormones in poor pregnant mothers to a range of poor developmental outcomes for children.[18] (Similarly, chronic health problems, which also can hamper parents’ ability to provide support to their children, occur more frequently than average among people living in high-poverty neighborhoods.)
Indeed, the research evidence on the causes and effects of toxic stress is so compelling that the American Academy of Pediatrics has adopted a formal policy statement urging policymakers to reshape policy and the provision of services in ways that “reduce the precipitants of toxic stress in young children and to mitigate their negative effects on the course of development and health across the lifespan.”[19] The policy statement explicitly cites “community-level” (or neighborhood) factors such as violence as a specific risk factor for toxic stress.
These findings point to a strong relationship between the conditions found in extreme-poverty neighborhoods — particularly the incidence of violence and other stressors — and children’s cognitive development and long-term health.
Understanding the Moving to Opportunity Demonstration Findings
The aforementioned research raises the question: can children and adults benefit by moving out of high-poverty neighborhoods and into better neighborhoods?
Initiated in 1994, the Moving to Opportunity demonstration was the first random-assignment study designed to test this thesis. Under MTO, volunteer low-income families living in public or private assisted housing in neighborhoods of extreme poverty were randomly assigned to one of three study groups. The families in the “experimental” group received housing vouchers under the condition that they use the voucher to move to a low-poverty neighborhood and remain there for at least one year. (MTO measured “low-poverty” as a census tract where fewer than 10 percent of residents were poor in 1990.) Families in the “Section 8” group received housing vouchers with no special conditions. Families in the “control” group received no assistance through MTO (though some received housing vouchers through regular waiting lists or because they were forced to relocate due to redevelopment of the properties in which they lived). Researchers tracked a broad range of economic, educational, social, and health outcomes for program participants over 15 years.
Moving to Opportunity produced three major findings:
- Housing vouchers enabled families to live in safer, lower-poverty neighborhoods, although only a small share of families in the MTO experimental and Section 8 groups actually located and remained in low-poverty neighborhoods for more than several years.
- Living in safer, lower-poverty neighborhoods yielded substantial mental and physical health benefits for girls and mothers. But there were negative mental health outcomes for boys, and researchers generally found no benefits among boys from MTO participation.
- Despite living in less disadvantaged neighborhoods, MTO families in the experimental and Section 8 groups generally did not experience economic gains for adults or educational gains for children.[20]
These findings, discussed in more detail below, are encouraging in some respects but disappointing in others. Yet the study has important limitations; for instance, few MTO experimental or Section 8 group families moved to and remained in low-poverty neighborhoods, and their children generally continued to attend low-performing, highly segregated schools. Follow-up research suggests that some of these limitations may have influenced key outcomes for children and adults, particularly the disappointing educational outcomes for children and mental health outcomes for boys.
Housing Vouchers Enabled MTO Families to Live in Lower-Poverty Neighborhoods With Less Crime
MTO participants were drawn from assisted housing (90 percent lived in public housing) located in highly segregated neighborhoods with very high poverty rates in five major cities. Poverty rates in these neighborhoods exceeded 50 percent, on average. Adult labor force participation rates and education levels were low. More than 90 percent of the residents in the neighborhoods were minorities.[21]
Using a housing voucher to relocate sharply reduced MTO families’ exposure to neighborhood poverty. One year after receiving a housing voucher, experimental group families who had moved were living in neighborhoods with average poverty rates of 15 percent — 35 percentage points lower than the neighborhoods where the control-group families were living. Five years into the study, the families in the experimental group that succeeded in moving were living in neighborhoods with average poverty rates of about 20 percent — half the 40 percent poverty rate in neighborhoods where the control-group participants resided.[22] Over time, the gap between the average neighborhood poverty rates for these groups continued to lessen, mostly because the average neighborhood poverty rates for control group participants declined to just over 30 percent at the 10-year point.[23] Nevertheless, over the entire 10- to 15-year period of the study, the average neighborhood poverty rate for experimental group families that moved was about half that for control group families — 21 percent versus 40 percent.[24]
While families in both the experimental and Section 8 groups that moved lived in neighborhoods that had lower poverty rates, on average, than the neighborhoods in which control group families resided, few of these families lived in neighborhoods with low poverty rates (i.e., below 10 percent) for very long. There appear to have been two reasons for this. First, some experimental group families that moved didn’t move into low-poverty neighborhoods, despite the restrictions attached to their voucher. This is because neighborhood poverty rates at the program’s start were measured using the 1990 Census, which didn’t accurately reflect current conditions in some declining neighborhoods during the latter half of the decade, when most families moved for the first time. Thus, 89 percent of the experimental group families that moved succeeded in using their vouchers to move initially to a unit in a low-poverty neighborhood, as defined by the 1990 Census, but only 39 percent of the neighborhoods to which these families moved still qualified as low poverty in the 2000 Census.[25]

Second, MTO required experimental group families to remain in the unit to which they initially moved for only a year, and many subsequently moved to higher-poverty neighborhoods.[26] Of the experimental group families that moved as part of MTO, only 27 percent were living in neighborhoods with poverty rates of less than 10 percent at the time of the interim study survey, which was conducted four to seven years after families’ entry into the program.[27]
In short, over the course of the study, MTO experimental vouchers generally helped families to move to and remain in neighborhoods of moderate poverty — where poverty rates ranged from 15 to 24 percent and were lower in general than the neighborhood poverty rates where these families had originally lived — but not to move to and remain in low-poverty neighborhoods.[28] (See Figure 2.)
Families’ exposure to crime also declined. Violent crime rates in the neighborhoods into which experimental group families initially moved were less than half the very high violent crime rates in the origin neighborhoods.[29] There was also a significant, though smaller, reduction in property crime rates in the new neighborhoods. These improvements were sustained over the full follow-up period. Consistent with declines in neighborhood violent crime rates, families in the experimental group also reported fewer observations of drug crime and reported feeling safer than families in the control group.[30]
Though control group families also moved over time to neighborhoods with lower incidences of violent and property crimes — or the neighborhoods in which they lived improved in these respects — significant differences in neighborhood crime rates remained after ten years. For example, the incidence of violent crime in control group neighborhoods was 24 percent higher at the ten-year point than in neighborhoods where experimental group families lived.[31]
The declines in neighborhood crime are impressive but perhaps not surprising. Escaping neighborhood violence and other crime was a major motivation for families to participate in MTO, according to interviews with participant families. The outcomes show that similarly motivated families — those in the control group — were far less successful in realizing their goal if they didn’t receive a housing voucher.
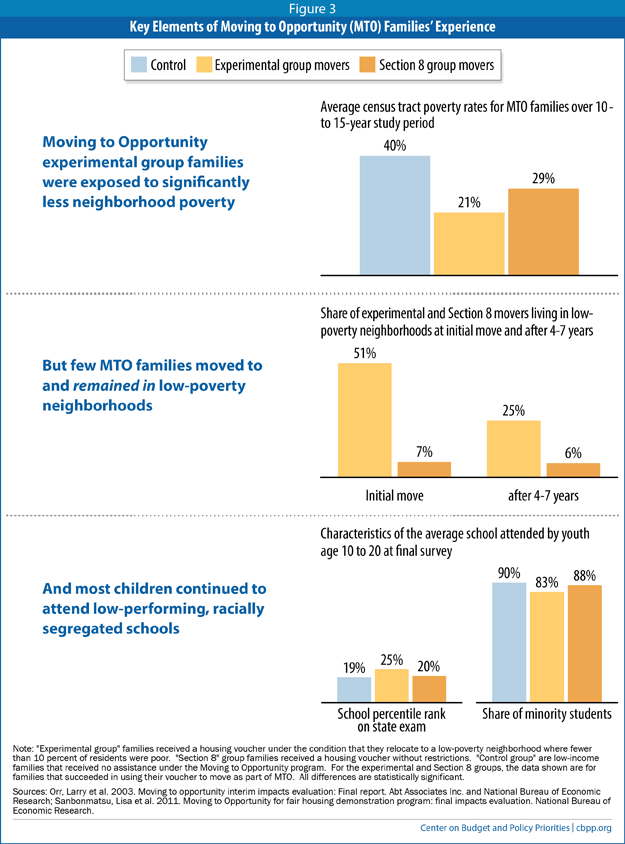
While the neighborhoods in which experimental group families lived had lower poverty and crime rates, on average, they differed little from the origin and control group neighborhoods in other important respects. For instance, the neighborhoods in which experimental group families lived remained highly racially segregated, did not (on average) have significantly higher levels of educational attainment among residents, and did not have much better-quality schools than the origin and control group neighborhoods.[32] (See Figure 3.) As discussed further below, follow-up research by Margery Austin Turner of the Urban Institute and others suggests that these factors affected outcomes for children and adults, particularly educational outcomes under MTO for children.
Girls Moving to Safer, Lower-Poverty Neighborhoods Under MTO Experienced Large Mental Health Gains, While Boys’ Mental Health Worsened
Moving from assisted housing developments in high-poverty neighborhoods to private housing in lower-poverty neighborhoods had strong positive effects on girls’ and adults’ mental health, as well as on adults’ physical health. Qualitative surveys of MTO participants indicate these gains were likely due to participants’ improved sense of safety and reduced exposure to crime and other sources of stress.
For girls in the MTO experimental group whose families moved to lower-poverty neighborhoods, there was a significant reduction in psychological distress compared with girls in the control group, a 51 percent reduction in the incidence of major depression, and a 54 percent reduction in the incidence of serious behavioral or emotional problems. (The incidence of these conditions or problems was measured over participants’ lifetimes to date, except for psychological distress, which was measured over the prior month.)[33] The authors of a follow-up study that found similar results noted that the increased risk for major depression among girls in the control group relative to the other groups is comparable to that found in research on sexual assault.[34]
Qualitative follow-up studies indicate that girls living in high-poverty neighborhoods face gender-specific threats: harassment, pressure for early sexual initiation, pervasive intimate-partner violence, and high risk of sexual assault.[35] In MTO, moving to lower-poverty neighborhoods appears to have provided girls with considerable relief from these threats, leading to the substantial mental health improvements noted above.[36]
The experience of boys participating in MTO was very different. For boys in the MTO experimental group, the risk of major depression (in the month prior to the survey) was twice that for boys in the control group, while the risks for post-traumatic stress disorder (PTSD) and conduct disorders were three times as high.[37] While the share of boys with these negative mental health effects is small, as is the share of girls with significant improvements in mental health, these findings are troubling.
Although researchers generally agree that girls in the MTO experimental group experienced mental health improvements because they felt safer and freer from sexual harassment and coercion in their new neighborhoods, the negative effects for boys are not well understood. Kessler et al.’s provocative description –– that experimental group boys’ increased risk for PTSD is similar to that found in studies of combat exposure in the military — suggests that some boys must have found lower-poverty neighborhoods to be a hostile and traumatic environment. Yet qualitative follow-up surveys provide only modest support for this, and some follow-up research points to alternative explanations.
Boys in both the experimental and control groups reported spending much of their leisure time in parks, schoolyards, vacant lots, street corners, and other public places. Experimental-group boys were more likely to complain that neighbors and police were intolerant of boys hanging out in public spaces. They reported that neighbors (both white and black) were quick to call the police on groups of boys, and they were more likely to report that police had questioned or harassed them.
Experimental group boys also were less likely than control group boys to maintain a meaningful relationship with their fathers or other father figures, perhaps because they lived farther away from their fathers and other male kin. Another factor that emerges from interviews with boys in the MTO experimental group is that they appear to be less skilled than control group boys in navigating neighborhood risks. In interviews, control group boys expressed more detailed knowledge of the geography of risks in their neighborhoods as well as strategies for avoiding troublesome corners or people. Some researchers hypothesize that as differences between the neighborhoods in which the experimental and control group families lived lessened over time (particularly as experimental group families moved back into poorer neighborhoods), experimental group boys may have been less selective in choosing friends — and may have been less well prepared to navigate the risks in their new neighborhoods, not having developed the relevant strategies that control group boys did growing up in high-poverty areas.[38]
Other research suggests that pre-existing vulnerabilities in families may explain part of the differential outcomes for boys in the MTO control and experimental groups. Analyzing data from the interim survey, Osypuk et al. found that the MTO experimental intervention was associated with a significant increase in the incidence of psychological distress and behavior problems among teenaged boys (12 to 19 years), in comparison with the control group, but only among boys in families with certain pre-identified vulnerabilities, such as living with a person with a disability or with a child with behavioral or learning problems.[39] The researchers hypothesized that neighborhood moves may be particularly stressful for youth in families with vulnerabilities, and that for boys, these stresses may have exacerbated the difficulties of adjusting to a new neighborhood.
In sum, the negative mental health outcomes for boys whose families initially moved to low-poverty neighborhoods under MTO are a reason for concern, but firm conclusions about the causes of these outcomes, as well as policy prescriptions, are difficult to draw.[40] Neighborhood change can be disruptive for a family, and the MTO evidence suggests that boys struggled to adapt to such changes more than girls.[41] At the same time, other research indicates that living in low-poverty neighborhoods is not harmful itself for low-income boys.[42] This suggests that efforts should be undertaken to ease the disruption that moving can cause; researchers Stefanie DeLuca, Greg J. Duncan, and their colleagues suggest that counseling to help parents and children transition to neighborhoods and schools, as part of an assisted housing mobility program, might improve outcomes for both boys and girls.[43] Such support, they suggest, might ameliorate the adjustment problems that some children may face. This would be a fruitful area to test, and upon which to conduct research.
Mothers Moving to Lower-Poverty Neighborhoods Experienced Significant Gains in Mental and Physical Health
Parental depression can negatively affect children’s well-being as well as be debilitating for the adults themselves. It is well documented that parental depression (and other stress-related problems, as explained above) can interfere with parenting and is associated with poor social development and poor physical, psychological, behavioral, and mental health for children, particularly young children.[44]
MTO Families Did Not Experience Economic Gains for Adults or Educational Gains for Children
Congress authorized the MTO demonstration in large part to provide a more rigorous test of impressive findings from the Gautreaux program, which was initiated in Chicago in the 1970s. Under Gautreaux, families either living in, or on the waiting list for, public housing were offered housing vouchers and the opportunity to move to available housing units that program staff had identified in neighborhoods where less than 30 percent of residents were African American. While families could refuse an offered unit, few did so, and participants were randomly assigned to housing locations, for all practical purposes. More than 7,000 families participated in the program, and researchers have collected data on participants for periods of more than 20 years.
Children and adults in Gautreaux families who moved to middle-income, mostly white suburbs appear to have experienced strikingly positive economic and educational gains, relative to those who remained in urban or higher-poverty neighborhoods. Researchers have been hesitant to draw firm conclusions from Gautreaux, however, despite its highly suggestive results. This is largely because the program was designed as a legal remedy to segregation, not as a true experimental study that randomly assigned families to treatment and control groups. The Gautreaux studies are thus “quasi-experimental,” making it difficult to be confident that neighborhood characteristics drove the relative outcomes.
MTO has added to the uncertainty. While the MTO outcomes were strong in some areas such as mental health, as discussed above, the economic outcomes for adults and educational outcomes for children did not replicate the Gautreaux findings. However, in light of the Gautreaux findings as well as separate research indicating that neighborhood characteristics do influence children’s cognitive development and school achievement, is it worth exploring some factors that may explain the MTO results.
Gautreaux Families Experienced Large and Long-Lasting Neighborhood Improvements That Appear to Have Benefited Children
About half of Gautreaux participants moved to middle-income, mostly white, suburbs of Chicago, while the other half moved to neighborhoods within the city. Midway through program implementation, neighborhood restrictions were loosened due to a shortage of available units that met the initial criteria; as a result, about one-fifth of Gautreaux participants landed in neighborhoods that were poor and segregated but designated as “improving” by program administrators (nearly all of these neighborhoods were in the city of Chicago).
Still, participants experienced significant reductions in neighborhood poverty rates: nearly half of Gautreaux participants moved to neighborhoods with poverty rates of less than 10 percent, and the mean poverty rate in destination neighborhoods was 17 percent, well below the 42 percent average in origin neighborhoods. Participants also experienced substantial changes in two other important respects: minority neighborhood concentration and distance from original neighborhoods. About half of Gautreaux families moved to neighborhoods where less than 10 percent of residents were African American, and the average concentration of African Americans in destination neighborhoods was 30 percent; at program entry, families lived in neighborhoods that were 83 percent African American, on average. For families that moved to the suburbs, their new neighborhoods were located an average of 25 miles from their original homes, a relatively long distance. In these respects, Gautreaux families experienced much greater neighborhood change than MTO families.
Children’s outcomes under Gautreaux were impressive. Those who moved to the suburbs attended better schools, were less likely to drop out before completing high school, received higher grades, and were more likely to attend college than those who remained in Chicago city neighborhoods. They also were more likely to be employed full time as adults, and to earn better wages, than those moving to locations within the city. [49]
Moving to Opportunity’s Disappointing Educational Results May Be Related to Study’s Limitations
In contrast, the MTO cognitive and educational outcomes for children were disappointing. MTO interim survey data (four to seven years after program entry) found significant and strong positive neighborhood effects on reading test scores in the two demonstration sites that had the highest initial levels of concentrated neighborhood disadvantage: Chicago and Baltimore.[50] But evidence of these effects vanished in the long-term (10- to 15-year) data, which showed no detectable differences in educational achievement among children in the experimental, Section 8, and control groups, even for children who were pre-school age at program entry.[51]
A straightforward reading of the MTO data thus implies that moving to a lower-poverty neighborhood has no lasting impact on cognitive or educational outcomes for children. Yet there are good reasons to resist this conclusion. First, it runs counter not only to Gautreaux but also to the studies by Sampson and Sharkey as well as the research on toxic stress discussed above, which imply that moving out of neighborhoods of extreme poverty should benefit children’s cognitive development.
Second, for all of its strengths, MTO was a weak experimental intervention in important respects.[52] As explained above, not only did few MTO experimental group families live in truly low-poverty neighborhoods for a significant length of time, but the rates of neighborhood poverty and violent crime to which control group families were exposed also declined markedly over time, diminishing the contrast between the experiences of the two groups.[53]
It therefore is possible that the convergence between the MTO experimental and control groups’ exposure to neighborhood poverty and crime blunted the demonstration’s findings on educational outcomes over time. This explanation would appear to be consistent with the findings that there were significant improvements in reading scores among black children in the MTO experimental group, compared with the control group, in the interim analysis of data from Chicago and Baltimore, but that these impacts vanished between the interim and final survey.[54] The original neighborhoods of MTO participants at these two sites were significantly more segregated, disadvantaged, and dangerous than those at the remaining three MTO sites.[55] Consistent with the research by Sampson and Sharkey, one would expect that children moving out of such neighborhoods would be most likely to benefit from the moves. Yet, by the time of the final MTO survey, most control group families also had moved out of their original neighborhoods and had been living in lower-poverty neighborhoods for at least five years.[56]
The MTO intervention also was weak in a second, critical respect — school quality. Children in the MTO experimental group whose families moved with a voucher typically attended low-performing schools that were only slightly less poor and segregated than those attended by children in the control group. For example, in the average school that children in the experimental group attended over the duration of the study, 83 percent of students were minority (compared with 90 percent for children in the control group), 67 percent of students were eligible for free or reduced-price meals (75 percent for the control group), and student scores on state exams ranked the school at the 25th percentile (19th percentile for the control group).[57] (See Figure 3.) In comparison to Gautreaux, MTO’s outcomes for children’s educational achievement may have been disappointing, therefore, because the neighborhoods into which children in the experimental group moved were insufficiently improved with respect to the characteristics — such as school quality — that matter most.
A re-analysis of the MTO data by Urban Institute researcher Marjory Austin Turner and others supports the hypothesis that MTO failed to confirm the Gautreaux results not because the latter were fundamentally flawed, but because of the different characteristics of the comparison neighborhoods that MTO tested. In re-analyzing the MTO data, Turner et al. compared outcomes for children using a measure of each household’s exposure to “high-opportunity” neighborhoods, rather than by comparing outcomes for children across the experimental, Section 8, and control groups.[58] They found that the longer children in MTO families lived in high-opportunity neighborhoods — defined as neighborhoods where poverty rates were less than 15 percent, labor force participation rates exceeded 60 percent, and more than 20 percent of adults completed college — the higher their reading and math scores. These outcomes held for both boys and girls.
Box 3: Questions About Adult Self-Sufficiency Remain After Relocation
The positive employment outcomes for adults who participated in the Gautreaux program in Chicago played a role in spurring Congress to authorize the Moving to Opportunity (MTO) demonstration.a But the very different results from the two initiatives leave continuing uncertainty about the possible linkages between the types of neighborhoods families live in and how much they work and earn.
Early Gautreaux studies found significantly higher employment rates among adults who moved to suburban locations compared with those who remained in the city.b Longer-term studies also found improvements for Gautreaux adults, although these gains were concentrated among families that had moved to low-poverty neighborhoods with minority concentrations of less than 10 percent (irrespective of whether the neighborhoods were located in suburban or city areas).c
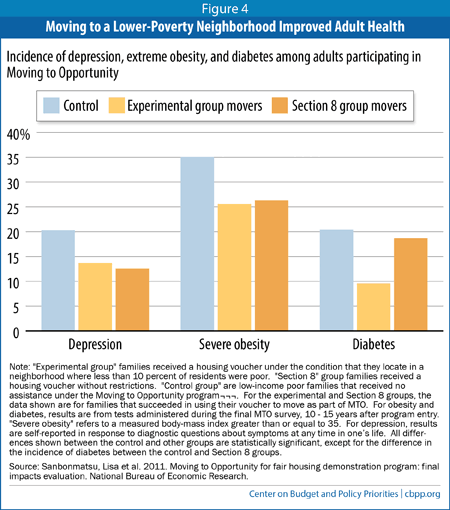
Yet MTO found no significant differences in employment, earnings, or welfare receipt among the experimental, Section 8, and control groups. (Under the demonstration, families in the “experimental” group received housing vouchers under the condition that they use the voucher to move to a low-poverty neighborhood and remain there for at least one year, while families in the “Section 8” group received housing vouchers with no special conditions, and the “control” group received no assistance through MTO.) Although adults in the experimental and Section 8 groups experienced substantial increases in employment and earnings during the 15-year study period, control group adults made equivalent gains. These findings were particularly surprising in light of substantial improvements in physical and mental health among adults in the MTO experimental group: rates of obesity and diabetes — which can hinder ability to work — fell by about 40 percent; the magnitude of those changes is similar to that found in the best-practice pharmaceutical and lifestyle interventions.d (See Figure 4.)
Researchers have offered various possible explanations for the different employment-related outcomes in Gautreaux and MTO. For example, powerful social and economic changes, including changes in welfare policy that emphasized work, a major expansion of the Earned Income Tax Credit, and a booming economy in the late 1990s that resulted in historically low unemployment rates, occurred during the MTO study period. These changes may have overwhelmed the potential effects of neighborhood characteristics on MTO families.e Others have suggested that the different types of neighborhood changes effected in Gautreaux and MTO — specifically, while many Gautreaux families moved to mostly white, middle-class, suburban neighborhoods, families in the MTO experimental group typically lived after the initial year or so in poorer urban neighborhoods with large minority concentrations — might help explain the differences in “self-sufficiency” outcomes.f
MTO researchers also uncovered evidence that casts doubt on some, though not all, of the explanatory hypotheses connecting neighborhoods and employment. For instance, MTO researchers found no evidence that living in lower-poverty neighborhoods improved families’ access to or information about jobs.g In addition, researchers found that limited availability of public transportation in low-poverty neighborhoods was a particular challenge for families in the MTO experimental group, most of whom did not own or have access to a car to help them get to work.h Families that had access to a car were more likely both to work andto remain in low-poverty areas.i
a Popkin, Rosenbaum & Meaden (1993); DeLuca et al. (2010).
b Rosenbaum (1995).
c DeLuca et al. (2010).
d Sanbonmatsu et al, 2011, Ludwig, 2012, Gennetian et al, 2013.
e DeLuca et al. (2012); Orr et al. (2003).
f Clampet-Lundquist & Massey (2008); Turner et al. (2012).
g DeLuca et al. (2012); Turner et al. (2012).
h DeLuca et al. (2010).
i Pendall et al. (2014).
j Kling et al. (2007), Gennetian et al. (2013).
Rigorous Study Provides Evidence That High-Opportunity Neighborhoods Improve Children’s Educational Achievement
An important recent study by RAND Corporation researcher Heather Schwartz has independently bolstered the case for Gautreaux’s conclusion that low-poverty, high-opportunity neighborhoods can improve children’s educational achievement. In her study of low-income children living in public housing and attending elementary schools in Montgomery County (a Maryland suburb bordering the District of Columbia),[59] she found that:
- Low-income students who lived in low-poverty neighborhoods and attended low-poverty schools made large gains in reading and math scores over a period of seven years, compared with students attending moderate- or moderately high-poverty schools.
- These educational gains accrued over time, with the majority of the gains accruing in years five to seven. Residential stability in low-poverty neighborhoods and schools thus appeared to be a crucial condition of the children’s success.
- Students benefitted academically from living in low-poverty neighborhoods, but most (two-thirds) of the gains came from attending a low-poverty school.
Schwartz tracked 850 students in the county, 72 percent of whom were African American, 16 percent Hispanic, and the rest either non-Hispanic white or Asian. The students’ families had average incomes of about $22,000 per year as of 2007. In their initial year in the school district, the students’ math and reading scores were well below the average for students in the school district.[60]
Schwartz’s study took advantage of a natural experiment made possible by the county’s housing policies. Applicants for public housing assistance were randomly assigned to public housing developments across the county. Because of the county’s zoning policies, most of these developments are located in low-poverty neighborhoods (with poverty rates of less than 10 percent), while the others are located in neighborhoods with moderate or high poverty rates (up to 32 percent). This enabled Schwartz to compare educational outcomes for students living in neighborhoods and attending schools that differed significantly with respect to poverty and related characteristics. Housing location was remarkably stable for these families, and Schwartz tracked students over a seven-year period.
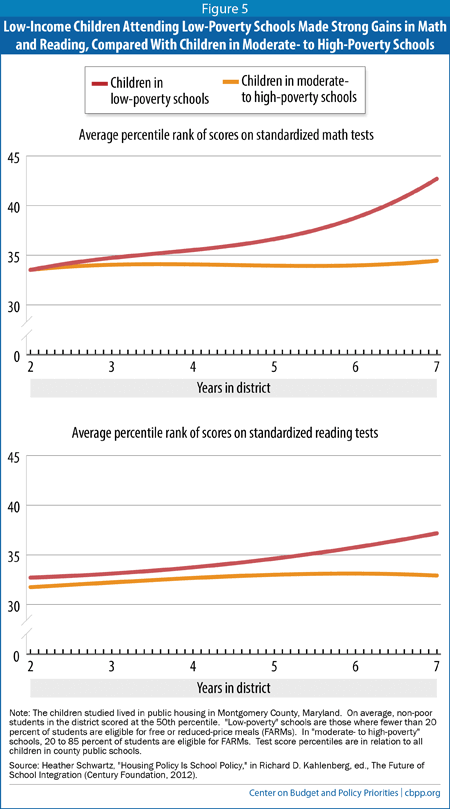
Schwartz’s results were striking: at the end of seven years, the test scores of the public housing children in low-poverty schools had risen by 8 percentile points in math and 4 percentile points in reading, thereby closing half of the achievement gap between those students and non-poor students in the district in math and one-third of the gap in reading. (See Figure 5.) Those are large gains by educational standards. The gains were greatest among the students in neighborhoods where poverty rates were very low — less than 5 percent. By contrast, over the same period, there were no significant improvements in the results for public housing students in the moderate- and moderately high-poverty schools.[61]
The improvements were even more pronounced when Schwartz compared outcomes for children using the school district’s own criteria for distinguishing advantaged and disadvantaged schools, rather than distinguishing among schools based on family income alone.[62] After seven years, poor students attending advantaged schools performed 9 percentile points higher in math and 7 percentile points higher in reading than their peers in disadvantaged schools. These results are striking in light of the fact that the disadvantaged schools in Montgomery County receive substantial additional resources through state-of-the-art educational intervention programs. Yet the benefits of attending advantaged schools swamped the effects of the educational interventions in disadvantaged schools.
The length of time required for these gains to become evident is also notable. During the first several years of the study, the average test scores of the students in both low-poverty and advantaged schools differed little from those in other schools; significant differences began to appear only in the students’ fifth year. The differences widened considerably in the sixth and seventh years, as test scores of students in low-poverty and advantaged schools improved significantly. In general, this is consistent with the Gautreaux findings, where children struggled initially as they adjusted to new neighborhood and school environments that differed significantly from their original environments, yet achieved significant educational gains in the longer run. These results are also consistent with the picture portrayed by Turner et al.’s reanalysis of MTO data, which showed that the longer children remained in low-poverty, high-opportunity neighborhoods, the better their school performance.
Neighborhood and school characteristics are interdependent — for instance, the income and level of educational attainment of neighborhood residents strongly influence the peer groups to which students are exposed in schools — making it difficult for researchers to tease apart the relative influence of each. Schwartz attempted to do so, however, finding that both neighborhood and school poverty influenced student test scores and that the magnitude of the effect of school poverty was about twice as large as that of neighborhood poverty.[63] The benefits of living in low-poverty areas for students were most significant in neighborhoods with poverty rates of less than 5 percent. These findings are consistent with the results of other studies that compare the relative influence of school quality and other neighborhood characteristics, although it should be noted that the variation in neighborhood poverty rates in Montgomery County is relatively small.[64]
Conclusion
The body of research is complex but careful consideration of the evidence supports the conclusion that neighborhoods affect children’s well-being, both in the short and long term. First, there is growing evidence that violent, stressful, high-poverty neighborhoods can compromise children’s cognitive development, school performance, and health. Second, while MTO did not affirm the Gautreaux studies’ conclusions that moving from high-poverty to low-poverty neighborhoods yields economic gains for adults and improved scholastic achievement for children, researchers have identified limitations in the MTO intervention that may explain these inconsistent results, at least the educational outcomes for children. With this in mind, a balanced consideration of the full body of evidence — one that takes into account Heather Schwartz’s rigorous study of children in Montgomery County, as well as Gautreaux and MTO — indicates that low-poverty neighborhoods with high-quality schools improve children’s school performance.
These conclusions have implications for housing policy. Federal rental assistance programs fall short in helping families live in neighborhoods that provide better opportunities, as the next section of this paper explains. The final section of the paper discusses possible policy reforms to help address these issues.
End notes:
[1] Ellen & Turner (1997), Turner & Kaye (2006), Jargowsky & El Komi (2009), DeLuca & Dayton (2009), Burdick-Will et al. (2011).
[2] Jencks & Mayer (1990), Ellen & Turner (1997), Sampson, Raudenbush, & Earls (1997), Sampson et al. (2002), and Sampson (2012). These sources are cited in Ludwig et al. (2013).
[3] Kawachi & Berkman (2003), Turner & Kaye (2006), Berube (2008).
[4] Ellen and Turner (1997), Galster (2012).
[5] Schwartz (2010).
[6] The roles of violence and stress are discussed below, and environmental hazards — particularly those associated with the lower-quality housing typically found in poorer neighborhoods — will be discussed separately in a forthcoming Center report. Generally, children in high-poverty neighborhoods are more likely to be exposed to health hazards such as lead-based paint, vermin, and pollution, and, as a result, are more likely to suffer from asthma and the serious effects of lead poisoning. These risks are cited in Berube (2008) and Cohen (2011), and explored in Kawachi and Berkman (2003).
[7] See Kahlenberg (2012) and Gallagher, Zhang, & Comey (2013) for reviews of literature linking these characteristics to low-poverty, high-quality schools.
[8] Aud et al. (2010), cited in Schwartz et al. (2012).
[9] Sampson et al. (2008). A separate study of Chicago youth by Ludwig et al. (2009), which took advantage of a natural experiment created by the random assignment of housing vouchers to families who had applied for vouchers, found similar results. This study, in discussion draft form, is discussed in Burdick-Will et al. (2011).
[10] Building on the work of Sampon and others, Wodtke et al. (2011) also found that sustained exposure to neighborhoods of concentrated disadvantage had a long-term impact on children’s educational achievement. Analyzing data, including neighborhood changes, for more than 4,000 students from across the country over a 17-year period, they found a 20 percentage-point difference in high-school graduation rates for black children with the greatest exposure to neighborhood disadvantage, relative to comparable black children with the least exposure.
[11] Sharkey (2010), Sharkey et al. (2012), and Sharkey et al. (2014).
[12] Sharkey et al. (2012).
[13] Sharkey et al. (2014).
[14] Sharkey et al. (2014), p. 217.
[15] Centers for Disease Control and Prevention (2014).
[16] National Scientific Council on the Developing Child (2014); National Scientific Council on the Developing Child (2010); Shonkoff et al. (2009); Shonkoff et al. (2012).
[17] NSCDC (2009). Recent research showing that neighborhood poverty has a significant effect on the incidence of depression among low-income parents is discussed below.
[18] Aizer, Stroud, & Buka (2012).
[19] American Academy of Pediatrics (2012).
[20] Sanbonmatsu et al. (2011), “Forward.”
[21] Sanbonmatsu et al. 2011, Exhibit 2.1. Neighborhood characteristics were measured at the census tract level.
[22] Ludwig (2012). Only 47 percent of families assigned to the experimental group and 62 percent of those assigned to the Section 8 group succeeded in using their vouchers to move. This experience on the part of the Section 8 group families is roughly consistent with that of other families using housing vouchers. The reduced success rate of experimental group families was almost certainly due in large part to the requirement that they move to low-poverty neighborhoods, which presents additional challenges discussed in Section 3.
In most of our discussion of MTO, we focus on “treatment-on-treated” effects — that is, on the outcomes for those families in the experimental and Section 8 groups that actually moved with their vouchers (which in the case of the experimental group required an initial move to a low-poverty neighborhood) — as we are largely interested in understanding the effects of neighborhood conditions on families, rather than the effects of voucher issuance. But it’s worth noting that the “intent-to-treat” (ITT) impacts (that is, the impacts on families whether or not they succeeded in using the voucher they received as part of the demonstration to move to a new neighborhood (which, in the case of experimental group families, was required to be a low-poverty neighborhood) also were significant.
[23] Neighborhood poverty rates for control group families fell both as families moved out of their original assisted housing units and as neighborhoods surrounding those units improved over time. By the mid-2000s, the average poverty rate in MTO families’ original neighborhoods had fallen from 53 percent to 42 percent. See Sanbonmatsu et al. 2011, Exhibit 2.1.
[24] Ludwig 2012, Ex. 2. Results for Section 8 movers were roughly similar to those for experimental-group families that moved, though the improvements (relative to the control group) were smaller in magnitude. The average neighborhood poverty rate over the entire 10- to 15-year study period was 28.5 percent for families in the Section 8 group that moved, compared with 40 percent for the control group. Note that these outcomes differ from those of Housing Choice Voucher users overall, as discussed in Section 2 of this paper.
[25] Orr et al. (2003); also discussed in Comey, Briggs, & Weismann (2008). Families that enrolled in MTO leased up over a five-year period from 1994 to 1999. Using a linear interpolation, researchers have estimated that only about half of the experimental group families that moved were located in low-poverty neighborhoods at initial lease-up. It is not clear why 11 percent of experimental group families were allowed to move initially to neighborhoods with poverty rates that exceeded 10 percent in 1990.
[26] MTO experimental group families that made an initial move remained at their initial addresses just three years, on average, and three-quarters of these families had moved again within five years of their initial move. Sanbonmatsu et al. (2006). See Turner et al. (2012) for a discussion of the neighborhood trajectories of families over time.
[27] Ludwig (2012), Exhibit 2, and Orr et al. (2003). To make for consistent comparisons, all figures related to area poverty rates are based on the 2000 Census.
[28] In addition, mobility among some control group families may have reduced the magnitude of the neighborhood differences experienced by families in the three groups. By the time of the interim survey (four to seven years out from program assignment), 70 percent of control group families had moved from their original locations, including many who were compelled to move from their original public housing units by HOPE VI demolitions. (About one-fifth of all MTO participants originally lived in public housing units that were later demolished under HOPE VI.) Many control group families displaced by HOPE VI demolitions would then have received a Section 8 voucher. See DeLuca et al. (2012).
[29] In a baseline survey of Boston families participating in the MTO demonstration, for example, one-fourth reported that someone in the household had been assaulted, beaten, stabbed, or shot within the past six months, and another quarter reported that someone had tried to break into their house, or that a household member had been threatened with a knife or gun or had their purse or jewelry snatched, in the past six months. See Kling, Liebman, & Katz (2005), cited in DeLuca et al. (2012).
[30] Crime rates in neighborhoods where families in the Section 8 group located were also lower than crime rates in neighborhoods where control group families lived, though not as low as the average crime rates for neighborhoods into which experimental group families moved.
[31] Ludwig (2012).
[32] Ludwig (2012), Turner et al. (2012), DeLuca et al. (2012).
[33] Sanbonmatsu et al 2011, Exhibits 4.4, 4.5, and 4.6. Sanbonmatsu et al. also found reductions in psychological distress and depression among girls in the Section 8 group whose families had moved, but these were not statistically significant. At the time of the final MTO study survey, these girls were aged 13 to 20 years old; at program entry, they were 0 to 11 years old, and their average age was 4.7 years. Except where noted, the figures are for long-term outcomes under MTO – that is, during the 10- to 15-year follow-up period and represent the results for the “treatment-on-treated” group, as these provide the best measure of the effects of neighborhood conditions. Researchers assessed “psychological distress” using the Kessler 6 measure, and the measured reduction for girls in the experimental group whose families moved was equivalent to one-quarter of a standard deviation. Results for some other measures of mental health also were positive for girls but not statistically significant. Similarly, the results for girls in families using regular Section 8 vouchers suggested improvements in some areas of mental health but were not large enough to be statistically significant.
[34] Kessler et al. (2014) found significant reductions in the incidence of depression and conduct disorders in girls in the Section 8 group; for girls in the experimental group, the incidence of these problems was reduced, relative to the control group, but the change was not statistically significant. These findings differ somewhat from those of Sanbonmatsu et al. (2011), which found statistically significant improvements for girls in the experimental group but not the Section 8 group. Both Kessler et al. (2014) and Sanbonmatsu et al. (2011) analyzed data from the diagnostic survey that was included as part of the final MTO study survey; differences in their results derive from differences in the analytical methods they used. Despite these differences, the two reports are consistent in supporting the conclusion that moving out of extreme-poverty neighborhoods produced improvements in girls’ mental health.
[35] Briggs, Popkin, & Goering (2010); Popkin, Leventhal & Weisman (2010); Smith et al. (2014). The qualitative research indicates that these risks were particularly acute in the public housing developments in which the families lived prior to moving through MTO. In addition, girls in the Section 8 group experienced improvements in mental health, relative to the control group (see notes 33 and 34), despite the fact that few Section 8 group families moved to low-poverty neighborhoods. This suggests that moving to a safer neighborhood from the extreme-poverty environment was the key factor in improving girls’ mental health, and that it mattered less whether the destination was a low- or moderate-poverty neighborhood.
[36] The ability to use a voucher to “move to safety” may save some lives. Votruba and Kling (2009), who reexamined data on participants in the Gautreaux program, found significantly reduced mortality rates among young black males whose families used housing vouchers to move from public housing in high-poverty areas to private housing in lower-poverty neighborhoods with higher shares of well-educated residents. Jacob et al. (2013) also found dramatic reductions in mortality among girls whose low-income families received housing vouchers via a random lottery, in comparison to similar girls whose families did not receive vouchers. Among boys, however, Jacob et al. found no significant effects.
[37] Kessler et al. (2014). These risk figures are for “intent to treat” groups; Kessler et al. do not provide figures for the “treatment on treated” group. Boys in the Section 8 group also were at greater risk for mental health problems than those in the control group, though the differences were generally smaller than for those in the experimental group.
[38] The qualitative surveys (performed at the study interim of four to seven years) are discussed in DeLuca et al. (2012) and Clampet-Lundquist et al. (2011).
[39] Osypuk et al. (2012). The researchers also found that girls in families with vulnerabilities did less well than girls in other families but that the net effect of the MTO intervention remained positive for girls overall.
[40] For a concise summary and review of researcher’s perspectives on the gender differences in MTO outcomes, see HUD (2014).
[41] Neighborhood changes of many types — including both positive and negative changes in neighborhood poverty — have been linked to behavior problems in boys. See Leventhal and Brooks-Gunn (2011).
[42] When a group of researchers led by Margery Austin Turner analyzed MTO children’s outcomes relative to how long their families lived in low-poverty, high-opportunity areas, they found no significant differences between the mental health outcomes for boys who lived for longer periods in low-poverty, high-opportunity neighborhoods and those whose families had never moved to low-poverty neighborhoods or who had lived in such neighborhoods only for shorter periods. This suggests that the poor outcomes for boys uncovered by Kessler et al. may be due to factors that are unrelated to living in low-poverty neighborhoods. See Turner et al. (2012), which is discussed further below.
[43] DeLuca et al. (2012). The researchers cite an innovative Baltimore program that provides counselors who educate parents on the implications of residential choice for access to high-quality schools, and also “work with parents to help transition students into new schools, which is critical for special needs children as well as for parents who feel intimidated by the unfamiliar settings.”
[44] This research is summarized in National Scientific Council on the Developing Child, “Maternal Depression Can Undermine the Development of Young Children,” (Center on the Developing Child, Harvard University, 2009).
[45] Ninety-two percent of MTO households were headed by women; Orr et al. (2003).
[46] Sanbonmatsu et al. 2011, Exhibits 4.3. Among adults in the Section 8 group who moved, the effect was slightly larger, relative to the control group.
[47] Kling et al. (2007), Gennetian et al. (2013).
[48] Ludwig (2012); Ludwig et al. (2013). Ludwig et al. use the metric of a 13-percentage point difference because this is equal to one standard deviation in the normal distribution of census-tract poverty rates.
[49] Rosenbaum (1995) and DeLuca & Dayton (2009). For instance, 20 percent of city-dwelling children dropped out of school, but only 5 percent of suburban-dwelling children did. While 21 percent of city-dwelling child participants went on to attend college, 54 percent of suburban-dwelling children did. It is important to note that these outcomes are based on parental reports.
[50] Orr et al. (2003); Burdick-Will et al. (2011).
[51] Gennetian et al. (2012).
[52] Briggs, Popkin, & Goering (2010); DeLuca et al. (2010); Darrah & DeLuca (2014).
[53] As noted above, the MTO intervention differed in this and related respects from the Gautreaux intervention, where most families moved to low-poverty, middle-income, non-racially concentrated neighborhoods that were located far from the families’ origin neighborhoods.
[54] Another potential reason for the null final educational results in MTO, in contrast to the significant positive outcomes in Gautreaux, is the difference in the presence of affluent and highly educated neighbors (which is related but not identical to measures of neighborhood poverty). Some research shows that the presence of affluent neighbors is associated with improved school outcomes for children, including low-income children (Brooks-Gunn, Duncan & Aber, 2000). While families in the MTO experimental group experienced initial sizable improvements in these respects, relative to the control group, the educational attainment of adults in neighborhoods in which they lived remained well below the national average. Twenty-five percent of the adults were college graduates in the neighborhoods to which MTO experimental group families moved, on average (compared with 16 percent for the control group); yet 32 percent of adults nationally have completed bachelor’s degrees. U.S. Census Bureau (2013).
[55] Burdick-Will et al. (2011).
[56] At the time of the final MTO survey, 10 to 15 years after program entry, control group families lived in neighborhoods with poverty rates of about 33 percent, on average, compared with 53 percent at baseline. Indeed, while site-specific data from the final survey are not public, there are reasons to believe that control group moves were particularly prevalent in Chicago and Baltimore, as many of the largest and most distressed public housing projects in these cities were emptied and then demolished during the MTO study period.
[57] Sanbonmatsu et al. 2011, Exhibit 7.3. These figures are weighted averages for all schools attended during the entire survey period. Follow-up surveys indicate that some experimental group children remained in the same schools as they attended before joining the MTO demonstration; see DeLuca et al. (2012).
[58] Turner et al. (2011) thus ignore MTO’s random assignment of families into experimental and control groups, which limits the confidence with which causal conclusions may be drawn from the study. Nevertheless, the results are suggestive, particularly in combination with the other studies cited here.
[59] Montgomery County is a wealthy suburban county, and its low-poverty schools generally are considered to be of very high quality, with high test scores and college entry rates. As noted below, the county also has infused higher-poverty schools with significant additional resources to address the achievement gap.
[60] Average scores for public housing residents in the initial year ranged from the 36th to the 42nd percentiles.
[61] Schwartz (2012) defines these categories in terms of the share of children in each school that were eligible for free or reduced-price meals (FARM). Schools where no more than 20 percent of the children were FARM-eligible were defined as “low poverty; “moderate-poverty” and “moderately-high” poverty schools were those where between 20 and 40 percent, and more than 40 percent of the children, respectively, were FARM-eligible. (In few schools in Montgomery County are more than 65 percent of children eligible for FARMs. Overall, fewer than one-third of the school children in Montgomery County are FARM-eligible. This is less than the national average of 43 percent and well below the average in many large, urban areas.)
[62] Montgomery County directs additional resources to schools identified as being disadvantaged under its criteria, including resources to extend kindergarten hours, reduce class sizes, provide additional professional development for teachers, and introduce a literacy curriculum tailored to the needs of disadvantaged students.
[63] Schwartz (2012) was able to take advantage of the fact that there is somewhat greater variation in poverty rates among schools than among neighborhoods in Montgomery County in order to perform a statistical analysis that distinguishes neighborhood and school effects. Neighborhood poverty rates in Montgomery County range from 0 to 32 percent, and only 20 percent of the public housing households live in neighborhoods with poverty rates exceeding 10 percent. FARM-eligibility rates range from 17 to 72 percent in the schools attended by public housing students; in one out of five schools, at least 40 percent of students are eligible for FARMs.
[64] Jargowsky & El Komi (2009). Also see the previous note on the variation in neighborhood poverty rates in Montgomery County.
Section 2: Federal Rental Assistance Could Do More to Provide Access to Areas of Opportunity
In recent decades, policymakers have adopted various measures to reduce the extent to which federal rental assistance programs leave poor families in distressed neighborhoods and to expand access to safe neighborhoods with good schools, recreational opportunities, and access to jobs. To do so, they have relied increasingly on housing vouchers to provide rental assistance, so that families may choose where to live rather than being limited to government-funded projects that often were situated in poor, racially concentrated neighborhoods.[1]
Despite these policy trends, in 2010 only 15 percent of the nearly 4 million children in families that received rent subsidies through HUD’s three major rental assistance programs — the Housing Choice Voucher program, public housing, and Section 8 Project-Based Rental Assistance — lived in low-poverty neighborhoods where fewer than 10 percent of the residents have incomes below the poverty line. That is only slightly more than the share of all poor children (most of whom don’t receive housing assistance) who live in low-poverty neighborhoods (and far below the 46.5 percent of all children who do).[2] Moreover, the share of children in families receiving rental assistance who lived in extreme-poverty neighborhoods (where at least 40 percent of the residents are poor) was 18 percent, or higher than the share of such children who lived in low-poverty neighborhoods.[3]
The HCV program has performed far better in enabling families with children to live in lower-poverty neighborhoods than have HUD’s project-based rental assistance programs. One in five families with children participating in the HCV program (20.2 percent) used their vouchers to live in a low-poverty area in 2010. This is 5.5 percentage points higher than the share of all poor children who lived in low-poverty areas.[4] And although having a voucher makes little difference in a poor white family’s ability to live in a low-poverty neighborhood, it makes a large difference for minority families. In contrast, fewer than 10 percent of families with children in public housing or privately owned units with project-based rental assistance lived in low-poverty neighborhoods.[5]
Having a housing voucher also substantially reduces the likelihood of living in an extreme-poverty neighborhood where at least 40 percent of the residents are poor. More than a third (35 percent) of family-occupied public housing units and 22 percent of family-occupied, privately owned units with project-based assistance are in extreme-poverty neighborhoods. A much smaller share of families that receive rental assistance through the Housing Choice Voucher program — 10 percent — live in these neighborhoods.
Nevertheless, one in five children in neighborhoods of extreme poverty received federal rental assistance in 2010, including nearly a quarter million children in the HCV program,
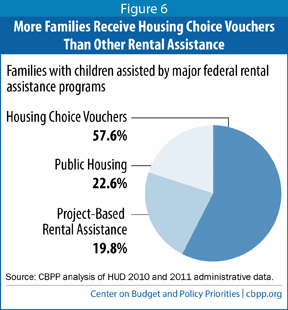
Families Using Housing Vouchers More Likely to Live in Low-Poverty Areas Than Other Similar Families
About half (51 percent) of the 2.1 million low-income families that use Housing Choice Vouchers (HCV) have minor children in the home.[6] The HCV program assists more families with children than the other two major rental assistance programs combined. (See Figure 6.)
Families use vouchers to live in a wide range of communities. Nationally, vouchers are in use in 88 percent of census tracts. (Each census tract has about 4,000 people.) Typically, the HCV program subsidizes fewer than 10 percent of the rental units in a neighborhood, but voucher use is more concentrated in the largest metropolitan areas.[7]
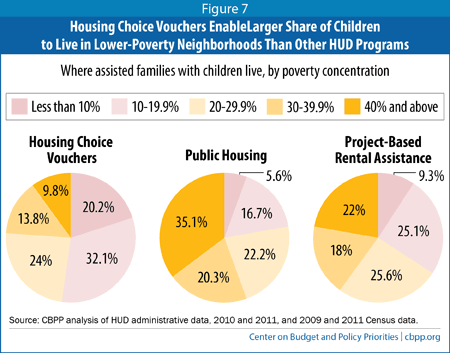
As noted, one of five families with children participating in the HCV program (20.2 percent) used their vouchers to live in a low-poverty area in 2010.[8] (See Figure 7 and Technical Appendix Table 1.) Overall, families used vouchers to live in neighborhoods with a median poverty rate of 19.2 percent in 2010. (For just the poor families in the program, the median tract poverty rate was 20.0 percent.) In comparison, the typical poor child lived in a census tract where 21.6 percent of the residents are poor. Research supports that having a voucher — rather than something about the families that receive HCV assistance — has a modest but positive effect in enabling families with children to live in less-poor neighborhoods than similar poor families.[9]
Housing Vouchers Increase Ability of Poor Black and Hispanic Families to Raise Children in Low-Poverty Neighborhoods
The share of families with Housing Choice Vouchers that live in low-poverty areas is greater for non-Hispanic white families with children (27.8 percent) than for black (17.9 percent) and Hispanic (16.6 percent) families. The gap between white and minority households narrowed substantially, however, between 2000 and 2010.[10]
A closer look at comparison data shows that while having a voucher makes little difference in a poor white family’s ability to live in a low-poverty neighborhood, it makes a large difference for minority families. Among families using vouchers, more than twice the share of poor black children, and close to double the share of poor Hispanic children, lived in neighborhoods with less than 10 percent poverty in 2010, compared with poor black and Hispanic children generally. In contrast, poor white children in families with vouchers were slightly less likely to live in low-poverty neighborhoods than poor white children overall. (See Figure 8.)
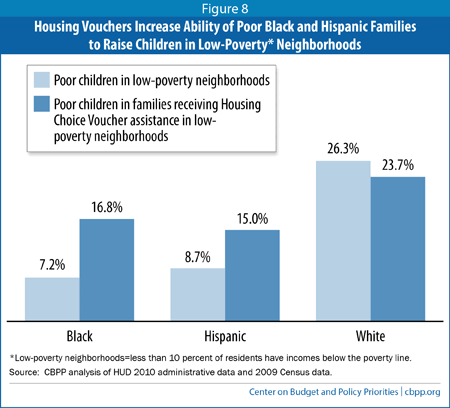
Analysis by the Institute for Research on Poverty at the University of Wisconsin reinforces this finding. Comparing Wisconsin families with vouchers to similar families without housing assistance, the analysis found that after four years of using a housing voucher, black voucher recipients lived in somewhat lower-poverty neighborhoods than comparable black households without housing assistance. These neighborhoods also were of better quality on three other dimensions: the unemployment rate, the percentage of 16- to 19-year-olds in school, and median gross rent. In contrast, the neighborhoods where white voucher recipients lived at the four-year point were slightly higher-poverty and not significantly different on the other dimensions of neighborhood quality from the neighborhoods occupied by comparable unassisted white families.[11]
It appears that at least some of this positive impact of voucher assistance on the access of black and Hispanic families to low-poverty communities results from families moving to low-poverty suburban neighborhoods. The share of black HCV recipients living in the suburbs of the 100 largest metropolitan areas increased by more than 12 percent between 2000 and 2008, helping to drive the overall increase over that eight-year period in the share of metropolitan vouchers used in suburban areas. Moreover, a growing share of suburban minority voucher holders live in high-income and particularly high-job-access suburbs.[12]
But substantially more progress on using vouchers to access high-opportunity neighborhoods should be possible. Researchers Alex Schwartz and Kirk McClure found that voucher holders overall, and minority voucher holders in particular, are underrepresented in the 60 percent of the least-distressed census tracts nationally even after taking into account the number of units in these tracts that have rents sufficiently modest to meet voucher program standards.[13]
Few Properties With Project-Based Rental Assistance Provide Access to Low-Poverty Neighborhoods
While the HCV program has not increased housing choices to the extent that policymakers may have hoped, it has performed far better than HUD’s project-based rental assistance programs in enabling families with children to live in lower-poverty neighborhoods and avoid extreme-poverty neighborhoods. Relatively few public housing or privately owned units with project-based rental assistance, particularly for families with children, are in low-poverty neighborhoods.[14] In 2010, only 5.6 percent of families with children residing in public housing (some 21,000 families) lived in neighborhoods in which less than 10 percent of residents were poor. A somewhat larger share of families with children that resided in privately owned units with project-based rental assistance — 9.3 percent (some 32,000 families) — lived in low-poverty neighborhoods in 2010.[15] (See Figure 7 above and Appendix Tables 1 and 2 for a more detailed breakdown of where families in these programs live.)
How Federal Rental Assistance Programs Affect the Likelihood That Children Will Live in Extreme-Poverty Neighborhoods
Researchers generally agree that living in neighborhoods of extreme poverty, in which 40 percent or more of the inhabitants are poor, is particularly harmful to children, relative to the impact of growing up in a poor family in a less-poor neighborhood.[16] Such neighborhoods are home to nearly 15 percent of poor children. These neighborhoods are more likely than others also to have high rates of crime and violence, poorly performing schools, and limited opportunities for physical recreation. Few college-educated adults live in these communities,[17] more than half of the children in these neighborhoods live in single-parent households, and fewer than half of the men are employed,[18] compounding the social isolation of attending schools mostly with other poor children and limiting children’s aspirations.
Extreme-poverty neighborhoods are predominantly African American and Latino.[19] The chance of living in a neighborhood where 40 percent or more of the residents are poor is much greater for poor black and Hispanic children (23 and 21 percent, respectively) than for poor non-Hispanic white children (4 percent).[20] The impacts of living in an extremely poor neighborhood may be particularly harmful for children when families live in such neighborhoods for several generations, as occurs more among African American families.[21]
One in Five Children in Neighborhoods of Extreme Poverty Receives Federal Rental Assistance
Some 660,000 children whose families receive federal rental assistance lived in extreme-poverty neighborhoods in 2010.[22] These children constituted nearly a fifth (19.2 percent) of all children living in extreme-poverty neighborhoods. The vast majority of these children — 87 percent — were black or Hispanic.
The project-based rental assistance programs — public housing and privately owned properties with project-based Section 8 subsidies — drive these data. More than a third (35 percent) of family-occupied public housing units and 22 percent of family-occupied, privately owned units with project-based assistance are in extreme-poverty neighborhoods. Two-thirds of the children in families that receive federal rental assistance and live in extreme-poverty neighborhoods are assisted under one of these project-based programs. (The others have Housing Choice Vouchers.)
Vouchers Help Black and Hispanic Families Avoid Extreme-Poverty Neighborhoods
Having a housing voucher substantially reduces the likelihood of living in an extreme-poverty neighborhood. Nevertheless, a quarter of a million children in the HCV program are living in these troubled neighborhoods. This problem exists in nearly every state and in rural as well as urban areas, though it is most prevalent east of the Mississippi and in California. (See Figure 9.)
The distribution of modestly priced rental units does not dictate this result. In 2008, some 89 percent of all rental units with rents below the HUD-set Fair Market Rent (which is used as a standard for the voucher program) were located outside extremely poor census block groups, the closest census measure for neighborhoods. (Each census tract contains about three block groups.)[23] In 2010, when 2.1 million HCVs were in use nationwide, 19.9 million rental units outside extreme-poverty tracts had rents below the Fair Market Rent levels.[24]
This raises the question of whether these families truly are making an informed choice about where to live, or whether a lack of understanding of their options, barriers to “portability,” or other aspects of the program — or refusal of landlords in lower-poverty areas to accept vouchers — are constraining their decisions. (See Section 3 for more on this important question.)
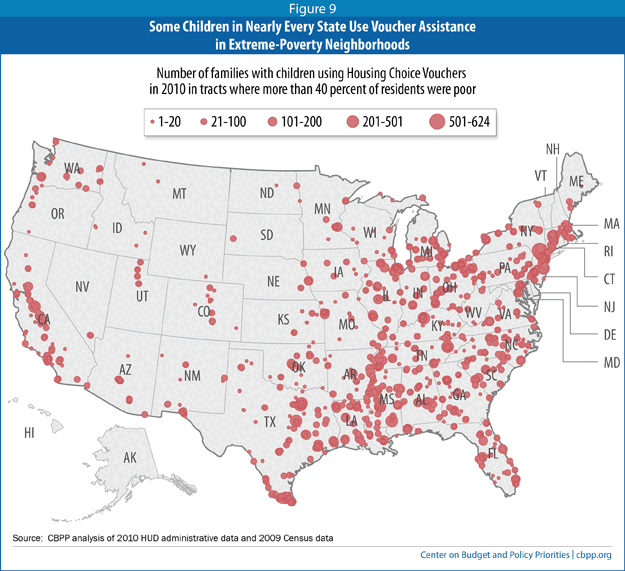
Despite the HCV program’s inadequate performance on this point, vouchers have some impact in helping poor black and Hispanic families with children avoid neighborhoods of concentrated poverty. For these families, having a housing voucher cuts their likelihood of living in extreme-poverty neighborhoods by nearly half for black children and more than a third for Hispanic children, compared with poor children of the same race or ethnicity. (See Figure 10.)
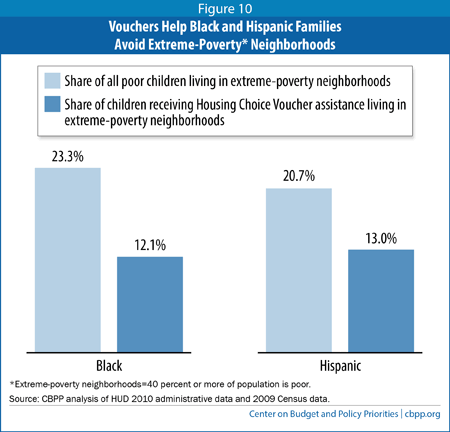
Federal Rental Assistance Programs’ Impact on Access to Better-Performing Schools and Safer Neighborhoods
Census tracts with extreme poverty rates do not necessarily have poor schools or high rates of violent crime — nor do less-poor neighborhoods necessarily lack these conditions. Two recent studies examined the federal rental assistance programs’ performance in helping families move to neighborhoods with lower crime rates and access to high-performing schools, with mixed results.
Access to High-Performing Schools
A discouraging set of findings comes from a recent analysis by Ingrid Gould Ellen and Keren Mertens Horn that examines the likely access of families with children in the various federal housing programs to high- and low-performing schools.[25] Only one in four families with children receiving HCV assistance (25.9 percent) or project-based rental assistance (24.5 percent) — and a still smaller share of public housing families (19.4 percent) — lived near an elementary school ranked in the top half in their state in 2008.
Families receiving each type of rental assistance were less likely to live near a better-performing elementary school, and more likely to live near a school ranked in the bottom 10 percent, than poor families generally.[26] They also were less likely than poor children generally to live near a school where fewer than one out of five students were eligible to receive free or reduced-price school meals, and at least as likely to live near a school where the large majority of children were poor or near poor. (See Table 1.)
In further analysis, the authors estimated that families using HCVs lived near schools that had lower proficiency rates than the schools nearest to other homes with similar rents in the same state and metropolitan area.[27] Residential segregation and low vacancy rates may have made many appropriately priced units near high-performing schools unavailable to families with vouchers, particularly minority families, as the analysis found that these two market constraints correlated with use of vouchers near lower-quality schools.
For minority families, however, using a voucher to rent housing slightly improves the schools that their children are likely to attend, compared with their poor counterparts. The median school nearest to black voucher holders ranked an average of 1.8 percentile points higher on proficiency on standardized math and reading tests than the median school nearest to poor black households generally. The difference for Hispanic families was smaller — an average of .77 percentile points higher — but still statistically significant.[28] This is consistent with the finding discussed above that having a housing voucher improved the neighborhoods in which black families, and to a lesser extent Hispanic families, live.
Looking at location through the lens of access to a well-performing school (rather than simply through the lens of neighborhood poverty) highlights the importance of policy reforms to make the rental assistance programs more effective in enabling families to move to areas with better schools. (Giving families broader access to schools than just the schools closest to them also is important, but lower-income families may be less likely to take advantage of these opportunities.)[29]
Families Use Vouchers to Live in Somewhat Safer Neighborhoods Than Unassisted Poor Renters
Many families that receive housing vouchers prioritize finding a home in a safe neighborhood.A recent study analyzing data from 91 representative large cities in 1999-2001 found that families with vouchers generally succeeded in achieving this goal. Only 4.4 percent of families with vouchers lived in high-crime neighborhoods (i.e., in a neighborhood with a substantially-above-average crime rate), compared with 6 percent of poor renters generally. Exposure to violent crime was somewhat greater: 11 percent of voucher households lived in neighborhoods with high rates of violent crimes.[30] (See Table 2.) On average, families used vouchers in neighborhoods that had a 6 percentage-point lower crime rate than all poor renters in the same cities.[31]
While black families generally, as well as those with vouchers, lived in areas with higher crime rates than other racial or ethnic groups, the study found that having a voucher improved neighborhood safety for black families in particular. In 2000, black families with vouchers lived in neighborhoods where the crime rate was, on average, 81.4 crimes per 1,000 people, significantly lower than for all black renters (88.3) or poor black households (87.5) generally.[32]
A significantly larger share of families in public housing lived in high-crime neighborhoods than did voucher households or poor renters generally. Nearly one of four households living in public housing in 2000 resided in a neighborhood with a high rate of violent crime. On average, public housing households lived in census tracts with 60 percent more crime than in the rest of their cities.[33] The study’s authors conclude that, compared to people in public housing, “households with greater residential choice — vouchers and poor renters — live in neighborhoods with dramatically lower crime rates but with fairly similar poverty rates and racial composition.”[34]
A follow-up analysis by one of the study’s authors found that several differences in housing market characteristics were correlated with differences among the 91 cities in the study in the share of HCV households that resided in neighborhoods where the crime rates were higher than the average rate for all neighborhoods where HCV households lived. The two major factors were the share of all renters (and therefore the stock of rental housing) located in higher-crime areas and the rent differential between lower- and higher-crime neighborhoods. Vacancy rates also seem to play a role.[35] In other words, if a sufficient supply of rental units in lower-crime neighborhoods is available to rent and the cost is within reach of families using HCVs, a larger share of families will use their vouchers to live in safer neighborhoods. We discuss policy changes that would enhance families’ ability to use vouchers in safe neighborhoods in Section 3 of this paper.
Weakened Economy Has Undercut Efforts to Increase Voucher Holders’ Access to Lower-Poverty Neighborhoods Since 2000
Between 2000 and 2010, HUD implemented a number of new policies in the HCV program aimed at increasing access to lower-poverty communities that could provide better opportunities for families. For example, Congress gave agencies additional flexibility to subsidize higher rents and allowed families to pay more than the standard 30 percent of income to rent somewhat more expensive units.[36] In addition, HUD raised its Fair Market Rent levels for highly segregated metro areas and instituted a new performance measurement system that gives some credit to housing agencies that engage in activities to expand housing opportunities.[37]
When the Great Recession set in, however, poverty increased and the number of high-poverty areas grew. This undercut efforts to move more families receiving housing assistance to low-poverty areas. As Table 3 shows, between 2000 (a year with remarkably low unemployment and relatively low poverty) and 2010 (a year with very high unemployment and relatively high poverty), the share of voucher holders living in low-poverty areas edged down, while the share living in high-poverty areas significantly increased.
The share of vouchers used in extreme-poverty neighborhoods, where more than 40 percent of the population is below the poverty line, grew from 6.8 percent to 9.7 percent during the decade. The increase in voucher use in extreme-poverty neighborhoods affected white, black, and Hispanic households alike.[38]
The economy played a large role here: 2010 was a year with a very weak economy and very high unemployment. The average unemployment rate was 9.6 percent, nearly two and a half times the 3.9 percent unemployment rate in 2000.[39] Some 46.3 million people were poor in 2010, an increase of 14.8 million people (or 47 percent) since 2000, when the economy was booming.[40] The dramatic increase in poverty and shifting population patterns resulted in an increase of more than one-third (36 percent) in the number of census tracts where 40 percent or more of the residents were poor.[41] These trends also led to an increase in the share of all rental housing located in extreme-poverty tracts, from 5.2 percent in 2000 to 6.8 percent in 2010.[42]
Conclusion
Policymakers in recent years have increased reliance on housing vouchers to provide rental assistance. Families receiving assistance through the Housing Choice Voucher program — particularly minority families — are more likely to live in lower-poverty neighborhoods, and less likely to live in extreme-poverty neighborhoods, than their counterparts in HUD’s project-based rental assistance programs or than poor children generally. As currently administered, however, the HCV program does not adequately deliver on its potential to expand children’s access to good schools in safe neighborhoods and to enable families to avoid living in neighborhoods likely to adversely impact children’s economic prospects and future health.
HUD can make changes, however, that could significantly improve the ability of families receiving rental assistance to move to lower-poverty, higher-opportunity neighborhoods. Section 3 discusses these policy changes.
End notes:
[1] Since the early 1980s, almost all new units of federal rental assistance Congress has funded have been in the form of tenant-based rental assistance, except for relatively small numbers of units for the elderly, people with disabilities, and homeless individuals. From 1995 through 2012, about 500,000 units of public housing and privately owned assisted housing either were demolished (and not replaced) or ceased to receive federal rental assistance (Center on Budget and Policy Priorities, 2013b; National Housing Trust (2004); CBPP analysis of HUD data on tenant protection vouchers).In the same period, Congress funded nearly 800,000 additional housing vouchers, about 410,000 of which were intended to substitute for a portion of the lost units (CBPP analysis of Congressional and HUD data). For a brief overview of the reasons for the federal policy shift and the range of policy changes adopted, see Galster (2013).
[2] Our analysis found that 15.1 percent of all children in families that received rental assistance in 2010 through HUD’s Housing Choice Voucher, public housing, or Section 8 Project-Based Rental Assistance programs — and 13.4 percent of the poor children in families receiving rental assistance through these programs — lived in low-poverty neighborhoods. Census data show that 14.7 percent of all poor children lived in such low-poverty tracts in 2009.
Approximately one-fifth of poor children live in families that receive rental assistance. Most of the assisted families with children — 70 percent — have incomes below the poverty line. See the Technical Appendix for further discussion of these data.
[3] These findings are based on CBPP analysis of HUD 2010 and 2011 administrative data and of census tract characteristics using 2009 and 2011 Census data. See Technical Appendix.
[4] In the 50 largest metropolitan areas, 23.1 percent of voucher households (of all family types) lived in low-poverty areas. McClure, Schwartz, and Taghavi (2014), Table 5. This analysis also used 2010 HUD microdata and similar Census data as CBPP’s analysis.
[5] For background on these programs, see Center on Budget and Policy Priorities (2013a; 2013b).
[6] Center on Budget and Policy Priorities (2014). The share of households with children is based on 2010 data.
[7] McClure, Schwartz, and Taghavi (2014), using 2010 HUD data in relation to census tracts. McClure (2010) found that in 2008, vouchers were in use in 70 percent of census block groups, which are the closest approximation to “neighborhood” in the census data. Each census tract contains about three block groups. Using 2004 HUD metropolitan-area data, Galvez (2010) found that more than 60 percent of voucher holders lived in neighborhoods where voucher holders made up fewer than 5 percent of residents of the census tract. In the largest metro areas, however, voucher use is more concentrated. In 2010, 24 percent of vouchers in the 50 largest metro areas were used in tracts where at least 10 percent of households used vouchers, compared with 16 percent of vouchers in the largest metro areas in 2000 (McClure, Schwartz, & Taghavi, 2014, Table 2).
[8] In the 50 largest metropolitan areas, 23.1 percent of voucher households (of all family types) lived in low-poverty areas. McClure, Schwartz, and Taghavi (2014), table 4. This analysis also used 2010 HUD microdata and similar Census data as CBPP used in this analysis. Metzger (2014) also analyzes voucher data (from 2008) for the 50 most populous metropolitan areas, in relation to a somewhat different comparison group — households with income below the lower of 30 percent of area median income or $15,000. Looking at voucher holders in the largest metro areas overall (in contrast to our comparison of all families with children by census tract poverty rates, she finds that voucher households were more segregated by race and income than the comparison group of low-income families, with the difference unlikely to be explained by differences in the racial/ethnic composition of the two groups.
[9] Research on the effect of receiving housing vouchers on families that currently or recently received (or were eligible for) benefits under the Temporary Assistance for Needy Families program (conducted as part of the Welfare to Work Voucher Program) found that four years after initially renting housing with a voucher (without any special assistance in their housing search), families lived in neighborhoods with average poverty rates about 2 percentage points lower than comparable families that did not receive housing assistance (Mills et al. 2006). These neighborhoods also had a higher average employment rate, lower average welfare receipt, lower minority concentration, and lower rate of female-headed families. (The large majority of families that initially used vouchers were still receiving voucher assistance at the four-year point.) Families that lived in census tracts where more than 30 percent of residents were poor (in 2000) before receiving voucher assistance experienced greater gains in neighborhood quality, including a 5.8 percentage point reduction on average in the neighborhood poverty rate at the four-year point (Gubits, Khadduri , & Turnham 2009). These figures compare “treatment group” families that initially leased up with a voucher (received as part of the demonstration or independently) to the portion of “control group” families that did not receive voucher assistance during the study period. These estimates adjust for both treatment group non-participation and control group “crossover” (receiving a voucher apart from the demonstration).
[10] The comparison data for 2000 are from McClure, Schwartz, and Taghavi (2014),Table 6. The 2000 data are for all voucher households, not just those with children. The trend over the ensuing decade is likely to be similar. The same authors’ analysis of 2010 data found a slightly lower share of all households in each racial/ethnic group living in low-poverty neighborhoods than CBPP’s findings for families with children.
[11] Carlson, Haveman, Kaplan & Wolfe (2012).
[12] Covington, Freeman, and Stoll (2011) found that the number of people in African American households using vouchers in the suburbs of the 100 largest metropolitan areas increased by 4.8 percentage points between 2000 and 2008, an increase of 12.3 percent. The analysis defines job accessibility as the ratio of people aged 21-64 to total jobs in the same zip code. The positive trend that the authors found as of 2008 in the share of suburban minority voucher holders living in high-income and/or high job access areas may not have continued, given the significant increase by 2012 in the number and share of poor families living in extremely poor suburban neighborhoods (Kneebone, 2014), which in turn reflected at least in part the increase in poverty between 2008 and 2012 that caused the number of high-poverty neighborhoods to increase.
[13] Schwartz’s and McClure’s (2014) analysis used five variables to develop a neighborhood distress index based on Census data from 2009: poverty rate, percent of female-headed households, unemployment rate, percent of households receiving public assistance, and percent of young adults not in school and without a high school diploma.
[14] For background on these programs, see Center on Budget and Policy Priorities (2013a and 2013b).
[15] In contrast to HUD’s older project-based rental assistance programs, 22.6 percent of Low-Income Housing Tax Credit (LIHTC) units were in areas with less than 10 percent poverty in 2010. McClure and Johnson (2014). This analysis included all units that were developed or rehabilitated using LIHTCs as of 2010, not just those that housed families with children. LIHTC units typically are not affordable to poor families without additional rental assistance, and most of the LIHTC units with rental assistance are included in the data we report above on the share of families with rental assistance who live in areas with various rates of poverty.
[16] See, e.g. Jargowsky (2013) and Kneebone, Nadeau, and Berube (2011). See Box 2concerning the use of different poverty thresholds to analyze concentrated poverty.For more on these research findings, see Section 1 of this paper.
[17] In extremely poor census tracts in the 100 largest metro areas, only one of ten adults aged 25 or older has a college degree (compared with about one in three in the population as a whole) and about one-third of working-age males in these census tracts were not in the labor force in the latter part of the last decade. Kneebone, Nadeau, & Berube (2011), Table 8.
[18] Jargowsky (2013), based on Census 2000 data.
[19] More than three-quarters of extreme-poverty census tracts are more than half minority (Affirmatively Furthering Fair Housing, 2013).
[20] 2009 Census data. See Technical Appendix.
[21] Analyzing data from the Panel Study of Income Dynamics, Sharkey (2013) found that only 1 percent of white children born between 1955 and 2000 were raised in high-poverty neighborhoods (where more than 30 percent of residents were poor), while nearly one-third of black children were. Moreover, of the children who were raised in the poorest quartile of neighborhoods, 67 percent of the black children remained in the poorest neighborhoods as adults, while 40 percent of the white children did. In addition, Sharkey found evidence suggesting that the neighborhoods in which parents grew up were at least as important to the development of their children’s cognitive skills as the child’s immediate neighborhood. Children who received a “double dose” of poverty — that is, where the parents, as well as the child, grew up in poor neighborhoods — scored significantly lower on cognitive tests than those who either received a “single dose” or whose families never lived in poor neighborhoods.
[22] CBPP analysis of HUD 2010 and 2011 microdata. The large majority of the HUD-assisted families living in census tracts with poverty rates of 40 percent or more (about 80 percent) have incomes below the poverty line. Census data for the five years ending in 2012 indicate that the number of people living in tracts where more than 40 percent of the residents are poor increased by nearly 3 million, compared with the multi-year data used in this analysis, which end in 2009. It is likely, given this trend, that the share of assisted families with children in extreme-poverty neighborhoods also increased over this period. This likely reflects at least in part the deterioration in incomes due to the Great Recession and the anemic recovery through 2012. See Jargowsky (2014).
[23] In 2008, 11 percent of all rental units with rents below the HUD-set Fair Market Rent (FMR) — and 9 percent of all HCVs — were located in extremely poor census block groups. McClure (2010) Exhibit 6. (At about the same time, 6.8 percent of all rental units were located in extremely poor census tracts (McClure & Johnson, 2014)).
[24] McClure, Schwartz, & Taghavi (2014), Table 1.
[25] Ellen and Horn (2012) analyzed the proximity of families with children to elementary schools within their zoned school district, not actual attendance, due to the unavailability of national data on children’s school attendance. Approximately three-fourths of children attend their neighborhood school (Blad, 2014, quoting Richard Kahlenberg, Century Foundation education expert).
[26] Of note, the study suggests that the LIHTC program provides families with children slightly better access to higher-performing schools than poor families otherwise would have (though many LIHTC families have incomes substantially above the poverty level and above the income of HCV families).
[27] Horn, Ellen, and Schwartz (2014) assigned a proficiency rate to each metropolitan census tract based on the performance of students in the elementary school nearest the center of the tract, specifically the percentage of fourth grade students in that school deemed proficient on state exams in mathematics and English language arts. They weighted each tract proficiency rate by the tract’s share of the metropolitan-area rental units in the state that had two or more bedrooms and rented below HUD’s Fair Market Rent. (As the Census data do not report the number of units in a census tract renting below Fair Market Rent — and report unit rent data in ranges that don’t correspond directly with HUD’s FMRs — the authors created an estimate of that number by assuming an even distribution over the census tract of rental units within each rent category.) This analysis found that families with vouchers lived near schools that, on average, had a lower proficiency rate (by 3.58 percent, a modest but statistically significant difference) than schools nearest to units with similar rents.
[28] Horn, Ellen, & Schwartz (2014), Table 5.
[29] Research by Teske et al. (2007) in three cities with well-developed school choice policies (Washington D.C., Milwaukee, and Denver) found that among families with annual incomes below $50,000 that had considered whether to send their children to the closest zoned public school or to another school, families with incomes below $10,000 were more than twice as likely (42 percent) as families with incomes between $40,000 and $50,000 (20 percent) to rank proximity to home as the “most important” or a “very important” factor in their choice of school. Almost 60 percent of the parents with a high school education or less in the study, regardless of income, made their school choice only on the basis of location.
[30] Lens, Ellen, & O’Regan (2011). The 91 cities studied were representative of cities with more than 100,000 people. The researchers define a “high-crime” neighborhood as a census tract with a crime rate more than one standard deviation above the mean. Only 15 percent of the crimes included in this definition are violent; most are property crimes, particularly theft. The study included all types of voucher households, not just families with children. Crime exposure rates for families with children were “only very slightly lower than those for households without children, and the difference was not statistically significant” (p. 148).
[31] Lens (2013), Exhibit 3. Nonetheless, families with vouchers are about 50 percent more likely to live in higher-crime neighborhoods than the general population (p. 149). Some have asserted that this is because families moving with a voucher bring crime with them. See, e.g., Rosin (2008). A careful analysis of this question in ten large cities found that the correlation of higher crime with the presence of more voucher holders disappears after controlling for other neighborhood characteristics and crime trends in the broader sub-city area. (Ellen, Lens, & O’Regan, 2012).
[32] Lens, Ellen, & O’Regan (2011),Exhibit 6.
[33] Lens, Ellen & O’Regan (2011); Lens (2013).
[34] Lens, Ellen & O’Regan (2011), p. 147.
[35] Lens (2013).
[36] The Quality Housing and Work Responsibility Act of 1998 merged the housing certificate and housing voucher programs into a single program. Under the new housing voucher program, housing agencies for the first time were given some discretion to set subsidy caps above the HUD Fair Market Rent. (Congress had previously enacted a more modest policy change to accomplish a similar result, but HUD did not implement it. FMR policies are discussed in the next section.) In addition, all households were given the option to pay more than 30 percent of income for rent and utilities, though Congress limited the permissible rent burden for new program participants and families moving to new units to 40 percent of adjusted income. Previously, only the minority of families with vouchers, but not the majority with certificates, were permitted to rent a unit in which the family’s share of the rent and utility costs would exceed 30 percent of income. HUD completed the merger of the two programs and fully implemented the new subsidy and rent rules in 2001.
[37] These policy changes are discussed in Section 3.
[38] Over the decade 2000-2010, the share of white voucher households living in neighborhoods where more than 40 percent of residents were poor increased from 2.3 percent to 6.7 percent, the share of black voucher households in such neighborhoods rose from 10.2 percent to 12 percent; and the share of Hispanic voucher households in such neighborhoods edged up from 10.5 percent to 10.9 percent (McClure, Schwartz, and Taghavi, 2014, Table 6).
[39] Federal Reserve Bank of St. Louis (2014).
[40] U.S. Bureau of the Census (2013).
[41] Kneebone, Nadeau, & Berube (2011).
[42] McClure and Johnson (2014), Table 6.
Section 3: Improving Outcomes for Children
in HUD's Rental Assistance Programs
Where families live largely determines the quality of schools that children attend, whether it is safe for children to play outside, and the ease of obtaining fresh and reasonably priced food and other basic goods and services. Location also can affect adults’ access to jobs, the cost of getting to work, and the feasibility of balancing child-care responsibilities with work schedules.[1] In addition, as the first section of this paper explains, a growing body of evidence indicates that high-poverty neighborhoods can have negative long-term impacts on health and well-being as well as on intergenerational economic gains.
While the Housing Choice Voucher program has been successful at reducing families’ housing cost burdens and homelessness and increasing housing stability,[2] its performance on location outcomes has been disappointing. Vouchers currently do less than they could to help families live in low-poverty, high-opportunity neighborhoods.
Based on the evidence on how housing location affects low-income families, particularly children, and the performance of federal rental assistance programs using location-related measures, we recommend two related near-term goals for federal rental assistance policy. In the next several years, federal rental assistance programs should provide:
- greater opportunities for families to choose to rent affordable housing outside of extreme-poverty neighborhoods (that is, in neighborhoods where less than 40 percent of residents are poor); and
- greater access for families to low-poverty, safe communities with better-performing schools.
Policymakers and program administrators can make substantial progress toward these goals in the next few years, even in the current fiscally constrained environment and even without congressional action or more funding. Federal, state, and local agencies can make policy changes that will help more families in the Housing Choice Voucher (HCV) program to live in better locations by:
- Creating strong incentives for state and local housing agencies to achieve better location outcomes;
- Modifying policies that discourage families from living in lower-poverty communities;
- Minimizing jurisdictional barriers to families’ ability to live in high-opportunity communities; and
- Assisting families in using vouchers to rent in high-opportunity areas.
More than 700,000 low-income families with children are able to afford housing through assistance from HUD’s other major rental assistance programs: public housing and privately owned housing with Section 8 Project-Based Rental Assistance (PBRA). About 200,000 of these families live in an extremely poor neighborhood. Most of those neighborhoods are also predominantly minority. It will be more difficult to improve location outcomes in the public housing and PBRA programs, given their place-based nature. HUD has begun two programs, however, that, over time, may help more families — including families now in public or PBRA housing — live in neighborhoods with more opportunity: the Choice Neighborhoods Initiative and the Rental Assistance Demonstration.
This focus on enhancing families’ ability to choose to move to areas with more opportunities for their children (or to remain in affordable housing in lower-poverty, high-opportunity neighborhoods) does not imply that policymakers should not pursue broader strategies to increase incomes, enhance safety, and improve educational performance in very poor areas. But the unfortunate reality is that we know relatively little about what types of interventions are effective on a substantial scale at transforming extremely poor, disadvantaged neighborhoods.[3] Moreover, broader economic development and revitalization strategies often take many years to implement and can be costly.[4]
Recommendations: Realizing the Housing Choice Voucher Program’s Potential to Enable Families to Access Higher-Opportunity Neighborhoods
While the Housing Choice Voucher program has been successful at helping families meet their basic housing needs, its performance on location outcomes has fallen short, as Section 2 of this paper explains.
That more families do not use their vouchers to reside in low-poverty neighborhoods reflects, at least in part, the constraints families face in using vouchers to access neighborhoods that provide greater opportunities.[5] Some families want the stability of remaining in their current neighborhoods or close to support networks and current jobs. But many families are largely unaware of opportunities in unfamiliar neighborhoods and might make different choices if they had more information.[6] Many also need assistance from program administrators to identify landlords who are willing to accept vouchers in communities where vouchers are infrequently used and rental vacancies are low. In addition, voucher subsidy caps are often too low to enable families to afford units in high-opportunity areas, and other program policies can limit voucher holders’ available choices.
Current federal policy essentially assumes that having a housing voucher opens up the choice of units to rent just like added income would and that poor families are aware of the housing options that a voucher makes available. But as researchers Stefanie DeLuca, Philip Garboden, and Peter Rosenblatt concluded, “the ‘free market choice’ assumptions behind the HCV program do not hold in reality.”[7] It is up to administering agencies to decide whether and how to address families’ needs for assistance in the search process.[8] Agencies that ignore the need for housing search assistance or have ineffective or counter-productive policies are at virtually no risk of HUD sanction.[9]
A limited supply of moderately priced rental units in low-poverty, non-racially concentrated neighborhoods is a significant constraint in some cities and counties.[10] But most metro areas have a sufficient supply of rental units to enable a much larger share of families to use their vouchers to rent units in areas that would likely be better for their children, if they could overcome knowledge and access barriers. One-third of all metropolitan rental units — and more than a quarter of all metropolitan units with rental charges below HUD’s Fair Market Rents — are located in neighborhoods with a poverty rate of less than 10 percent.[11]
Public housing agencies have flexibility under current federal requirements to implement strategies in their Housing Choice Voucher programs to improve location outcomes, and state and local governments could facilitate these efforts.[12] But without changes in federal policy to encourage state and local agencies to take such steps and to modify counter-productive policies — and reliable funding to maintain the number of families receiving HCV assistance and to administer the program effectively — there is little reason to expect better results.[13]
Federal, state, and local agencies can make four sets of interrelated policy changes that will help families in the HCV program live in better locations. (See Figure 11.) HUD could make the federal policy changes in the first three of these areas without congressional action, modifying the incentives both for administering agencies and program participants and reducing barriers to moving to higher-opportunity areas.
- Create strong incentives for local and state housing agencies to achieve better location outcomes. Federal policy should provide incentives for agencies to reduce the share of families using vouchers in extreme-poverty areas and increase the share residing in low-poverty, high-opportunity areas. HUD could do this in three ways: by giving added weight to location outcomes in measuring agency performance, reinforcing these changes with a strong fair housing rule — the rule that will revise HUD grantees’ planning for how to achieve outcomes that further fair housing goals — and rewarding agencies that help families move to high-opportunity areas by paying these agencies additional administrative fees.
- Modify policies that discourage families from living in lower-poverty communities. Various HCV program policies impede families from moving to low-poverty areas and thereby unintentionally encourage families to use their vouchers in poor neighborhoods that often are highly racially concentrated. (Most extremely poor neighborhoods are predominantly African American and/or Latino.) HUD should finalize its proposed rule on public housing agencies’ fair housing obligations. It also should set its caps on rental subsidy amounts for smaller geographic areas than it now does, and — at least where necessary to help families move from extreme-poverty, highly racially concentrated neighborhoods to higher-opportunity communities with less poverty — require agencies to identify available units in these lower-poverty communities and extend the search period for families seeking to make such moves.
- Minimize jurisdictional barriers to families’ ability to choose to live in high-opportunity communities. HUD should modify the HCV program’s administrative geography to reduce the extent to which the boundaries of housing agencies’ service areas impede the program’s ability to promote access to higher-opportunity neighborhoods. HUD could substantially lessen these barriers by encouraging agencies in the same metropolitan area to unify their program operations and by simplifying “portability” procedures.
- Assist families in using vouchers to live in high-opportunity areas. To expand housing choices in safe, low-poverty neighborhoods with well-performing schools, state and local governments and housing agencies should adopt laws that prohibit discrimination against voucher holders. They should also adopt policies — such as limited, carefully targeted tax incentives — to expand participation by landlords in these neighborhoods in the HCV program and to encourage interested families to use their vouchers in these areas. Such assistance for families could include financial incentives to offset the additional costs of moving to high-opportunity areas, mobility counseling, and programs to expand access to cars and other transportation to and from these areas.

Create Strong Incentives for Housing Agencies to Achieve Better Location Outcomes
By creating strong incentives for local and state housing agencies to reduce the share of families using vouchers in extreme-poverty areas and increase the share of families living in high-opportunity areas, HUD can encourage the development of local policies and strategies that respond best to varying local conditions.
- Give increased weight to location outcomes in measuring agency performance. HUD’s most powerful tool to induce state and local housing agencies to change their administrative practices is how it measures the effectiveness of agencies’ management of the HCV program. HUD should revise its measurement tool, called the Section 8 Management Assessment Program (SEMAP), which was first issued in 1998 and is largely unchanged, to give more significant weight to the types of neighborhoods in which voucher holders live. SEMAP scores are important to housing agencies because they can affect whether agencies qualify for additional HUD funds or administrative flexibility, and some local agencies take these scores into account in managers’ performance reviews and pay determinations. Agencies that perform particularly poorly on any single indicator or overall are subject to corrective action procedures, and they can lose their HCV contract with HUD if they do not remedy the problems.
Currently, less than 4 percent of the total points available under SEMAP are based on agencies’ use of administrative practices that “expand housing opportunities.” A similar number of bonus points are available to agencies in metropolitan areas that increase by at least 2 percent the share of HCV families with children living in “low-poverty” areas, but only a small share of agencies claim those bonus points.[14] In addition to revising the performance measure to give more weight to location outcomes, HUD also should refine the particular location measures it uses.[15]
To persuade more landlords in higher-opportunity areas to do business with them, agencies will also have to administer their voucher programs competently, such as by making prompt payments to owners and conducting inspections efficiently.[16] As a result, basing the measurement of agencies’ performance in significant part on their success in enabling more families to live in these areas also should encourage improved overall program management. - Reinforce performance measures by issuing a strong fair housing rule. All public housing agencies administering the HCV program (as well as HUD) have an affirmative obligation to further the purposes of the Fair Housing Act, known as the “AFFH” duty. In 2013, some 45 years after Congress established this obligation, HUD finally issued a proposed rule to indicate what steps agencies must take to meet their AFFH obligation.[17] The Administration should finalize this rule and provide greater clarity in it about the rule’s applicability to the HCV program, the obligation of grantees to consider regional strategies (which HUD defines as collaborations between two or more local agencies or jurisdictions), and the consequences of inadequate compliance by state and local housing agencies. A strong AFFH rule (and related planning and reporting materials from HUD) would complement a revised and strengthened performance measurement system that emphasizes increasing access to higher-opportunity areas; black or Hispanic families make up most of the assisted families in extreme-poverty areas and are less likely than white assisted families to live in low-poverty areas (see Figure 12 below and Appendix Table 2).[18] It also could help PHAs receive assistance from other agencies in achieving these goals (see further discussion of this point below).
- Pay agencies additional administrative fees when families use their vouchers in high-opportunity areas. A federal policy that financially rewards agencies when families use their vouchers in high-opportunity areas is particularly important in the case of families for which such moves can be especially challenging, such as minority families coming from communities that are highly segregated by income and race or ethnicity. HUD expects to complete this year a major analysis of the costs of running a well-administered voucher program; based on that analysis, it is likely to recommend a new policy for determining how to allocate administrative fees to agencies. Location-based payments could be incorporated either as a component of the new formula or as a bonus or supplemental fee payment.[19]
Modify Policies That Discourage Families From Living in Lower-Poverty Communities
Many HCV program policies at both the federal and local levels — such as metropolitan-wide maximum rental subsidy levels and limits on the time to find a rental unit — unintentionally encourage families to use their vouchers in poor and often racially concentrated neighborhoods. Combined with a final rule on PHAs’ obligation to affirmatively further fair housing, revising the federal policies as outlined below could encourage PHAs to adopt payment standards and search-time policies, and to maintain landlord lists, that would facilitate families moving to higher-opportunity areas.
- Set subsidy caps for smaller geographic areas. HCV rental subsidies are capped by a payment standard that the local housing agency sets, which generally can vary by only 10 percent from the Fair Market Rent (FMR) that HUD establishes based on the cost of modest housing over an entire metropolitan area. Payment standards based on metro-wide FMRs are often too low to rent units in neighborhoods with low poverty, low crime, and strong schools unless families pay out of pocket the extra rent above the payment standard — a difficult burden for many families that already must pay 30 percent of their limited incomes for rent.[20] At the same time, metropolitan FMRs often result in payment standards that are higher than necessary in areas of concentrated poverty, allowing families to rent larger units in those neighborhoods and potentially allowing owners to charge above-market rents (unless agencies strictly enforce rules requiring that rents be reasonable in the local market).[21] As a result, metropolitan-wide FMRs likely encourage the use of vouchers — and their acceptance by owners — in poor, unsafe neighborhoods with low-quality schools. [22] HUD is currently testing, through a limited number of local housing agencies, “Small Area Fair Market Rents” (SAFMRs), which are based on market rents in individual zip codes rather than rents over an entire metro area. Early results suggest that SAFMRs more adequately enable voucher holders to rent units in neighborhoods with better schools, more college graduates, and less violent crime, poverty, and unemployment — and do so without raising program costs.[23] By being more responsive to local price trends, SAFMRs also may help families rent better-quality units and remain in improving neighborhoods as rents rise. HUD should move promptly to scale up the use of SAFMRs, starting by requiring their use in metropolitan areas where voucher holders are disproportionately concentrated in high-poverty neighborhoods.[24]
- Provide voucher holders with information on units in high-opportunity neighborhoods. Many housing agencies influence families’ neighborhood choices through the lists they give families of landlords willing to rent to voucher holders. (HUD requires agencies to provide a list of willing landlords in the information packet they provide to new families that are issued vouchers.) But unless the agency makes an intentional and potentially time-consuming effort to solicit listings from landlords in lower-poverty areas, it is likely that many of the landlords who reach out to the agency will list units that are otherwise difficult for them to rent, particularly units in very poor neighborhoods where families often have trouble paying rent on time each month unless they have a rental subsidy.[25] HUD should, at a minimum, require that PHA-provided housing lists include units in a broad range of neighborhoods, including low-poverty areas that don’t have a high concentration of voucher holders or other assisted housing and would provide options for families to live in racially diverse communities.[26] To help “change the default” for families that come from segregated, high-poverty areas, HUD could require agencies to list most prominently the available units in high-opportunity areas.[27]
- Extend search periods when families need more time to find units in high-opportunity neighborhoods. Inflexible limitations on the amount of time that a family given a voucher has to find a unit meeting program requirements can also discourage families from searching for housing in neighborhoods that are harder for them to get to and/or where fewer landlords accept vouchers.[28] While federal rules require agencies to give households 60 days to lease a unit with their voucher, they permit (but do not require) agencies to allow additional time.[29] HUD could provide more guidance or could modify its rule on the amount of additional time that families have to search with a voucher by requiring PHAs to extend the search time if a family requests an extension to find a unit in a low-poverty area. HUD should also consider requiring such extensions when minority families are seeking to move to an area where their race does not predominate. In these cases, this would “affirmatively further” fair housing.
Minimize Jurisdictional Barriers to Families’ Ability to Choose to Live in High-Opportunity Communities
HUD should modify the administrative geography of the HCV program to substantially reduce the extent to which agencies’ service areas (or “jurisdictions”) impede the program’s ability to promote access to higher-opportunity neighborhoods. In most metropolitan areas, one agency administers the HCV program in the central city and one or more different agencies serve suburban cities and towns. This pattern is the case in 95 of the 100 largest metro areas, where 78 percent of households in the HCV program lived in 2012. In 29 of the 100 largest metro areas, voucher administration is divided among ten or more agencies. This is the case even in mid-size areas such as Providence, Rhode Island, and Albany, New York, each of which has 36 agencies administering the HCV program.[30]
Rental units in safe neighborhoods with good schools may be more plentiful in suburban areas than in the central cities, which are more likely to have higher-poverty neighborhoods with failing schools, but the balkanization of metro-area HCV programs among numerous agencies often impedes greater use of vouchers in the higher-opportunity areas.[31] Agency staff may be unfamiliar with housing opportunities outside of their jurisdiction and are unlikely to assist families to make such moves. Some landlords may be reluctant to do business with an unfamiliar housing agency.
Overcoming these administrative divisions is challenging, and the difficulties are exacerbated by cumbersome federal policies that make it more difficult for families coming from the central city or poor suburban areas to use their vouchers to lease housing in low-poverty suburban areas with better schools, as well as by financial disincentives for housing agencies to encourage such moves. HUD could substantially lessen these barriers by encouraging (or in limited circumstances requiring) agencies administering the HCV program in the same metro area to unify their voucher program operations, as well as by simplifying the procedures for families who want to use their vouchers in another agency’s jurisdiction.
- Encourage agencies to form consortia or consolidate. If PHAs in a metro area could at least form a consortium in which they each retain their local board but together have a single voucher funding contract with HUD, families would be able to use their vouchers to move seamlessly within the cities and towns in the consortium.[32] Under HUD’s current rules, however, agencies have little incentive to form consortia, and when they do, they still don’t have a single funding contract with HUD.[33] HUD recently proposed to revise its consortia rule to allow all agencies in a consortium to have a single funding contract with HUD.[34] HUD should finalize this rule promptly and include funds to assist agencies in forming consortia in its fiscal year 2016 budget.
- Strengthen HUD’s performance assessment tools and its use of certain remedies in response to poor performance. HUD has the authority to require consolidation when an agency is not administering the HCV program effectively, even if a state or local law limits the geographic area of agency operation.[35]
- Simplify “portability” procedures. When families want to use their vouchers to rent housing in an area served by a different agency than the one that issued the voucher, the new agency may require families to go through repetitive procedures to affirm their eligibility. These extra steps reduce the amount of time families have to search for housing and may result in rejection by the new agency despite the initial agency’s approval. If families succeed in using their vouchers in different jurisdictions, both agencies involved usually receive lower fees (due to the requirement to split the administrative payments) and typically incur higher costs (due to the transfer of paperwork and funds between the agencies).[36] HUD should simplify the “portability” procedures for families that seek to use their vouchers in another agency’s jurisdiction, in order to reduce both the barriers for families to make such moves and the administrative burdens that such moves can entail for agencies.[37]
Assist Families in Using Vouchers in High-Opportunity Areas
The various policy changes described above, which are within the control of HUD and the state and local housing agencies that administer the HCV program, would likely make a significant difference in expanding families’ ability to use vouchers to access safer neighborhoods that provide better opportunities. But additional help may be needed from state and local governments and private funding sources to overcome some of the most serious barriers to families using their vouchers to access high-opportunity neighborhoods.[38] This is most likely to be the case in areas where efforts to recruit landlords in such neighborhoods to participate in the program are unsuccessful or where too few rental options exist. In addition, experience from a number of local mobility programs indicates that more black and Hispanic families will succeed in moving from low-income, racially segregated areas to high-opportunity, predominantly white neighborhoods if they receive intensive assistance.[39] Key strategies include the following initiatives:
- State and local governments should adopt policies to encourage landlords in low-poverty areas to accept housing vouchers. For example, to encourage more landlords in low-poverty areas to rent to families with housing vouchers, Illinois enacted a property tax abatement in 2003 for landlords that rent units in low-poverty areas within prosperous communities to voucher holders.[40] States also could encourage developers to build in high-opportunity communities with a scarcity of moderately priced rental housing and to rent a share of the units to voucher holders, by giving such properties extra points in the highly competitive process to receive Low-Income Housing Tax Credit (LIHTC) awards. (See Box 4 for more examples of how LIHTC policy could increase the availability of high-opportunity housing choices for voucher holders.)
- Enact state or local laws prohibiting discrimination against voucher holders. Such laws may make more rentals in lower-poverty and less racially segregated neighborhoods available to voucher holders. Thirteen states and numerous cities and counties have enacted such laws, usually as part of legislation that also prohibits landlords from discriminating against people who rely on TANF or Supplemental Security Income benefits to pay the rent. Recent studies found that such laws increased the percentage of people who successfully lease a unit with a voucher by between 5 and 12 percentage points and made a modest improvement in location outcomes compared with adjacent areas without an anti-discrimination law.[41]
- Provide mobility counseling to help families move to and remain in high-opportunity neighborhoods. There have been efforts in some metro areas to provide intensive “mobility counseling” to families that want to move to lower-poverty neighborhoods.[42] (Some of these programs originated from fair housing lawsuits and require that destination neighborhoods be predominantly white.) Programs in the Baltimore and Dallas areas have reported significant success in moving substantial numbers of families to much lower-poverty, predominantly non-minoritycommunities.
These initiatives provide families with assistance in locating available units, higher rental subsidy levels, payments for security deposits and other moving costs, and counselling to help them adjust to such neighborhoods. They provide similar services to families for at least one subsequent move to help them remain in designated opportunity areas.[43] These programsoperate on a regional basis covering at least the central city and many suburban areas, thereby avoiding the barriers created by separate agency service areas.[44] Similar to the experience of families that moved to suburban areas under the Gautreaux program in Chicago, two-thirds of whom continued to reside in middle-class suburban neighborhoods 15 years later (discussed in Section 1 of this paper),[45] it appears that a larger share of families that have moved to high-opportunity areas as a result of these initiatives have chosen to remain in lower-poverty, racially integrated neighborhoods than was the case for families that participated in HUD’s Moving to Opportunity demonstration. In a Baltimore program that includes mobility counseling, for example, the average poverty rate for the neighborhoods in which the families whom the program aided lived over the ten years following their initial move was 14.6 percent, compared with 30.2 percent pre-move. In contrast, the comparable average neighborhood poverty rate over a 10-year period for MTO families that initially moved to low-poverty areas, weighted based on the length of families’ residence, was 21 percent.[46]
Qualitative research on a sample of families that moved to suburban areas through the Baltimore program highlights the change in families’ location-related priorities after they moved, including placing a higher value on high-quality schools.[47] As discussed earlier, longer stays in low-poverty neighborhoods are associated with improved educational results for children and better employment results for mothers.
Unfortunately, there has been no rigorous evaluation of the impact or cost-benefit ratio of particular features of mobility-promoting programs.[48] One study now underway in the Chicago area is testing the impact of mobility counseling coupled with a $500 incentive payment if a family moves to a designated opportunity area, compared to just the incentive payment and to neither intensive services nor an incentive, with results due in 2015.[49] It is important to learn more about what types of incentives and services have the greatest effect under varying local conditions. HUD should encourage such knowledge-building.
In addition, if recent federal underfunding of housing agencies’ costs of administering the HCV program continues, agencies will likely need supplemental funds if they are to provide meaningful mobility counseling services. Some HUD funds that go to states and localities, including Community Development Block Grant (CDBG) funds, as well as limited federal housing counseling and fair housing funds that are available on a competitive basis to non-profit agencies, could be used for this purpose.[50] States and localities also could use other funds they control to assist housing agencies in providing these services. Philanthropy (through such mechanisms as community foundations) also could play a significant role in helping to provide initial funding for mobility programs and in supportingthe research necessary to build knowledge about the most cost-effective strategies. The results of such research might also help agencies obtain subsequent funding from state or local governments by providing a greater knowledge base on what works and is most cost efficient. - Expand access to cars to help families use vouchers in low-poverty areas. Access to a functional car or having a driver’s license appears to help families use vouchers in low-poverty, safer neighborhoods initially and for longer periods of time. Cars make the search for housing easier, particularly in neighborhoods not well served by efficient public transit. Having a car also facilitates access to jobs — either in the old neighborhood or near the new one — and makes it easier to maintain connections to social networks in families’ former neighborhoods. For all of these reasons, families with reliable access to cars may be more willing and able to use housing vouchers to move to and remain in low-poverty neighborhoods. Programs to help families own cars or use short-term rental car services that are targeted specifically on families with housing vouchers, or that help low-income families generally, could be a useful adjunct to the housing-focused policies we recommend.[51]
Box 4: Low-Income Housing Tax Credit Could Do More to Provide Access to High-Opportunity Areas
The Low-Income Housing Tax Credit (LIHTC), the nation’s main program to develop affordable housing, is a potentially powerful tool to provide poor families access to high-opportunity areas. But LIHTC has performed inadequately in this respect. On average, LIHTC units large enough for families with children are near schools that score at the 31st percentile on standardized tests.a This is better than the average for schools near the homes of poor families or voucher holders with children, but leaves much room for improvement, given that the majority of LIHTC residents (in states with available data) have incomes above the poverty line.b (Families are eligible for LIHTC units if their income is below 60 percent of the median income for the area, which is about 200 percent of the federal poverty line.)
While some of the state agencies that allocate LIHTC credits encourage development in high-opportunity areas, states could do substantially more. For example, states can establish selection preferences for projects in low-poverty areas or near high-performing schools and can limit preferences for high-poverty areas to those where a comprehensive revitalization effort is underway. States can also eliminate barriers to using LIHTC in high-opportunity areas, such as rigid cost caps that block projects when land costs are high (as well as requirements that local officials or state legislators approve the award of credits to build a property in a particular location).c
The federal government should ensure that non-discrimination requirements — including the obligation of recipients of federal funds to “affirmatively further” fair housing and the obligation of LIHTC properties not to discriminate against families with Housing Choice Vouchers — are applied to LIHTC and strictly enforced. HUD can also influence the location of LIHTC developments through its authority to designate Difficult Development Areas (DDAs), areas with high land and construction costs where projects are eligible for added credits. Today, HUD designates a small number of metropolitan areas as DDAs, including both low- and high-cost neighborhoods within those areas. But beginning in 2016, HUD will set DDAs at the zip code level, a promising measure that will provide added credits in high-cost (and often high-opportunity) neighborhoods in most major metropolitan areas.
HUD and state agencies also should move promptly to make data on the income, race, and family composition of tenants in each LIHTC development available so policymakers and the public can better assess LIHTC’s effectiveness in furthering key goals, including providing poor families with children access to high-opportunity neighborhoods. There are no national data available on the families assisted by LIHTC, a striking omission for a low-income program that has operated for 27 years and helps develop about 100,000 units each year. In 2008, Congress directed state agencies to submit data on LIHTC tenants and HUD to publish the data annually. HUD and state agencies have worked to develop a data collection system but have not yet released any data.
a Ellen & Horn (2012).
b O'Regan & Horn (2013).
c Khadduri (2013b).
Expanding Access to Higher-Opportunity Areas in HUD’s Project-Based Rental Assistance Programs
More than 700,000 low-income families with children are able to afford decent housing by living in public housing or privately owned properties that HUD subsidizes. Generally, these families cannot move without losing rental assistance. For about 200,000 of these families, having an affordable place to live entails living in an extremely poor neighborhood — one where 40 percent or more of the residents have incomes below the poverty line. (See Appendix Table 1.) Most of these neighborhoods are also predominantly minority.[52] Almost all of these families are racial or ethnic minorities: only 6 percent of the public housing families in extremely poor neighborhoods, and only 7 percent of families in privately owned assisted properties in such neighborhoods, are non-Hispanic white. (See Figure 12.)

Recognizing the adverse impact of growing up in very poor neighborhoods, the Obama Administration has initiated a multi-faceted strategy, the Promise Zones Initiative, that could help revitalize some of the neighborhoods in which HUD-assisted properties are located. But its scale is small; only 20 sites with no more than 200,000 residents per site are planned over three years, and Congress is unlikely to provide substantial new resources for this initiative.[53] (In addition, the initiative may end up focusing on areas with more potential for major change than many of the extremely poor neighborhoods in which many HUD-assisted properties are located.[54])
Two HUD Initiatives Hold Potential to Reduce Harm
Two HUD programs — the Choice Neighborhoods Initiative and the Rental Assistance Demonstration — may be of more short-run benefit to children living in HUD-assisted properties in extremely poor neighborhoods if Congress provides sufficient funds and HUD and local partners implement the programs effectively.
Choice Neighborhoods Initiative Is Promising, but Relocation Counseling Should Be Enhanced
The Choice Neighborhoods Initiative (CNI), which began in 2010, aims to rebuild severely distressed public housing and privately owned assisted properties and to transform the distressed neighborhoods in which they are located into “sustainable mixed income neighborhoods with appropriate services, schools, public assets, transportation, and access to jobs.”[55] The program’s comprehensive approach is based on the lessons learned from earlier efforts under the HOPE VI public housing revitalization program, which were primarily housing-focused, did not lead to improved economic or educational results for families, and often failed to revitalize neighborhoods around the replacement properties.[56] By the end of June 2014, HUD had awarded planning grants to 56 communities and implementation grants to 12. The total number of implementation grants will probably rise to 15 when HUD awards the $90 million that Congress provided for this program in 2014.
Because, under HOPE VI, few original residents returned to the rebuilt mixed-income properties, the program’s principal impacts on them resulted from relocation.[57] HUD has modified a number of requirements for the Choice Neighborhoods Initiative with the goal of enabling more displaced families to return to redeveloped properties in revitalized neighborhoods. But it is likely that despite these changes, many displaced families will not return and will instead continue to live in private-market housing using the tenant-based vouchers provided to them as part of the relocation process. Outcomes for these families will depend in substantial part on the types of neighborhoods to which they move and the services they receive as part of the initiative.
While HUD requires that agencies receiving CNI grants provide “mobility counseling” and “housing search assistance,” it does not define what those efforts must consist of. HUD’s report on initial implementation by the first five CNI grantees finds that “[n]one of the plans devotes much attention…to ensuring that those who choose not to return also end up in better situations.”[58] This is an inauspicious start, given HOPE VI’s history of many displaced families ending up in high-poverty — albeit safer — areas, with inadequate schools.[59]
To realize the maximum benefit for families that have lived in distressed developments in deprived communities, HUD should require CNI grantees to offer relocating families effective mobility services, including recruitment of landlords in low-poverty, high-opportunity communities, effective search assistance, and policies that allow vouchers to provide sufficient subsidies to make renting in higher-cost neighborhoods feasible for families. To help families remain in or make a subsequent move to a neighborhood with greater opportunities, these services should remain available to families at least until the replacement for the distressed property is ready for reoccupancy, when families could choose to move back or to keep their vouchers.
Findings on the CNI model’s effectiveness at transforming neighborhoods and improving the lives of both the original and subsequent residents of the assisted properties, as well as other low-income residents of the distressed neighborhoods, likely won’t be available for a number of years.[60] If the evaluation ultimately demonstrates that the comprehensive revitalization model in the Choice Neighborhoods Initiative is effective and worth the considerable investment, Congress should make it a priority to increase funding so that more families and neighborhoods can benefit.
Expand the Rental Assistance Demonstration With Enhanced Focus on Robust Mobility Options
A second program, the Rental Assistance Demonstration (RAD), allows HUD to convert some public housing units to long-term contracts with public housing agencies under either the project-based component of the voucher program or the separate Section 8 Project-Based Rental Assistance program, with the goal of rehabilitating and preserving the units.[61] RAD, which was established in 2012, could help provide low-income children access to high-opportunity neighborhoods in three ways.
First, RAD can help preserve affordable units in public housing properties located in high-opportunity or improving neighborhoods. Nearly 21,000 families with children live in public housing in census tracts where less than 10 percent of the population is poor, and another 63,000 live in tracts with poverty rates between 10 and 20 percent. Some of these properties provide stable access to effective schools.[62]
Many of these developments could be lost, however, if current policies continue. Maintenance and repair of public housing has been underfunded for decades, causing a substantial loss in the number of units available as projects deteriorate. HUD recently estimated that the remaining stock of public housing has accumulated a backlog of unmet capital needs of $26 billion.[63] The well-located public housing developments would be extremely difficult to replace if they were lost, due to factors such as the high cost of land and neighborhood resistance to the development of new subsidized housing.
The long-term Section 8 subsidy contracts that RAD provides make it easier to leverage private investment, in the form of mortgage loans or housing tax credits, to rehabilitate public housing developments. Moreover, RAD policies generally require either preservation or replacement of all units in all affected developments. RAD conversions can play a vital role in preserving well-located affordable properties for the long run.
Second, RAD could contribute to revitalization of high-poverty neighborhoods if the resources it provides were combined with Choice Neighborhoods grant funds and investments in schools and crime reduction like those called for under the Promise Zones Initiative. HUD has encouraged RAD conversions to be made in public housing properties that are being substantially rehabilitated or replaced through Choice Neighborhoods grants, by allowing housing agencies to submit a joint application to participate in the two initiatives. Without higher funding for Choice Neighborhood grants and related programs, however, few properties converted under RAD are likely to be located in areas undergoing comprehensive revitalization.
Third, RAD expands the choices available to low-income families that live in the converted developments. Most families in RAD developments will be permitted to move with the first tenant-based Housing Choice Voucher that becomes available at their local housing agency after they have lived in the converted development for a defined period: one year for a development converted to project-based vouchers and two years for a development converted to project-based rental assistance. This “mobility option” is available today to families assisted through the regular project-based voucher program, but not to those in public housing and PBRA developments.
The RAD mobility option offers a promising opportunity to help families move to low-poverty neighborhoods. Since RAD residents will have had stable affordable housing in the period before they are eligible to move with a voucher, they should have time to consider neighborhood options (and where necessary, to try to repair their credit history, which will give them a better chance of being accepted by a landlord in a low-poverty area) before they begin to search for a new home. Counseling about neighborhood options and search techniques can be delivered efficiently to RAD residents who live in a single development. For these reasons, RAD offers a potentially better platform than HOPE VI relocation did to assist families in making moves to high-opportunity areas.
The mobility option will not reduce the overall number of residents living in RAD developments in neighborhoods of concentrated poverty, because when a family uses a tenant-based voucher to leave a RAD development, the unit it vacates will remain subsidized and be filled by a household from the housing agency’s or private owner’s waiting list. But this policy will provide interested residents with the opportunity to move to a lower-poverty neighborhood. The opportunity to move out of public housing in a very poor neighborhood could be especially important for families with young children, for whom continuing to live in a high crime-area with poorly performing schools may have a lifelong impact.
Congress and HUD should take several measures to capitalize on RAD’s potential to provide low-income families better access to high-opportunity neighborhoods.
- Support strong mobility assistance for RAD residents. HUD should encourage local housing agencies to help residents of RAD properties access housing in high-opportunity areas, including by providing guidance to agencies on best practices for performing these tasks. Such practices could include, for example, educating RAD residents about housing opportunities, assisting them with their housing search, adjusting usual policies on the amount of time a voucher holder has to find and lease a unit, providing resources to help cover security deposits and moving expenses, and supporting residents after they have moved to help them adjust to their new neighborhoods and take advantage of the services the new neighborhoods offer.
- Allow full Section 8 subsidies when needed to preserve developments in high-opportunity areas or support comprehensive revitalization. The Section 8 subsidies provided to RAD developments — including project-based vouchers and Project-Based Rental Assistance — are capped at the level of the public housing subsidies the development received before conversion. This level is typically much lower than subsidies set under the regular market-oriented Section 8 rules and would be inadequate to sustain many developments over the long run. As a result, this limit makes RAD conversion infeasible for a large segment of the public housing stock.
The Administration’s 2015 budget requests $10 million to provide higher subsidies for some RAD units in high-poverty areas where the Administration is supporting comprehensive revitalization, such as in Promise Zones.[64] This funding was included in the Senate Appropriations Committee’s 2015 housing appropriations bill but not in the housing appropriations bill the full House approved. Congress should include these funds in the final fiscal year 2015 funding bill, but allow the funds to be used not only for RAD units in high-poverty areas that are being revitalized but also for RAD units in high-opportunity or rapidly improving areas, as such units are important to preserve. - Expand and extend the demonstration. When Congress established RAD in 2012, it limited conversions to 60,000 public housing units — about 5 percent of the nation’s public housing stock. By the end of 2013, HUD had already received applications to convert 176,000 units. The Senate’s 2015 funding bill would raise the unit limit on conversions to 185,000 units. (The House bill made no change.) Congress should include the Senate provision in the final appropriations bill.
Conclusion
A growing body of evidence suggests that children benefit from living in safe, low-poverty neighborhoods with good schools, while growing up in extremely poor neighborhoods with low-performing schools and high levels of crime and violence can undermine their development and well-being over the short and long terms. Yet, federal rental assistance programs have a disappointing track record of helping low-income families to avoid high-poverty neighborhoods and access healthier communities with better opportunities.
Policymakers and program administrators can make substantial progress in the next few years toward the goal of improving opportunities for assisted families. Federal, state, and local agencies can make four interrelated sets of policy changes that will help more families in the Housing Choice Voucher program to live in better locations. In addition, two new HUD programs have the potential to help more families who live in public housing or receive Project-Based Rental Assistance to live in neighborhoods that promote better outcomes for children if Congress expands them and HUD implements them effectively.
End notes:
[1] See Briggs (2005a).
[2] Fischer (2014).
[3] Bostic (2014); U.S. General Accountability Office (2012); Abravanel, Pindus, & Theodos, (2010); DeLuca & Rosenblatt (2013); Kubisch (2010).
[4] Turner, Popkin, & Rawlings (2009a); Popkin & Cunningham (2009).
[5] DeLuca, Garboden, & Rosenblatt (2013); Galster (2013).
[6] See Darrah & DeLuca (2014).
[7] DeLuca, Garboden, & Rosenblatt (2013), p. 271.
[8] HUD rules require agencies to provide information to families when they first receive a voucher about their choices of where to live, and if they live in a high-poverty census tract, to explain the advantages of moving to an area that does not have a high concentration of poor families. See 24 C.F.R. §982.301. But there is no requirement that agencies provide actual assistance to families to find a suitable unit, though HUD’s Housing Choice Voucher Program Guidebook includes some reasons why housing agencies may find it in their interest to provide assistance to families to locate units. HUD Handbook 7420.10G, chapters 2-9.
[9] HUD measures the performance of agencies in administering the HCV program through the Section 8 Management Assistance Program, known as SEMAP. As discussed below, only a very small share of the points available under SEMAP relate to housing location, and the measures are weakly defined.
[10] Briggs, Comey, & Weismann (2010). McClure (2013). Metropolitan areas differ greatly in the share of vouchers used in the suburbs relative to the share of units renting below the Fair Market Rent that are located in the suburbs. (Covington, Freeman, & Stoll, 2011).
[11] McClure (2013), p. 216.
[12] Scott et al. (2013).
[13] Congress increased funding significantly in 2014 for both voucher subsidies (by more than $1 billion) and public housing agencies’ administrative costs (by $227 million), compared with the funding that PHAs received in 2013, when sequestration was in effect. Congress has not yet finalized 2015 funding levels. Maintaining adequate funding for the HCV program in 2016 and beyond will be more challenging if policymakers do not agree to ease or eliminate sequestration. Sequestration is scheduled to take full effect in 2016, and will further squeeze the overall amount of funding available for non-defense programs that aren’t entitlements, including the HCV program.
[14] Under SEMAP, only five out of the 135 points that agencies in metropolitan areas are eligible to receive concern adoption and implementation of policies to “expand housing opportunities,” which HUD defines as encouraging participation of landlords located outside areas of poverty or minority concentration and providing information to voucher holders about such opportunities. 24 C.F.R. § 985.3(g). (Metropolitan agencies required to operate a Family Self-Sufficiency program may earn a total of 145 points.)
Agencies can earn an additional five points if half or more of HCV families with children live in “low poverty” census tracts or the share of families living in such areas increases by 2 percent or more. HUD defines “low poverty” for this purpose as a poverty rate of 10 percent or less, or the average poverty rate in the agency’s primary service area, whichever is higher (see 24 C.F.R. §985.3(h)).As of 2008, only 224 of the approximately 1,500 agencies operating in metropolitan areas claimed these additional five points according to Danielle Bastarache, (then) Director of HUD Office of Housing Voucher Programs, presentation at the Annie E. Casey Foundation, October 30, 2009.
[15] Experience in the Moving to Opportunity program indicates that measuring location performance solely on the basis of the neighborhood poverty rate is insufficient, because that does not necessarily correspond to reliable access to well-performing schools. See Turner, Popkin, & Rawlings (2009b) pp. 85-86, for a discussion of the challenges in objectively defining opportunity areas. The recent report of the Bipartisan Policy Center’s Housing Commission recommended that HUD adopt outcome-based performance measures, including measures that promote the deconcentration of poverty and access to neighborhoods of opportunity (Bipartisan Policy Center, 2013, p. 99).
[16] O’Neil (2009).
[17] HUD, Affirmatively Furthering Fair Housing Proposed Rule, 78 Fed. Reg. 43710 (July 19, 2013).
[18] To assist grantees in implementing the final AFFH rule, HUD plans to provide agencies with neighborhood-level data on education quality, transit access, levels of poverty and employment, exposure to environmental health hazards, and the availability of other community assets in order to help agencies assess levels of opportunity in particular neighborhoods. See the draft of the AFFH Assessment Tool and draft tables of the accompanying data that HUD published on September 26, 2014, http://huduser.org/portal/affht_pt.html.
[19] HUD has authority under its current rule (24 C.F.R. §982.152(a)(iii)(C)) to provide supplemental fees for “extraordinary costs,” which HUD uses to provide a $200 bonus to a housing agency for each family that buys a home while participating in the HCV program. HUD could also use this authority to provide a bonus to agencies that assist families to use vouchers successfully to move to high-opportunity areas. PHAs primarily earn fees based on the number of vouchers in use. Leasing units in high-opportunity areas typically takes longer than leasing in neighborhoods where vouchers are commonly accepted. A fee incentive would help balance PHAs’ current financial interest in having families locate units as quickly as possible.
[20] Generally, families pay at least 30 percent of their adjusted income for rent and any tenant-paid utilities, and the HCV subsidy covers the rest of the cost up to the agency-set payment standard, which varies by family size. If the cost of rent and utilities is above the payment standard, the family pays 100 percent of the additional cost, but families are not permitted to move into a unit that costs them more than 40 percent of their income. Agencies may vary their payment standards for different neighborhoods, but few do so, and they cannot set a payment standard outside of the “basic range” of 90-110 percent of the Fair Market Rent for the area without HUD approval.
[21]The share of vouchers that families with children use to rent larger units — that is, units with more bedrooms than their subsidy level is based on — increases slightly with the poverty rate of the census tract in which families live, rising from 18 percent of the vouchers used by families with children in low-poverty census tracts to 23 percent of such vouchers in tracts where 30 percent or more of residents are poor. In tracts where the poverty level is 10 percent or greater, a majority of these larger units are in zip codes where the zip-code-based FMR is below the metro-wide FMR. In extreme-poverty census tracts, 73 percent of voucher-holder families with children renting a larger unit than their subsidy is based on live in areas where the metro-wide FMR is higher than local rents. (CBPP analysis of HUD 2012 administrative data for agencies not participating in the Moving to Work demonstration, compared with 2013 HUD FMRs.) Rosen (2014) describes, based on ethnographic research with Baltimore landlords renting to HCV holders, the motivations of landlords and families with HCVs that lead to families renting larger (or nicer) units in racially concentrated, very poor, “rough” neighborhoods.
[22] Edin, DeLuca, & Owens (2012); Collinson & Ganong (2013); Khadduri (2013a).
[23] Collinson & Ganong (2013).
[24] HUD sets FMRs at the 40th percentile of market rents in most parts of the country, but in an effort to expand rental opportunities for voucher holders, it sets them at the 50th percentile in large metropolitan areas where voucher holders and affordable rental units are particularly concentrated. If HUD replaced the 50th percentile metropolitan FMR policy with 40th percentile SAFMRs in heavily concentrated metros, this would likely be more effective in encouraging voucher holders to move to high-opportunity areas while avoiding an increase in (and possibly lowering) subsidy costs.
Even without this policy change, individual housing agencies could request HUD approval for “exception payment standards” that are based on the SAFMRs and are set more than 10 percent above or below the metropolitan FMR, without the need to conduct a costly survey of market rents. See Final Fair Market Rents for the Housing Choice Voucher Program and the Moderate Rehabilitation Single Room Occupancy Program fiscal year 2015, 79 Fed. Reg. 59786, 59787 (Oct. 3, 2014).
[25] DeLuca, Garboden, & Rosenblatt (2013), pp. 280-281. Several studies found that families relocating from public housing that was being demolished or rehabilitated relied most heavily on the agency-provided list of units (see Galvez (2010) p. 11). Rosen (2014) describes similar problems when a housing agency relies on a privately compiled website (e.g., GoSection8.com).
[26] Varady and Kleinhans (2013) emphasize the potential importance of avoiding the concentration of voucher holders in neighborhoods that are becoming increasingly poor, in order to prevent negative “spillover” effects from housing assistance programs. They also emphasize the role of targeted landlord outreach and post-move counseling (discussed below) in achieving broader dispersal.
[27] Briggs, Popkin, & Goering (2010), p. 233,emphasize the importance of strategies that would “change the default” of families staying in familiar neighborhoods, citing Richard Thaler and Cass Sunstein (2008). HUD solicited public comment on this issue in March 2012 as part of proposed changes to streamline the “portability” process, but has not yet issued a final rule.
[28] DeLuca, Garboden, & Rosenblatt (2013), pp. 275-280. In most areas of the country, landlords may legally refuse to accept HCVs unless that can be proven to be a proxy for discrimination based on race, national origin, disability, or family status that is prohibited by the Fair Housing Act.
[29] See 24 C.F.R. §982.303. Extensions are required as a reasonable accommodation to people with disabilities.
[30] CBPP analysis of 2012 HUD data. In 255 out of the 352 metro areas, two or more PHAs administered HCV programs; a single agency served only a little more than one-fourth of metro areas. See Technical Appendix.
[31] For a discussion of the interrelationship between low-income and racially segregated neighborhoods and lower-quality schools in central cities and some older suburbs, see Briggs (2005b) and Mickelson (2011, p. 5).
[32] Consolidation of separate housing agencies to form a single metro-wide PHA would potentially have greater benefits but also faces greater political hurdles; for many PHAs, the ability to retain their independent identity is a paramount concern. This makes it more likely that PHAs would join a consortium to achieve administrative economies of scale than to formally consolidate with other agencies. Urban policy experts Bruce Katz of the Brookings Institution and Margery Austin Turner of the Urban Institute recently issued a paper recommending regional voucher administration (See Katz & Turner, 2013).
[33] According to HUD, there currently are only eight consortia involving 35 PHAs that administer the HCV program. HUD, Streamlining Requirements Applicable to Formation of Consortia by Public Housing Agencies, Proposed Rule, 79 Federal Register 40019, July 11, 2014.
[34] Id.
[35] U.S. Housing Act of 1937, 42 U.S.C. § 1437a(6)(B)(iii) (2006).
[36] Fee-splitting and ongoing transfers of funds and records between the agencies that issued the vouchers and the agencies that serve the areas where families lease housing are required unless the “receiving” agencies “absorb” the families into their own HCV program, by giving the families vouchers they have available instead of serving families on their waiting lists.
[37] As noted above, HUD has proposed changes that would streamline portability procedures somewhat, but the procedures would still be time-consuming for PHAs and families, and PHAs would still lose administrative fees if families moved to another PHA’s service area. Research in Southern California has identified the portability process as a barrier for families and a disincentive for PHAs to in?form families of their right to move to other jurisdictions (Basolo, 2003).
[38] In their analysis of how philanthropic investments can help tackle poverty in distressed urban neighborhoods, Turner, Edelman, Poethig, and Aron (2014) discuss assisted housing mobility strategies and support for car access as two promising initiatives to expand residents’ choices.
[39] See, e.g., O’Neil (2009). Many of the efforts to help voucher holders move to higher opportunity communities have focused on former public housing residents, often because the efforts were the result of litigation concerning public housing segregation. The Moving to Opportunity Demonstration, as well, involved public housing residents. O’Neil points out the greater barriers such families may face compared with families who have a history of renting in the private market and are familiar with how the HCV program works. Whether families need direct assistance and how much assistance they may require may depend on their background as well as local market characteristics.
[40] The Housing Opportunity Area Tax Incentive is in Section 18-173 of the Illinois Property Tax Code. The program is limited to townships with relatively high real estate evaluations within counties with at least 200,000 residents. “Low-poverty” is defined as census tracts where less than 10 percent of residents are poor, except in the city of Chicago, where the measure is less than 12 percent poor. Public housing agencies are responsible for much of the administration of the abatement program.
[41] Freeman (2012); Freeman & Li (2012). These studies covered only some of the areas with laws prohibiting discrimination against voucher holders. It is important to note that few if any areas have rigorous enforcement of voucher anti-discrimination laws. The Poverty & Race Research Action Council maintains a list of anti-discrimination laws that apply to housing vouchers; see Poverty & Race Research Action Council (2014). Except for properties that receive particular types of federal assistance or tax credits, there is no federal requirement not to discriminate against voucher holders, although the Fair Housing Act prohibits discrimination against protected classes of people, including refusal to accept housing vouchers as a pretext for discriminating against those groups of people.
[42] Cunningham et al. (2010).
[43] Qualitative research with families that moved to low-poverty areas as part of the Moving to Opportunity demonstration identified the difficulty of finding new landlords who would accept vouchers in the same or similar communities as a major reason that many families moved back to higher poverty neighborhoods when their initial lease terminated (Comey, Briggs, & Weismann, 2008; Edin, DeLuca, & Owens, 2012).
[44] Family participation in these programs is voluntary. In Baltimore, vouchersissued as part of the Thompsoncourt settlementmust be used initially in a census tract that has less than 10 percent poverty and a population that is less than 30 percent African American and less than 5 percent subsidized housing residents. The program is administered by a non-profit that operates throughout the Baltimore area. In Dallas, the Inclusive Communities Project provides mobility counseling to families with special vouchers issued as part of the settlement of the Walker case, and since 2011 to any families issued regular vouchers by the Dallas Housing Authority who are interested in living in a high opportunity area. The Walker vouchers have to be used first in an area with no public housing units and a lower black population and poverty rate than the city of Dallas. Under the Walker decree, the Dallas Housing Authority also can administer all of the vouchers it issues, not just the special vouchers, in any of the seven counties the decree covers. Both the Baltimore and Dallas programs allow families more time to find a unit to rent and provide additional financial assistance to help with moving costs for families that lease in areas that meet these restrictions or otherwise qualify as high opportunity areas. In addition, vouchers used in such areas can pay a higher subsidy than HUD rules usually allow. For Baltimore, see Engdahl (2009) and Darrah and DeLuca (2014). For Dallas, see Inclusive Communities Project (2013).
[45] DeLuca, Duncan, Keels, & Mendenhall (2010).
[46] Preliminary analyses that DeLuca, Garboden, and Rosenblatt conducted show that the duration-weighted neighborhood poverty rate for families in the Baltimore program who moved between two and ten years earlier was 11.4 percent in 2013. Families’ average neighborhood poverty rate over the five years following their initial move was 12.2 percent; the rate was 14.6 percent over the ten years after the families’ initial move. (Personal communication, June and August 2014). For data on the original and first-move neighborhoods of these families, see DeLuca and Rosenblatt (2011). Comparable data on duration of stay in low-poverty areas are not available for the Dallas program, though administrative data indicate that the 2,087 families with Walker vouchers (see note 44 above) have lived in their current home in an area that meets program requirements for an average of four years. (Personal communication from Elizabeth Julian, President of the Inclusive Communities Project, April 2014.) For similar analysis of MTO families, see Ludwig (2012), discussed in section 1 of this paper.
[47] Darrah & DeLuca (2014). See also Wogan (2014, March 25). The Baltimore area program has added an education component to its mobility counseling to help parents understand better what different schools offer and to help students adjust to their new schools (DeLuca et al., 2012). Other research has suggested that families’ values and their interest in remaining in a different type of neighborhood than they had experienced previously were likely to be influenced by the extent of “social integration” that family members achieved with their new neighbors (e.g., Varady & Kleinhans, 2013).
[48]Cunningham et al. (2010); Galvez (2010); Rosenbaum & Zuberi (2010).
[49] HUD provided funding for the counseling services and financial incentives; the MacArthur Foundation has funded the research. Barbara Sard, co-author of this CBPP paper, chairs the Technical Advisors Panel for the Chicago Regional Housing Choice Initiative.
[50]Scott et al. (2013), p. 64-68.
[51] Pendall et al. (2014).This study used data from the MTO demonstration as well as the Welfare to Work Voucher program. It found that families with access to a car spent a larger share of the time during the study living in a neighborhood that was less than 10 percent poor than families without access to a vehicle, regardless of what group they were assigned to as part of either demonstration (a 4.9-percentage-point-larger share of the time for MTO participants and a 5.7-point-larger share for WTW participants). For MTO families, vehicle access mattered almost as much as receiving a geographically restricted voucher (for lengthening the duration of stay in a low-poverty neighborhood) and significantly lowered the rate of re-entry into higher poverty neighborhoods. The authors acknowledge, however, that families with cars may have differed in unobserved ways from families without cars, such as perseverance, as car access was not a factor in the selection of treatment and control groups in either study. According to the National Consumer Law Center, there are more than 120 nonprofit organizations across the country that help low-wage working families obtain a car. See http://www.workingcarsforworkingfamilies.org/find-a-program.
[52] According to HUD, 78 percent of extremely poor census tracts are also predominantly minority and “often reflect legacies of segregated housing patterns.” Preamble to the proposed rule on Affirmatively Furthering Fair Housing, 78 Federal Register 43710, 43714 (July 19, 2013).
[53] The section of The White House website on Sparking Community Revitalization states: “A child’s zip code should never determine her destiny; but today, the neighborhood she grows up in impacts her odds of graduating high school, her health outcomes, and her lifetime economic opportunities.” See http://www.whitehouse.gov/issues/urban-and-economic-mobility/community-revitalization#communities.
Local governments (including Native American tribes) seeking designation of a Promise Zone must propose clear goals and evidence-based strategies, “with a focus on creating jobs, increasing economic activity, improving educational opportunities, increasing access to quality, affordable housing and reducing violent crime,” The White House (2014). If selected, local partners receive enhanced technical assistance and priority in competitions for funds — such as the Department of Education’s Promise Neighborhoods grants, the Justice Department’s Byrne Criminal Justice Innovation grants, and HUD’s Choice Neighborhood grants — that will help achieve these goals. In 2014, 12 federal agencies are providing preferential access for the areas selected as Promise Zones to 35 programs that the agencies administer. The White House announced the first five of the planned 20 Promise Zones on January 8, 2014. It plans to select eight additional zones in 2015, and make all 20 designations by the end of 2016.
[54] One of the criteria for selection of the first five Promise Zones was an overall zone poverty rate above 20 percent and at least one tract with a rate above 30 percent (HUD, 2013a). The selection criteria for the second round target higher poverty areas; a proposed zone will be eligible only if it has an overall poverty rate above 33 percent (HUD, 2014). (Alternatively, applicants can qualify if more than 33 percent of residents have incomes at or below 30 percent of the area median income.)
[55] Pub. L. 113-76, Consolidated Appropriations Act of 2014, p. 606-607. Congress has set basic program parameters in the appropriations laws but has not enacted legislation to authorize the program, leaving most policy decisions to HUD to craft through grant requirements. HUD specifies the core goals of the Choice Neighborhoods Initiative (CNI) as replacing distressed public and assisted housing with high-quality mixed-income housing, improving educational outcomes and intergenerational mobility, and creating the conditions necessary for public and private reinvestment (HUD, 2013b). HUD defines a distressed property as one that is seriously physically deteriorated, socially distressed (i.e., marked by high unemployment and crime), and contributes to neighborhood physical decline. A distressed neighborhood is one that is more than 20 percent poor and either has a high crime rate, a high rate of vacant or substandard housing, or inadequate schools (HUD, 2013b, p. 17-18). The level of funding for Choice Neighborhoods grants for fiscal year 2015 has not yet been determined. The fiscal year 2015 appropriations bill for HUD that the Senate Appropriations Committee has approved would provide $90 million, the same level as in 2014, but the 2015 appropriations bill the House has passed would sharply cut funding to $25 million. The average CNI implementation grant for the sites funded to date is approximately $30 million.
[56] Levy & Wooley (2007); U.S. General Accounting Office (2003); Popkin et al. (2004); Zielenback (2003).
[57] Comey (2007).
[58] U.S. Department of Housing and Urban Development (2013c). See also Galvez (2013).
[59] Over half of the households relocated from Chicago public housing between 2001 and 2004 through HOPE VI moved to neighborhoods with a poverty rate above 40 percent (Cunningham & Sawyer, 2005). See also, Popkin et al. (2004) p. 33-36; Popkin & Cunningham (2009); Popkin, Levy, & Buron (2008).
[60] The final implementation report on the first five sites and baseline data are due to HUD in mid-2014. HUD plans to award a subsequent contract to evaluate outcomes.
[61] See Center on Budget and Policy Priorities (2013a). Project-based vouchers (PBVs) are a component of the Housing Choice Voucher program, which is administered by and funded through about 2,300 state and local housing agencies. Most vouchers are tenant-based vouchers, which families use to rent a modest unit of their choice in the private market, but housing agencies may “project-base” a limited share of their voucher funds in particular buildings. Under the separate Section 8 Project-Based Rental Assistance program, HUD provides subsidies directly to owners of assisted properties, who may be for-profit, non-profit, or public entities.
Subsidies for public housing properties converted under RAD are provided through PBRA or the project-based component of the HCV program but are subject to some special rules. For example, tenants retain some rights that are available to public housing residents but not normally to PBV or PBRA participants, housing agencies that administer RAD PBV developments may project-base a larger share of their voucher funds than is normally permitted, and RAD developments can only be transferred to private ownership under limited circumstances.
[62] Schwartz (2012).
[63] Finkel et al. (2010).
[64] The Senate report estimates that the $10 million would support conversion of 3,000 units in high-poverty areas. Senate Report No. 113-182 (2014), p. 107.
Technical Appendix
This appendix explains the data sources and methods used in the analyses in Sections 2 and 3 of this paper and contains more detailed tables.
Assisted Households
This analysis uses U.S. Department of Housing and Urban Development (HUD) administrative data on households that participated in the Section 8 Housing Choice Voucher (HCV), Public Housing, and Section 8 Project-Based Rental Assistance (PBRA) programs during calendar year 2010. Data for households in public housing participating in the Moving to Work Demonstration in the District of Columbia and Chicago were omitted from the 2010 HUD file. We used data from calendar year 2011 to supplement the undercount of households in public housing served by the District of Columbia and Chicago housing authorities. The data are an extract from the Family Report Forms HUD-50058 and HUD-50059. Our analysis excludes about 4,000 units in other HUD programs that house families with children.
Presence of Minors in the Household
The HUD administrative data report the presence and number of minor children in the household. The data have a flag variable to identify households with minor children; however, this flag sometimes identifies a household as childless, contradicting other variables that indicate the presence of a minor child in the household. To address this contradiction, we created our own flag, which considers all of the variables to identify households as having (or not having) minors. We identified 1,878,830 assisted households with minor children in the three major rental assistance programs and a total of 3,919,511 assisted minors.
Race and Ethnicity
The data identify the race and ethnicity of the head of household. We used the head of household’s race and ethnicity in our analysis for all members of the household. We included individuals of Hispanic ethnicity as Hispanic and excluded them from the black or white racial categories. There are 22,772 households with children where the field for the race of the householder is blank. The majority of these cases are in the PBRA dataset.
Poverty
We used census-tract poverty data to describe the neighborhoods of 1,763,888 assisted households with 3,681,356 children. We assumed that census-tract boundaries reflect neighborhoods. The tract-level geographical data for 114,942 assisted households with 238,155 children was not reported (45,173 HCV households, 48,250 public housing households, and 21,519 PBRA households). We excluded these families from neighborhood poverty analyses.
Poverty estimates by census tracts are primarily from U.S. Census Bureau, American Community Survey, 2009 5-Year Estimates, Table S1701, generated using American Fact Finder, http://factfinder2.census.gov.
HUD administrative data for calendar year 2010 are geocoded to 2000 census boundaries. Beginning in 2010, the American Community Survey uses 2010 census boundaries, while the ACS for 2009 and earlier years uses 2000 census boundaries. We matched the 2010 HUD administrative data to ACS 2009 five-year census tract estimates. HUD administrative data for calendar year 2011 for the District of Columbia and Chicago is geocoded to 2010 census boundaries. We matched these data to ACS 2011 five-year census-tract estimates.
We use all poor children as a comparison group because it is not possible to identify poor children without housing assistance with reasonable accuracy.
A “low-poverty” area is a census tract in which less than 10 percent of the people have incomes below the poverty line. An “extreme” (or “concentrated”) poverty area is a census tract in which 40 percent or more of the people are poor.
Metropolitan Areas
The United States Office of Management and Budget (OMB) defines a Metropolitan Statistical Area (MSA) as one or more adjacent counties or county equivalents that have at least one urban core area of at least 50,000 population, plus adjacent territory that has a high degree of social and economic integration with the core as measured by commuting ties. For more information on metropolitan area definitions, see http://www.census.gov/population/metro/. There are 359 metropolitan areas where one or more public housing agencies administer vouchers.
We identified 1,528 public housing agencies that administer vouchers in metro areas. The location of public housing agencies is from HUD Picture of Subsidized Households 2012 found here: http://www.huduser.org/portal/datasets/picture/yearlydata.html. We determined the areas served by state agencies using public information and interviews.
We ranked the 100 largest metro areas by population. Population estimates in metropolitan areas are from U.S. Census Bureau, American Community Survey, 2012 1-Year Estimates, Table DP04, generated using American Fact Finder, http://factfinder2.census.gov. Eighty percent of all households receiving housing voucher assistance in 2012 lived in the 100 largest metropolitan areas. The number of voucher-assisted households in metropolitan areas (1,916,743) is from HUD administrative data for calendar year 2012.
Fair Market Rents
Using HUD administrative data for calendar year 2012, we analyzed data for 803,273 families with children regarding the census tract where they lived, the number of bedrooms for which they were eligible for a HCV subsidy, and the number of bedrooms in the units they rented — and we matched these data to HUD Fair Market Rents for FY 2013, HUD Small Area Fair Market Rents for FY 2013, and census-tract poverty estimates. Poverty estimates are from the U.S. Census Bureau, American Community Survey, 2012 5-Year Estimates, Table S1701, generated using American Fact Finder, http://factfinder2.census.gov. This analysis did not include families assisted by agencies in the Moving to Work demonstration because the data for those agencies did not include the number of bedrooms for which families were eligible for a subsidy.
We found that 167,031 families with children rent larger units than the authorized subsidy level. Sixty-four percent, or 106,261, of these families live in areas where the Small Area FMR is lower than the metro FMR. Eight percent of these families live in low-poverty areas, while 17 percent live in high-poverty neighborhoods.
Detailed Tables
References
Abravanel, M. D., Pindus, N. M., & Theodos, B. (2010). Evaluating community and economic development programs. Washington, D.C.: Urban Institute. http://www.urban.org/UploadedPDF/412271-New-Markets-Tax-Credit-Program.pdf
Aizer, A., Stroud, L., & Buka, S. (2012). Maternal stress and child outcomes: Evidence from siblings (No. w18422). Washington, D.C.: National Bureau of Economic Research.
http://www.nber.org/papers/w18422.pdf
American Academy of Pediatrics. (2012). Early childhood adversity, toxic stress and the role of the pediatrician: Translating developmental science into lifelong health. http://cirge.stanford.edu/Papers/2012/Garner/PEDIATRICS%202012%20Garner.pdf
Aud, S., Hussar, W., Planty, M., Snyder, T. Bianco, K. … & Drake, L. (2010). The Condition of Education 2010 (NCES 2010-028). Washington, D.C.: National Center for Education Statistics.
http://nces.ed.gov/pubs2010/2010028_1.pdf
Basolo, V. (2003). Local response to federal changes in the Housing Voucher Program: A case study of intraregional cooperation. Housing Policy Debate, 14(1), 143–68.
Berube, A. (2008). Concentrated poverty in America: An overview. In D. Erickson, C. Reid, L. Nelson, A. O’Shaughnessy, & A. Berube (Eds.) The Enduring Challenge of Concentrated Poverty in America (3-15). Washington, D.C.: Federal Reserve System and Brookings Institution. http://www.frbsf.org/community-development/files/cp_fullreport.pdf
Bipartisan Policy Center. (2013). Housing America’s future: New directions for national policy. Washington, D.C.: Bipartisan Policy Center. http://bipartisanpolicy.org/library/housing-americas-future-new-directions-national-policy/
Blad, E. (2014, March 25). 50 years later, housing programs’ reach is limited. Education Week. http://www.edweek.org/ew/articles/2014/03/26/26wophousing_ep.h33.html
Bostic, R. W. (2014). CDBG at 40: Opportunities and Obstacles. Housing Policy Debate, 24(1), 297-302.
Briggs, X. (2005a). The geography of opportunity: Race and housing choice in metropolitan America. Washington, D.C.: Brookings Institution Press.
Briggs, X. (2005b). More Pluribus, Less Unum? The changing geography of race and opportunity. In X. Briggs (Ed.) The geography of opportunity: Race and housing choice in metropolitan America (63-87). Washington, D.C.: Brookings Institution Press.
Briggs, X., Comey, J., & Weismann, G. (2010). Struggling to stay out of high-poverty neighborhoods: housing choice and locations in Moving to Opportunity’s first decade. Housing Policy Debate, 20(3), 383-427.
Briggs, X., Popkin, S. J., & Goering, J. (2010). Moving to Opportunity: The story of an American experiment to fight ghetto poverty. New York: Oxford University Press.
Brooks-Gunn, J., Duncan G.J., Leventhal, T., & Aber, J.L. (2000). Lessons learned and future directions for research on the neighborhoods in which children live. In J. Brooks-Gunn,
G.J. Duncan, & J.L. Aber (Eds.) Neighborhood Poverty, Volume I: Context and Consequences for Children. New York City: Russell Sage Foundation.
Burdick-Will, J., Ludwig, J., Raudenbush, S. W., Sampson, R. J., Sanbonmatsu, L., & Sharkey, P. (2011). Converging evidence for neighborhood effects on children’s test scores: An experimental, quasi-experimental, and observational comparison. In G.J. Duncan & R.J. Murnane (Eds.) Whither Opportunity: Rising Inequality, Schools, and Children’s Life Chances (255-276). New York: Russell Sage Foundation.
Carlson, D., Haveman, R., Kaplan, T., & Wolfe, B. (2012). Long-term effects of public low-income housing vouchers on neighborhood quality and household composition. Journal of Housing Economics, 21(2), 101-120.
Center on Budget and Policy Priorities. (2013a). Policy Basics: Section 8 Project-Based Rental Assistance. Washington, D.C.: Center on Budget and Policy Priorities.
Center on Budget and Policy Priorities. (2013b). Policy Basics: Introduction to Public Housing. Washington, D.C.: Center on Budget and Policy Priorities.
Center on Budget and Policy Priorities. (2014). Policy Basics: The Housing Choice Voucher Program. Washington, D.C.: Center on Budget and Policy Priorities.
Centers for Disease Control and Prevention. (2014). Child maltreatment: risk and protective factors. http://www.cdc.gov/violenceprevention/childmaltreatment/riskprotectivefactors.html
Clampet-Lundquist, S., Edin, K., Kling, J. R., & Duncan, G. J. (2011). Moving teenagers out of high-risk neighborhoods: How girls fare better than boys. American Journal of Sociology, 116(4), 1154-1189.
http://users.nber.org/~kling/mto_ajs2.pdf
Cohen, R. (2011). The impacts of affordable housing on health: A research summary. Center for Housing Policy. http://www.nhc.org/media/files/Insights_HousingAndHealthBrief.pdf
Collinson, R., & Ganong, P. (2013). Incidence and price discrimination: Evidence from housing vouchers. Social Science Research Network, 2255799. http://papers.ssrn.com/sol3/papers.cfm?abstract_id=2255799
Comey, J. (2007). Hope VI’d and on the move. Washington, D.C.: Urban Institute. http://www.urban.org/UploadedPDF/311485_HOPEVI_Mobility.pdf
Comey, J., Briggs, X.D.S., & Weismann, G. (2008). Struggling to stay out of high-poverty neighborhoods: Lessons from the moving to opportunity experiment. Washington, D.C.: Urban Institute. http://www.urban.org/UploadedPDF/411635_high-poverty_neighborhoods.pdf
Covington, K., Freeman, L., & Stoll, M. (2011). The suburbanization of housing choice voucher recipients. Washington, D.C.: Brookings Institution. http://www.brookings.edu/~/media/research/files/papers/2011/10/11%20housing%20suburbs%20covington%20freeman%20stoll/1011_housing_suburbs_covington_freeman_stoll.pdf
Cunningham, M., Scott, M., Narducci, C., Hall, S., Stanczyk, A., O’Neil, J. & Galvez, M. (2010). Improving neighborhood location outcomes in the Housing Choice Voucher Program: A scan of the mobility assistance programs. What Works Collaborative. http://www.urban.org/UploadedPDF/412230-Improving-Neighborhood-Location.pdf
Cunningham, M.K. & Sawyer, N. (2005). Moving to better neighborhoods with mobility counseling. Washington, D.C.: Urban Institute. http://www.urban.org/UploadedPDF/311146_Roof_8.pdf
Darrah, J., & DeLuca, S. (2014). “Living here has changed my whole perspective”: How escaping inner?city poverty shapes neighborhood and housing choice. Journal of Policy Analysis and Management, 33(2), 350-384.
DeLuca, S. & Rosenblatt, P. (2011). Increasing access to high performing schools in the assisted housing voucher program. In P. Tegeler (Ed.) Finding Common Ground: Coordinating Housing and Education Policy. Washington, D.C.: Poverty and Race Action Council. http://prrac.org/pdf/HousingEducationReport-October2011.pdf
DeLuca, S. & Rosenblatt, P. (2013). Sandtown-Winchester – Baltimore’s daring experiment in urban renewal: 20 years later, what are the lessons learned? The Abell Report, 26(8), 1-12. http://www.abell.org/sites/default/files/publications/arn1113.pdf
DeLuca, S., & Dayton, E. (2009). Switching social contexts: The effects of housing mobility and school choice programs on youth outcomes. Annual Review of Sociology, 35, 457-491.
DeLuca, S., & Rosenbaum, J. E. (2003). If low?income blacks are given a chance to live in white neighborhoods, will they stay? Examining mobility patterns in a quasi?experimental program with administrative data. Housing Policy Debate, 14(3), 305-345.
DeLuca, S., Duncan, G. J., Keels, M., & Mendenhall, R. (2012). The notable and the null: Using mixed methods to understand the diverse impacts of residential mobility programs. In M. van Ham, D. Manley, N. Bailey, L. Simpson & D. Maclennan (Eds.) Neighbourhood Effects Research: New Perspectives (195-223). Netherlands: Springer.
DeLuca, S., Duncan, G. J., Keels, M., & Mendenhall, R. M. (2010). Gautreaux mothers and their children: An update. Housing Policy Debate, 20(1), 7-25.
DeLuca, S., Garboden, P. M., & Rosenblatt, P. (2013). Segregating shelter: How housing policies shape the residential locations of low-income minority families. The ANNALS of the American Academy of Political and Social Science, 647(1), 268-299.
Edin, K., DeLuca, S., & Owens, A. (2012). Constrained compliance: Solving the puzzle of MTO’s lease-up rates and why mobility matters. Cityscape 14(2), 181-194.
Ellen, I. G., & Turner, M. A. (1997). Does neighborhood matter? Assessing recent evidence. Housing Policy Debate, 8(4), 833-866.
http://www.centerforurbanstudies.com/documents/electronic_library/neighborhoods/does_neighborhood_matter.pdf
Ellen, I.G., & Horn, K. M. (2012). Do federally assisted households have access to high performing public schools? Washington, D.C.: Poverty & Race Research Action Council. http://files.eric.ed.gov/fulltext/ED538399.pdf
Ellen, I.G., Lens, M. C., & O’Regan, K. (2012). American murder mystery revisited: do housing voucher households cause crime? Housing Policy Debate, 22(4), 551-572.
Engdahl, L. (2009). New homes, new neighborhoods, new schools: A progress report on the Baltimore Housing Mobility Program. Poverty and Race Research Action Council. http://www.prrac.org/pdf/BaltimoreMobilityReport.pdf
Federal Reserve Bank of St. Louis. (2014). Civilian unemployment rate. http://research.stlouisfed.org/fred2/series/UNRATE
Finkel, M., Lam, K., Blaine, C., Cruz, R.J., DeMaro, D., Vandawalker, M. & Woodford, M. (2010). Capital needs in the public housing program. Washington, D.C.: U.S. Department of Housing and Urban Development & Abt Associates Inc. http://portal.hud.gov/hudportal/documents/huddoc?id=PH_Capital_Needs.pdf
Fischer, W. (2014). Research shows housing vouchers reduce hardship and provide platform for long-term gains among children. Washington, D.C.: Center on Budget and Policy Priorities. https://www.cbpp.org/files/3-10-14hous.pdf
Freeman, L. (2012). The impact of source of income laws on voucher utilization. Housing Policy Debate, 22(2), 297-318.
Gallagher, M. Zhang, S., & Comey, J. (2013). Moving to educational opportunity: A housing demonstration to improve school outcomes. What Works Collaborative. http://www.urban.org/UploadedPDF/412972-moving-to-educational-opportunity.pdf
Galster, G.C. (2002). An economic efficiency analysis of deconcentrating poverty populations. Journal of Housing Economics 11 (4), 303-329.
Galster, G.C., Cutsinger, J., & Malega, R. (2008). The costs of concentrated poverty: Neighborhood property markets and the dynamics of decline. In N. Retsinas and E. Belsky (Eds.) Revisiting Rental Housing (93-113). Washington, D.C.: Brookings Institution Press.
Galster, G.C. (2012). The mechanism(s) of neighbourhood effects: Theory, evidence, and policy implications. In M. van Ham, D. Manley, N. Bailey, L. Simpson, and D. Maclennan.(Eds.) Neighbourhood Effects Research: New Perspectives (23-56). Dordrecht, NL: Springer.
Galster, G.C. (2013). US assisted housing programs and poverty deconcentration: A critical geographic review. In D. Manley, M. van Ham, N. Bailey, L. Simpson, & D. Maclennan (Eds.) Neighbourhood Effects or Neighbourhood Based Problems? (215-249). Netherlands: Springer.
Galvez, M.M. (2010). Do we know about Housing Choice Voucher Program location outcomes? A recent review of the literature. What Works Collaborative. Washington D.C.: Urban Institute. http://www.urban.org/UploadedPDF/412218-housing-choice-voucher.pdf
Galvez, M.M. (2013). An early assessment of off-site replacement housing, relocation planning and housing mobility counseling in HUD’s Choice Neighborhoods Initiative. Washington, D.C.: Poverty Race & Research Action Council. http://www.prrac.org/pdf/choiceneighborhoods-affh.pdf
Gennetian, L. A., Sanbonmatsu, L., Katz, L. F., Kling, J. R., Sciandra, M., Ludwig, J., ... & Kessler, R. C. (2012). The long-term effects of Moving to Opportunity on youth outcomes. Cityscape 14:2, pp. 137-167.
Gennetian, L., Ludwig, J., McDade, T., & Sanbonmatsu, L. (2013). Why concentrated poverty matters. Pathways, Spring 2013, 10-13.
http://web.stanford.edu/group/scspi/_media/pdf/pathways/spring_2013/Pathways_Spring_2013_Gennetian_Ludwig_McDade_Sanbonmatsu.pdf
Gubits, D.B., Khadduri, J., & Turnham, J. (2009). Housing patterns of low income families with children: Further analysis of data from the study of the effects of housing vouchers on welfare families. Joint Center for Housing Studies. Cambridge, MA: Harvard University. http://www.jchs.harvard.edu/sites/jchs.harvard.edu/files/w09-7.pdf
Horn, K.M., Ellen, I.G., & Schwartz, A.E. (2014). Do Housing Choice Voucher holders live near good schools? Journal of Housing Economics, 23, 28-40.
Inclusive Communities Project. (2013). Mobility Works. Inclusive Communities Project. http://www.inclusivecommunities.net/MobilityWorks.pdf
Jacob, B.A. & Ludwig, J. (2006). The effect of means-tested housing assistance on labor supply: New evidence from a housing voucher lottery. Paper prepared for Revisiting Rental Housing: A National Summit. Harvard University, Joint Center for Housing Studies, November 14-15, 2006.
Jacob, B., Ludwig, J., & Miller, D.L. (2013). The effects of housing and neighborhood conditions on child mortality. Journal of Health Economics 32(1), 195-206.
Jargowsky, P.A. (2013). Concentration of poverty in the New Millennium: Changes in prevalence, composition, and location in high poverty neighborhoods. The Century Foundation and Rutgers Center for Urban Research and Education. http://www.tcf.org/bookstore/detail/concentration-of-poverty-in-the-new-millennium
Jargowsky, P.A. (2014, April 9). Concentration of poverty: An update. The Century Foundation [blog post]. http://www.tcf.org/work/workers_economic_inequality/detail/concentration-of-poverty-an-update/
Jargowsky, P.A., & El Komi, M. (2009). Before or after the bell? School context and neighborhood effects on student achievement. Neighborhood and life chances: how place matters in modern America, 50-72.
http://www.urban.org/uploadedpdf/1001430-student-achievement.pdf
Jencks, C. & Mayer, S.E. (1990). The social consequences of growing up in a poor neighborhood. In L. Lynn & M. McGreary (Eds.) Inner-City Poverty in the United States (111–186). Washington, D.C.: National Academy Press.
Kahlenberg, R.D. (2012). Socioeconomic school integration. In R.D. Kahlenberg (Ed.), The Future of School Integration. New York City: The Century Foundation.
Katz, B. & Turner, M. (2013). Invest but reform: Streamline administration of Housing Choice Voucher Program. Washington, D.C.: Brookings Institution. http://www.brookings.edu/research/papers/2013/09/30-housing-choice-voucher-katz-turner
Kawachi, I. & Berkman, L.F. (2003). Neighborhoods and Health. New York City: Oxford University Press.
Kessler, R.C., Duncan, G.J., Gennetian, L.A., Katz, L.F., Kling, J.R., Sampson, N.A., ... & Ludwig, J. (2014). Associations of housing mobility interventions for children in high-poverty neighborhoods with subsequent mental disorders during adolescence. JAMA, 311(9), 937-948.
Khadduri, J. (2013a). Commentary: Crime as a dimension of neighborhood quality. Cityscape, 15(3), 159-163.
Khadduri, J. (2013b). Creating balance in the location of LIHTC developments: The role of qualified allocation plans. Washington, D.C.: Poverty & Race Research Action Council and Abt Associates Inc., pp. 1-27. http://www.prrac.org/pdf/Balance_in_the_Locations_of_LIHTC_Developments.pdf
Kling, J., Liebman, J., & Katz, L. (2005). Bullets don’t got no name: Consequences of fear in the ghetto. In T.S. Weisner (Ed.), Discovering Successful Pathways in Children’s Development: Mixed Methods in the Study of Childhood and Family Life (243–281). Chicago: University of Chicago Press.
Kling, J.R., Liebman J.B., & Katz, L.F. (2007). Experimental analysis of neighborhood effects. Econometrica, 75(1), 83-119.
Kneebone, E., Nadeau, C. & Berube, A. (2011). The re-emergence of concentrated poverty: Metropolitan trends in the 2000s. Washington, D.C.: Brookings Institute. http://www.brookings.edu/~/media/research/files/papers/2011/11/03%20poverty%20kneebone%20nadeau%20berube/1103_poverty_kneebone_nadeau_berube.pdf
Kubisch, A.C. (2010). Structures, strategies, action and results from community change efforts. In A.C. Kubisch, P. Asupos, P. Brown & T. Dewar (Eds.), Voices from the Field III: Lessons and Challenges from Two Decades of Community Change Efforts (15-50). Washington, D.C.: Aspen Institute. http://www.aspeninstitute.org/sites/default/files/content/docs/pubs/VoicesIII_FINAL_0.pdf
Lens, M.C. (2013). Safe, but could be safer: Why do HCVP households live in higher crime neighborhoods? Cityscape, 15(3), 131.
Lens, M.C., Ellen, I.G., & O’Regan, K. (2011). Do vouchers help low-income households live in safer neighborhoods? Evidence on the housing choice voucher program. Cityscape, 13(3), pp. 135-159.
Leventhal, T. & Brooks-Gunn, J. (2011). Changes in neighborhood poverty from 1990 to 2000 and youth’s problem behaviors. Developmental Psychology 47(6), 1680–98.
Levy, D.K. & Wooley, M. (2007). Relocation is not enough: Employment barriers among HOPE VI families. Washington, D.C.: Urban Institute. http://www.urban.org/UploadedPDF/311491_HOPEVI_Employment.pdf
Ludwig, J. (2012). Guest Editor’s Introduction. Cityscape, 14(2), pp. 1-28. http://www.huduser.org/portal/periodicals/cityscpe/vol14num2/Cityscape_July2012_guest_introduction.pdf
Ludwig, J., Duncan, G. J., Gennetian, L.A., Katz, L.F., Kessler, R.C., Kling, J.R., & Sanbonmatsu, L. (2013). Long-term neighborhood effects on low-income families: Evidence from Moving to Opportunity (No. w18772). Cambridge: National Bureau of Economic Research.
Ludwig, J., Jacob, B.A., Johnson, M., Duncan G.J., & Rosenbaum, J.E. (2009). Neighborhood effects on low-income families: Evidence from a randomized housing voucher lottery, Working Paper, University of Chicago.
McClure K. & Johnson, B. (2014). Housing programs fail to deliver on neighborhood quality re-examined. Housing Policy Debate. DOI: 10.1080/10511482.2014.944201. http://dx.doi.org/10.1080/10511482.2014.944201
McClure, K. (2010). The Prospects for Guiding Housing Choice Voucher Households to High-Opportunity Neighborhoods. Cityscape 12(3), 101-122.
McClure, K. (2013). Which metropolitan areas work best for poverty deconcentration with Housing Choice Vouchers? Cityscape, 15(3), 209-236.
McClure, K., Schwartz, A.F., & Taghavi, L.B. (2014). Housing Choice Voucher location patterns a decade later. Housing Policy Debate. DOI:10.1080/10511482.2014.921223
http://dx.doi.org/10.1080/10511482.2014.921223
Metzger, M. W. (2014). The reconcentration of poverty: Patterns of housing voucher use, 2000 to 2008. Housing Policy Debate. DOI: 10.1080/10511482.2013.876437
http://dx.doi.org/10.1080/10511482.2013.876437
Mills, G., Gubits, D., Orr, L., Long, D., Feins, J., Kaul, B., & Wood., M. (2006). Effects of housing vouchers on welfare families. Report prepared for U.S. Department of Housing and Urban Development.
http://www.huduser.org/publications/pdf/hsgvouchers_1_2011.pdf
National Housing Trust. (2004). Changes to project-based multifamily units in HUD’s inventory between 1995 and 2003: Number of affordable project-based units declines by 300,000. Washington, D.C.: National Housing Trust.
National Scientific Council on the Developing Child. (2009). Maternal depression can undermine the development of young children. http://developingchild.harvard.edu/index.php/download_file/-/view/582/
National Scientific Council on the Developing Child (2010). Persistent fear and anxiety can affect young children’s learning and development. http://developingchild.harvard.edu/index.php/download_file/-/view/622/
National Scientific Council on the Developing Child (2014). Excessive stress disrupts the architecture of the developing brain. http://developingchild.harvard.edu/index.php/download_file/-/view/469/
O’Neil, J.L. (2009). Housing mobility counseling: What’s missing? In M.A. Turner, S.J. Popkin, & L. Rawlings (Eds.) Public Housing and a Legacy of Segregation (115-125). Washington, D.C.: Urban Institute.
O’Regan, K.M., & Horn, K.M. (2013). What can we learn about the Low-Income Housing Tax Credit Program by looking at the tenants? Housing Policy Debate, 23(3), 597-613.
Orr, L., Feins, J., Jacob, R., Beecroft, E., Sanbonmatsu, L., Katz, L.F., ... & Kling, J.R. (2003). Moving to Opportunity interim impacts evaluation: Final report. Cambridge, M.A.: Abt Associates Inc. and National Bureau of Economic Research.
Osypuk, T.L., Tchetgen, E.J.T., Acevedo-Garcia, D., Earls, F.J., Lincoln, A., Schmidt, N.M., & Glymour, M.M. (2012). Differential mental health effects of neighborhood relocation among youth in vulnerable families: results from a randomized trial. Archives of General Psychiatry, 69(12), 1284-1294.
Pendall, R., Hayes, C., George, A., McDade, Z., Dawkins, C., Jeon, J.S., Knapp, E., Blumenberg, E. Pierce, G., & Smart, M. (2014). Driving to opportunity: Understanding the links among transportation access, residential outcomes, and economic opportunity for housing voucher recipients. Washington, D.C.: Urban Institute. http://www.urban.org/UploadedPDF/413078-Driving-to-Opportunity.pdf
Popkin, S.J., Leventhal, T., & Weismann, G. (2010). Girls in the ’hood: How safety affects the life chances of low-income girls. Urban Affairs Review, 45(6), 715-744.
Popkin, S.J., Rosenbaum, J.E., & Meaden, P.M. (1993). Labor market experiences of low?income black women in middle?class suburbs: Evidence from a survey of Gautreaux program participants. Journal of Policy Analysis and Management, 12(3), 556-573.
Popkin, S.J. & Cunningham, M. (2009). Has HOPE VI transformed residents’ lives? In H.G. Cisneros & L. Enddohls (Eds.) From Despair to Hope: HOPE VI and the New Promise of Public Housing in America’s Cities (191-204). Washington, D.C.: Brookings Institution Press.
Popkin, S.J., Katz, B., Cunningham, M.K., Brown, K.D., Gustafson, J., Turner., M.A. (2004). A decade of HOPE VI: Research findings and policy challenges. Washington, D.C.: Urban Institute. http://www.urban.org/UploadedPDF/411002_HOPEVI.pdf
Popkin, S.J., Levy, D.K., Buron, L. (2008). Has HOPE VI transformed residents’ lives? New evidence from the HOPE VI Panel Study. Housing Studies, 24(4).
Poverty & Race Research Action Council. (2014). Appendix B: State, local and federal laws barring Source-of-Income Discrimination, updated May 2014. http://www.prrac.org/pdf/AppendixB.pdf
Rosen, E. (2014). Selection, matching, and the rules of the game: Landlords and the geographic sorting of low-income renters. Joint Center for Housing Studies. http://www.jchs.harvard.edu/sites/jchs.harvard.edu/files/w14-11_rosen_0.pdf
Rosenbaum, J.E. (1995). Changing the geography of opportunity by expanding residential choice: Lessons from the Gautreaux program. Housing Policy Debate, 6(1), 231-269.
Rosenbaum, J.E., & Zuberi, A. (2010). Comparing residential mobility programs: design elements, neighborhood placements, and outcomes in MTO and Gautreaux. Housing Policy Debate, 20(1), 27-41.
Sampson, R.J. (2012). Great American City: Chicago and the Enduring Neighborhood Effect. Chicago: University of Chicago Press.
Sampson, R.J., Sharkey, P., & Raudenbusch, S.W. (2008). Durable effects of concentrated disadvantage on verbal ability among African-American children. Proceedings of the National Academy of Sciences, 105(3), 845-852.
Sampson, R.J., Morenoff, J.D., & Gannon-Rowley, T. (2002). Assessing ‘neighborhood effects’: Social processes and new directions in research. Annual Review of Sociology, 28(1), 443–478.
Sampson, R.J., Raudenbush, S.W., & Earls, F. (1997). Neighborhoods and violent crime: A multilevel study of collective efficacy. Science, 277(5328), 918–924.
Sanbonmatsu, L., Kling, J.R., Duncan, G.J., & Brooks-Gunn, J. (2006). Neighborhoods and academic achievement results from the Moving to Opportunity experiment. Journal of Human Resources, 41(4), 649-691.
Sanbonmatsu, L., Ludwig, J., Katz, L.F., Gennetian, L.A., Duncan, G.J., Kessler, R.C., ... & Lindau, S.T. (2011). Moving to Opportunity for fair housing demonstration program: final impacts evaluation. Washington, D.C.: National Bureau of Economic Research.
http://www.huduser.org/publications/pdf/MTOFHD_fullreport_v2.pdf
Schwartz, A.F. & McClure, K. (2014). Vouchers and Neighborhood Distress: The unrealized potential for Housing Choice Voucher recipients to reside in neighborhoods with low levels of distress. Revised version of paper presented at the April 4, 2014 Meeting of the Urban Affairs Association, San Francisco, California.
Schwartz, H. (2012). Housing policy is school policy: Economically integrative housing promotes academic success in Montgomery County, Maryland. In R.D. Kahlenberg (Ed.), The Future of School Integration. New York City: The Century Foundation.
Schwartz, H.L., Ecola, L., Leuschner, K.J., & Kofner, A. (2012). Is inclusionary zoning inclusionary? A guide for practitioners. Santa Monica, CA: RAND Corporation. http://www.rand.org/content/dam/rand/pubs/technical_reports/2012/RAND_TR1231.pdf
Scott, M.M., Cunningham, M., Biess, J., O’Neil, J.L., Tegeler, P., Gayles, E., & Sard, B. (2013). Expanding Choice: Practical Strategies for Building a Successful Housing Mobility Program. Washington D.C.: Urban Institute and Poverty & Race Research Action Council. http://www.urban.org/UploadedPDF/412745-Expanding-Choice.pdf
Sharkey, P. (2010). The acute effect of local homicides on children's cognitive performance. Proceedings of the National Academy of Sciences, 107(26), 11733-11738.
Sharkey, P. (2013). Stuck in Place: Urban Neighborhoods and the End of Progress toward Racial Equality. Chicago: University of Chicago Press.
Sharkey, P.T., Tirado-Strayer, N., Papachristos, A.V., & Raver, C.C. (2012). The effect of local violence on children’s attention and impulse control. American Journal of Public Health, 102(12), 2287-2293.
Sharkey, P., Schwartz, A.E., Ellen, I.G., & Lacoe, J. (2014). High stakes in the classroom, high stakes on the street: The effects of community violence on students’ standardized test performance. Sociological Science, 1, 199-220.
Shonkoff, J.P., Boyce, W.T., & McEwen, B.S. (2009). Neuroscience, molecular biology, and the childhood roots of health disparities: building a new framework for health promotion and disease prevention. JAMA, 301(21), 2252-2259.
http://www.brooklyn.cuny.edu/pub/departments/childrensstudies/conference/pdf/Shonkoff-Boyce-McEwen_JAMA.pdf
Shonkoff, J.P., Garner, A.S., Siegel, B.S., Dobbins, M.I., Earls, M.F., McGuinn, L., ... & Wood, D. L. (2012). The lifelong effects of early childhood adversity and toxic stress. Pediatrics, 129(1), 232-246. http://pediatrics.aappublications.org/content/129/1/e232.full.pdf
Smith, R., Gallagher, M., Popkin, S., Mireles, A., & George, T. (2014). Coercive sexual environments: What MTO tells us about neighborhoods and sexual safety. Cityscape, 16(1).
Teske, P., Fitzpatrick, J., & Kaplan, G. (2007). Opening doors: How low-income parents search for the right school. Seattle, WA: Center on Reinventing Public Education. http://www.crpe.org/sites/default/files/pub_crpe_open_jan07_0.pdf
Thaler, R. & Sunstein, C. (2008). Nudge: Improving decisions about health, wealth, and happiness. New Haven: Yale University Press.
The White House. (2014, January 8). Fact Sheet: President Obama’s Promise Zones Initiative. Office of the Press Secretary.
http://www.whitehouse.gov/the-press-office/2014/01/08/fact-sheet-president-obama-s-promise-zones-initiative
Turner, M.A. & Kaye, D.R. (2006). How does family well-being vary across different types of neighborhoods? Washington, D.C.: Urban Institute. http://www.urban.org/UploadedPDF/311322_family_wellbeing.pdf
Turner, M.A., Edelman, P., Poethig, E., Aron, L. (2014). Tackling persistent poverty in distressed urban neighborhoods: History principles, and strategies for philanthropic investment. Washington D.C.: Urban Institute.
http://www.urban.org/UploadedPDF/413179-Tackling-Persistent-Poverty-in-Distressed-Urban-Neighborhoods.pdf
Turner, M.A., Nichols, A., Comey, J., Franks, K., & Price, D. (2012). Benefits of living in high-opportunity neighborhoods: Insights from the Moving to Opportunity demonstration. Washington, D.C.: Urban Institute.
http://www.urban.org/UploadedPDF/412648-Benefits-of-Living-in-High-Opportunity-Neighborhoods.pdf
Turner, M.A., Popkin, S.J., & Rawlings, L. (2009a). Building healthy mixed-income developments: Barriers to neighborhood health and sustainability. In M.A. Turner, S.J. Popkin, & L. Rawlings (Eds.) Public Housing and a Legacy of Segregation (18-23). Washington, D.C.: Urban Institute.
Turner, M.A., Popkin, S.J. & Rawlings, L. (2009b). Moving to neighborhoods of opportunity: Overcoming segregation and discrimination in today’s housing markets. In M.A. Turner, S.J. Popkin, & L. Rawlings (Eds.) Public Housing and a Legacy of Segregation (79-98). Washington, D.C.: Urban Institute.
U.S. Bureau of the Census. (2013). Current Population Survey: Annual Social and Economic Supplements, Table 2. Poverty Status of People by Family Relationship, Race, and Hispanic Origin: 1959 to 2012. http://www.census.gov/hhes/www/poverty/data/historical/hstpov2.xls
U.S. Department of Housing and Urban Development. (2013a). 2013 Urban Promise Zone Application Guide. http://portal.hud.gov/hudportal/documents/huddoc?id=pz_urban_app_guide.pdf
U.S. Department of Housing and Urban Development. (2013b). HUD’s fiscal year (FY) 2013 NOFA for the Choice Neighborhoods Initiative — Implementation Grant. http://portal.hud.gov/hudportal/documents/huddoc?id=fy13cnimplemnofafinal.pdf
U.S. Department of Housing and Urban Development. (2013c). Developing Choice Neighborhoods: An early look at implementation in five sites. Washington, D.C.: Urban Institute. http://www.huduser.org/portal/Publications/pdf/choice_neighborhoods_interim_rpt.pdf
U.S. Department of Housing and Urban Development. (2014). Second round urban Promise Zones application guide. http://portal.hud.gov/hudportal/documents/huddoc?id=PZ_R2_App_Guide_Urban.pdf
U.S. General Accountability Office (2003, November). HOPE VI resident issues and changes in neighborhoods surrounding grant sites. (GAO-04-109). http://www.gao.gov/new.items/d04109.pdf
U.S. General Accountability Office. (2012, February). Limited information and use of effectiveness of tax expenditures could be mitigated through congressional attention (GAO-12-262). http://www.gao.gov/assets/590/588978.pdf
Varady, D., & Kleinhans, R. (2013). Relocation counselling and supportive services as tools to prevent negative spillover effects: A review. Housing Studies, 28(2), 317-337.
Votruba, M.E., & Kling, J.R. (2009). Effects of neighborhood characteristics on the mortality of black male youth: Evidence from Gautreaux, Chicago. Social Science & Medicine, 68(5), 814-823.
Wodtke, G.T., Harding, D.J., & Elwert, F. (2011). Neighborhood effects in temporal perspective: The impact of long-term exposure to concentrated disadvantage on high school graduation. American Sociological Review 76(5), 713–736.
Wogan, J.B. (2014, March 25). Is there a better model for housing vouchers? Governing. http://www.governing.com/topics/health-human-services/better-model-affordable-housing-vouchers.html
Zielenback, S. (2003). Assessing economic change in HOPE VI neighborhoods. Housing Policy Debate, 14(4), 649-651.
More from the Authors

Areas of Expertise