Vast Majority of Americans Would Likely Lose From Senate GOP’s $1.5 Trillion in Tax Cuts, Once They’re Paid For
This week, the Senate Budget Committee will vote on a budget resolution that would allow Congress to move forward with tax-cut legislation that adds $1.5 trillion to deficits over ten years.[2] The vast majority of Americans would be net losers from such a tax bill, if:
- The $1.5 trillion in tax cuts were anywhere near as skewed to the top as those in the tax plan that President Trump and congressional Republicans unveiled last week. That plan would deliver 80 percent of its tax cuts to the top 1 percent of households by 2027, the Tax Policy Center (TPC) estimates.[3]
- The tax cuts were eventually paid for through the types of spending cuts in recent GOP budget proposals, which fall overwhelmingly on low- and moderate-income people.
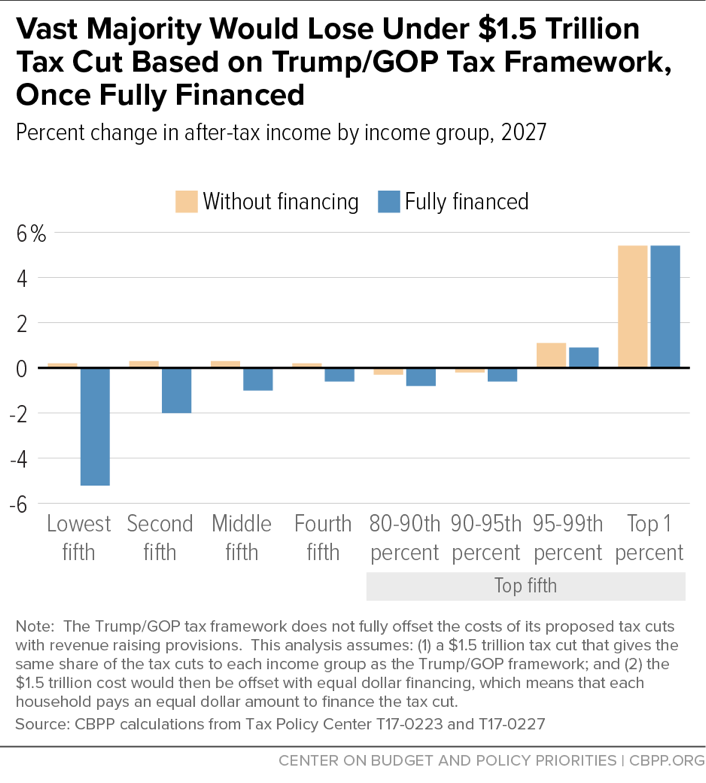
Sooner or later, the cost will need to be offset through some combination of spending cuts and tax increases.This analysis, following an approach that TPC used in its analysis of the potential ultimate effects of a prior Trump tax plan,[4] captures the frequently overlooked reality of a plan that includes net tax cuts over the next decade: sooner or later, the cost will need to be offset through some combination of spending cuts and tax increases. We conclude that the spending cuts and tax increases needed to offset the cost of the Trump/GOP tax cuts would cause most Americans’ incomes to fall more than they would gain from the tax cuts themselves. (See Figure 1.)
These findings underscore the importance of the debate over the budget resolution and the instructions provided for the tax plan. Congress is far more likely to avoid effectively transferring income from low- and middle-income people to the rich if the resolution requires, at minimum, that tax legislation be revenue neutral; that is, all tax cuts should be fully offset by other tax increases, such as closing tax loopholes.[5] If the resolution instead facilitates tax cuts that can be paid for by adding to budget deficits that would result in damaging spending cuts down the road, or by cutting critical programs like Medicaid right away, then the tax cuts would likely leave low- and middle-income people worse off.[6] Reductions in investments and in basic assistance in nutrition, health, education, and other areas vital to the broad population would be made to pay for large tax cuts for the wealthy.
The Majority of Americans Would Pay for a $1.5 Trillion Tax Cut Benefiting the Top
Senate Budget Committee Chairman Mike Enzi’s proposed budget resolution would allow lawmakers to use a legislative fast-track process known as reconciliation (which needs just a simple majority vote in the Senate) to pass a tax cut bill that would add $1.5 trillion to deficits.
For this analysis, we first assume that these $1.5 trillion in tax cuts would follow the basic structure of the tax plan that President Trump and Republican congressional leaders unveiled last week. As such, we assume the eventual $1.5 trillion tax cut bill would deliver the same share of tax cuts to each income group as that plan.[7] TPC estimates that by 2027, when key components of that tax plan are in full effect:[8]
- Eighty percent of the tax cuts would go to the top 1 percent of households (whose incomes exceed $900,000).
- Forty percent of the tax cuts would go to the top 0.1 percent (whose incomes exceed $5 million).
- The bottom 80 percent of Americans would get just 13 percent of the tax cuts.
Second, we acknowledge that the cost of the tax cut will need to be offset through some combination of spending cuts and tax increases, even if the costs are initially funded through increased deficits.[9]
To illustrate this, we assume that the costs of the additional offsets necessary to fully finance a $1.5 trillion tax cut plan are borne equally by each household in the country, as this TPC financing scenario is the one that most closely reflects the budget priorities of the Trump Administration and the Republican Congress. President Trump and Republican lawmakers have repeatedly proposed substantial budget cuts in programs that help families meet basic needs like Medicaid and SNAP (food stamps), as well as in investments that can help build a stronger economy like education and research. They have justified these cuts as necessary to address the projected growth in debt as a share of the economy that we already face — before accounting for a $1.5 trillion tax cut.
Under this “equal costs per household” scenario, in 2027 (see Figure 1):[10]
- The bottom fifth of the income spectrum would lose on average about $1,000 each, amounting to a 5 percent reduction in their after-tax incomes.
- The middle fifth of the income spectrum would lose on average about $800 each, amounting to a 1 percent reduction in their after-tax incomes.
- Every income group in the bottom 95 percent of the income spectrum would be net losers, on average, while only the top 5 percent would be net winners.
- The top 1 percent would be big winners, gaining on average about $128,000 each, a 5 percent increase in their after-tax incomes.
- The top 0.1 percent would be the biggest winners of all, gaining on average about $600,000 each, a 6 percent increase in their after-tax incomes.
These estimates may understate the extent of the likely losses for low- and middle-income Americans under stated GOP tax and budget policies, for two reasons:
- Noting the depth of the cuts to low- and moderate-income programs in the Administration’s and congressional Republican budget and health reform proposals, the authors of the similar TPC analysis that this paper draws on state: “A scenario more regressive [hitting low- and moderate-income Americans even harder] than equal-per-household financing would most accurately characterize the policy preferences embedded in recent proposals by the Trump Administration and Congressional Republicans….”
- The Senate Budget resolution would allow Congress to use reconciliation to pass a bill that had more than $1.5 trillion in tax cuts through the Senate with only a simple majority vote — so long as the additional tax cuts were paid for with cuts to Medicare, Medicaid, and other programs under the Senate Finance Committee’s jurisdiction that help families afford basic needs. This is because the budget resolution instructs the Finance Committee to make changes to deficits, not revenues. This means that the Senate can use reconciliation to pass a bill that makes cuts in mandatory programs that help families afford basic needs, and every dollar cut from those programs could be used to cut an additional dollar in taxes (on top of the $1.5 trillion).
In its analysis, TPC also examined two other financing scenarios, both of which reflect far more progressive financing alternatives (relying more on financing that hits higher-income households) than are reflected in the spending cuts prioritized by the Trump and House Republican budgets. These other scenarios show that only by financing the tax cuts with progressive tax increases is it possible for the majority of Americans not to be net losers. Ultimately, a tax plan that meets the standards of revenue and distributional neutrality requires offsetting any tax cuts with tax increases, and that the cuts and increases are designed in a manner that leaves the current distribution of after-tax income unchanged.
Conclusion
This analysis (and the TPC analysis from which it is derived) is a reminder that “there is no free lunch.” A tax proposal that is not fully paid for — like the $1.5 trillion tax cut that the proposed Senate budget plan would allow — should not be judged solely on what a standard distributional table might show about its effects, because such a table doesn’t consider the income reductions that will occur due to the combination of tax increases and spending cuts ultimately required to offset its costs. A full accounting of such a plan that considers necessary offsets would likely show most households would lose more from the plan than they would gain.
End Notes
[1] This paper draws on Isaac Shapiro and Chye-Ching Huang, “Vast Majority of Americans Would Likely Lose From Trump Tax Cuts, Once They’re Paid For,” CBPP, August 17, 2017, https://www.cbpp.org/research/federal-tax/vast-majority-of-americans-would-likely-lose-from-trump-tax-cuts-once-theyre.
[2] Robert Greenstein, “Greenstein: Senate GOP Budget’s Regressive Tax Cuts Would Swell Deficits, Likely Lead to Budget Cuts Hitting Most Americans,” CBPP, September 29, 2017, https://www.cbpp.org/press/statements/greenstein-senate-gop-budgets-regressive-tax-cuts-would-swell-deficits-likely-lead.
[3] Chuck Marr, “Republican Leaders’ Tax Framework Provides Windfall to High-Income Households, With Working Families Largely an Afterthought,” CBPP, updated October 2, 2017, https://www.cbpp.org/research/federal-tax/big-six-tax-framework-provides-windfall-to-high-income-households-with-working.
[4] William G. Gale, Surachai Khitatrakun, and Aaron Krupkin, “Cutting taxes and making future Americans pay for it: How Trump’s tax cuts could hurt many households,” Tax Policy Center, August 15, 2017, https://www.brookings.edu/research/cutting-taxes-and-making-future-americans-pay-for-it-how-trumps-tax-cuts-could-hurt-many-households/. For our discussion of that TPC analysis, see Shapiro and Huang, op. cit.
[5] Chye-Ching Huang, “Decoding ‘Deficit Neutral’ Tax Bill: Low-Income Program Cuts Pay for Tax Cuts for Wealthy,” Center on Budget and Policy Priorities, June 15, 2017, https://www.cbpp.org/blog/decoding-deficit-neutral-tax-bill-low-income-program-cuts-pay-for-tax-cuts-for-wealthy.
[6] The Senate budget resolution does both: see Greenstein, op. cit.
[7] Tax Policy Center, “A Preliminary Analysis of the Unified Framework,” September 28, 2017, http://www.taxpolicycenter.org/publications/preliminary-analysis-unified-framework/. The tax cut plan unveiled last week costs more than $2.4 trillion over ten years, with a cost of $227 billion in 2027, TPC estimates.
[8] Dollar cutoffs are based on the TPC’s projection of the income distribution in 2027, in 2017 dollars. If a $1.5 trillion tax cut followed the same timing patterns as the Trump and congressional Republican plan unveiled last week, it would lose $141 billion in revenues in 2027. We therefore scale TPC’s 2027 distribution of the tax cuts by a ratio of $141/$228, holding the share of the tax cut that each income group would get constant. Under these assumptions, the $1.5 trillion tax cut package in 2015 would deliver a tax cut of about $130,000 on average to households in the top 1 percent (a 5 percent increase in their after-tax incomes) and a tax cut of about $630,000 on average to households in the top 0.1 percent (a 6 percent increase in their after-tax incomes). Households in income groups in the bottom 80 percent of the income distribution would receive average tax cuts of cut between $31 and $280 (increasing their after-tax incomes by just 0.2-0.3 percent).
[9] For further discussion of how the costs of tax cuts cannot be postponed indefinitely, see William G. Gale, Isaac Shapiro, and Peter R. Orszag, “Distribution of the 2001 and 2003 Tax Cuts and Their Financing,” Tax Analysts, June 21, 2004, http://webarchive.urban.org/publications/1000663.html.
[10] Within each income group below the 95th percentile, there could be some small number of “winners” who have a net tax cut, but they would be far outnumbered by the “losers.” Also note that if the dollar tax cuts for those in the bottom and middle of the income distribution were assumed to be same as in the Trump/GOP plan costing $2.4 trillion, low- and middle-income filers would still be net losers, once financing is considered.
More from the Authors

Areas of Expertise