BEYOND THE NUMBERS
Top Five State Tax Charts
To accompany our Top 10 Federal Tax Charts, here are five charts focusing on state tax issues.
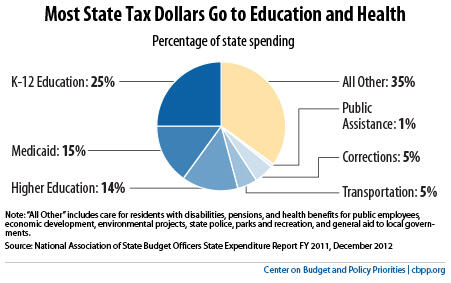
First, let’s look at what state taxes pay for. By far the largest areas of state spending, on average, are education (both K-12 and higher education) and health care, as the first chart, below, shows.
But states also fund a wide variety of other services, including transportation, corrections, pension and health benefits for public employees, care for persons with mental illness and developmental disabilities, assistance to low-income families, economic development, environmental projects, state police, parks and recreation, housing, and aid to local governments.
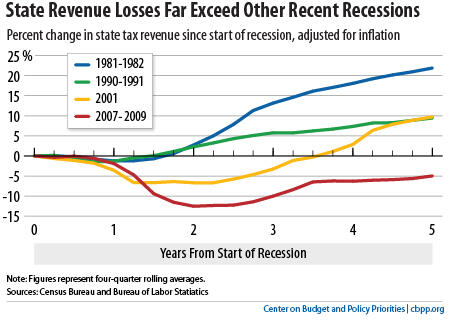
The second chart, below, shows that state tax revenues fell sharply during the Great Recession and still haven’t fully recovered. Nationally, revenues remain 5 percent below pre-recession (fiscal year 2008) levels, after adjusting for inflation. Until revenues have recovered further, new tax cuts — which several states are considering — would make it difficult to fund education, health care, and other programs.
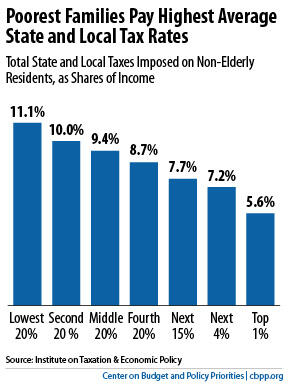
Every state taxes middle- and low-income families more than wealthy families, according to a recent report from the Institute on Taxation and Economic Policy (ITEP), on which the third chart, below, is based. This is one reason why recent proposals in some states to swap their income taxes for sales taxes would be ill-advised. Those proposals would only worsen tax systems that are already highly regressive.
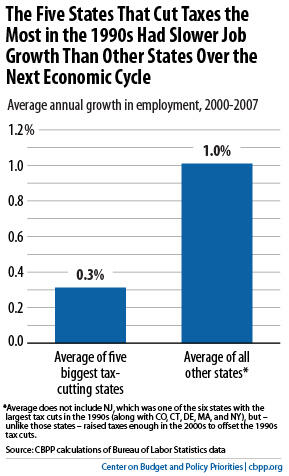
Cutting or eliminating state income taxes is also a poor strategy for promoting economic growth. As the fourth chart, below, shows, the five states that enacted the deepest tax cuts during the boom years of the middle and late 1990s saw job growth over the next full economic cycle (2000-2007) of less than 0.3 percent per year, on average, compared to 1.0 percent for the other states. They also had slower income growth than the rest of the nation on average.
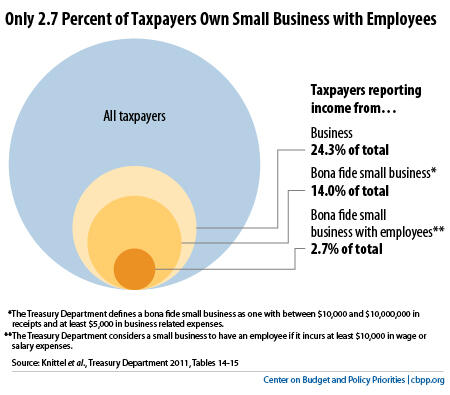
One of the most common arguments for income tax cuts is that they’d encourage small businesses to grow and create jobs, since most small firms pay taxes on their profits under the personal income tax. But, as the fifth chart shows, personal income tax cuts are a very poor way to stimulate job creation among small businesses: only 2.7 percent of personal income taxpayers own a bona fide small business with any employees other than the owner or owners, according to a Treasury Department study.