BEYOND THE NUMBERS
SNAP Caseloads Falling More Quickly in 2017
SNAP (formerly food stamp) caseloads and spending continue to fall in 2017, the latest Agriculture and Treasury Department data show. (See graph.) These drops counter some policymakers’ assertions that they need to cut SNAP deeply to curb its growth.
The proposed House Republican budget resolution would (as in past years) cut about $150 billion (or more than 20 percent) from the program over ten years to “restore overall SNAP funding to sustainable levels.” And President Trump’s budget proposes to cut SNAP by $193 billion over ten years to “right-siz[e] SNAP’s share of the budget.” The continuing SNAP declines show, however, that the program works as designed — it grows during slow economic times to meet higher poverty and increased need, and shrinks as the economy improves and poverty declines. SNAP isn’t contributing to the nation’s long-term budget challenge.
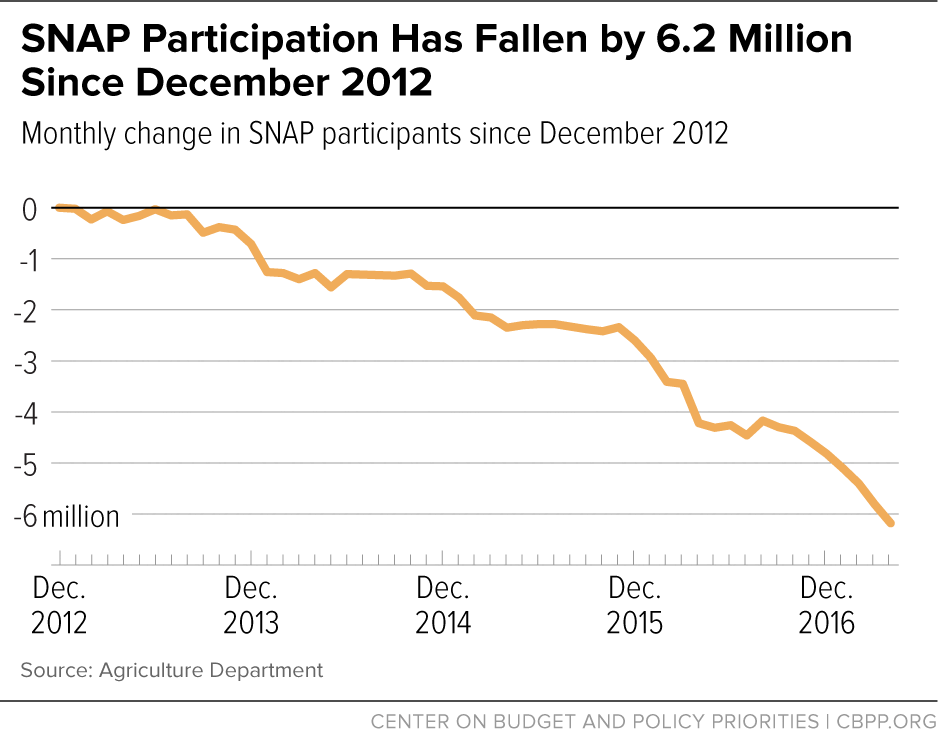
The number of SNAP participants fell by 1.8 million people over the first seven months of fiscal year 2017 (which began last October), nearly matching the decline over all 12 months of fiscal year 2016 (1.875 million). SNAP’s 41.6 million participants in April 2017, the most recent month for which data are available, are the fewest since mid-2010 and 13 percent, or 6.2 million, below the December 2012 peak.
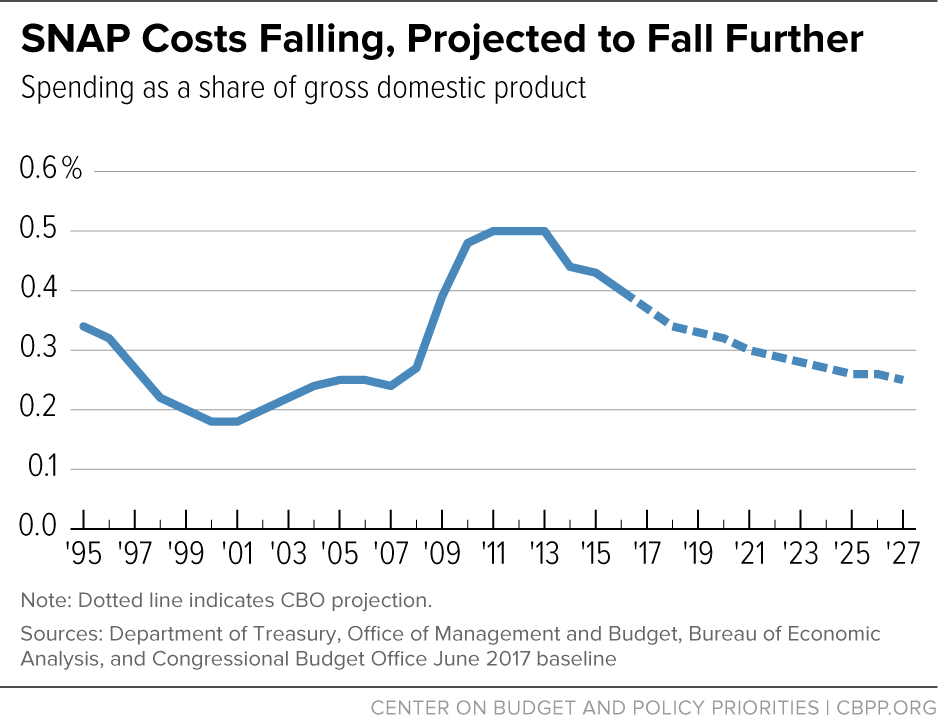
SNAP spending also continues to fall, for the fourth straight year. SNAP spending for the first nine months of this fiscal year was 4.3 percent below the same months last year, and almost 15 percent lower than the same months in 2013, when spending peaked. And these declines are in nominal — not inflation-adjusted — dollars.
SNAP caseloads have fallen in almost every state, as our updated infographic shows. The stronger economy likely explains most of the decline, though the return of a harsh three-month time limit on certain unemployed childless adults also is a contributing factor. Some 20 states reimplemented this time limit in some or all areas of their state in 2016. Compared to a year earlier, SNAP caseloads by the first quarter of calendar year 2017 had fallen by 6.5 percent in the states that reimplemented the time limit in 2016 compared to a 3.2 percent drop in the other states (i.e., those that reimplemented the time limit earlier or still had federal waivers from it due to high unemployment. We’ve excluded three states — Georgia, Kentucky, and Louisiana — from this analysis because other factors affect their caseload data in one or more of the months.)
Under the Congressional Budget Office’s (CBO) most recent projections of June, SNAP participation will continue to fall by about 1 to 2 percent annually over the next decade, from 42 million people in 2017 to 32 million in 2027. The share of the population receiving SNAP will return to close to 2007 levels (at about 9 percent) by 2027, CBO projects. As a result, CBO expects SNAP spending as a share of gross domestic product to fall every year, returning to its 1995 level by 2019. (See chart.)
To the extent that SNAP caseload declines reflect improving economic conditions for low-income households, they are welcome. However, the large drop in states that reimposed the time limit is troublesome, with the loss of benefits likely causing serious hardship for many.