BEYOND THE NUMBERS
Is Government Spending Really 41 Percent of GDP?
Chris Edwards from the Cato Institute generated some buzz recently by stating at a Joint Economic Committee hearing that government spending in the United States is 41 percent of gross domestic product (GDP). Although that’s right — by one yardstick for one year — it exaggerates the situation. Edwards used data from the Organisation for Economic Co-operation and Development (OECD), which makes several adjustments to the U.S. data that pump up the government’s percentage from levels we’re used to seeing. And Edwards picked a year when that figure is unusually high because of a weak economy.
Here’s what you need to know to put the numbers in context:
- The OECD numbers reflect spending by all levels of government. In the United States, that means federal, state, and local. (State and local governments’ spending — not counting what they get from federal grants for things like Medicaid and highways — is about a third of the total.)
- The OECD uses the United Nations’ System of National Accounts (SNA), which measures the government sector differently than we do in our national statistics. Most importantly, the SNAs count as government spending the gross cost of many public services that users help pay for, like state universities and public hospitals. (For example, the SNAs count the entire cost of running the public-university system, not just what legislators appropriate to supplement students’ tuition payments.) Those adjustments push up the SNAs’ measure of both spending and receipts by roughly 4 percent of GDP compared with the standard measure tallied by the Bureau of Economic Analysis (BEA) in the U.S. National Income and Product Accounts (see figure).
- Whether using the BEA or OECD measures, government spending jumped as a percent of GDP during the economic downturn. That’s not surprising. Automatic increases in safety-net programs like unemployment insurance and food stamps, plus that Congress enacted, pushed up the numerator (spending), even as a slumping economy squeezed the denominator (GDP). This happened in other countries, too.
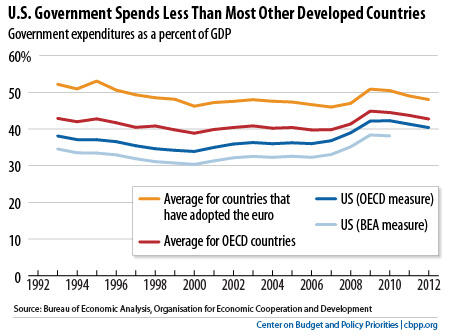
By the OECD’s measure, U.S. government spending topped 42 percent of GDP in 2009 and 2010 — when the economy hit bottom — and has slipped to 41 percent this year. The OECD forecast, made before the Budget Control Act took a deep bite out of spending, has this figure dropping to 40 percent in 2012. While the OECD forecast ends then, the Congressional Budget Office projects that federal spending will continue to decline through mid-decade as a percent of GDP.
Two other points are worth noting. First, this doesn’t mean that government controls about 40 percent of the U.S. economy. The bulk of government spending goes for payments to individuals through transfer programs such as Social Security, and most of the goods and services that people buy with these payments are privately produced.
Second, government spending in the United States — by the OECD’s broad measure—remains about 2 ½ percent of GDP below the OECD average, and about 8 percent below the average level among countries that have adopted the euro. While the United States faces plenty of long-run fiscal challenges, out-of-control spending today isn’t one of them.