BEYOND THE NUMBERS
Deep Poverty on the Rise
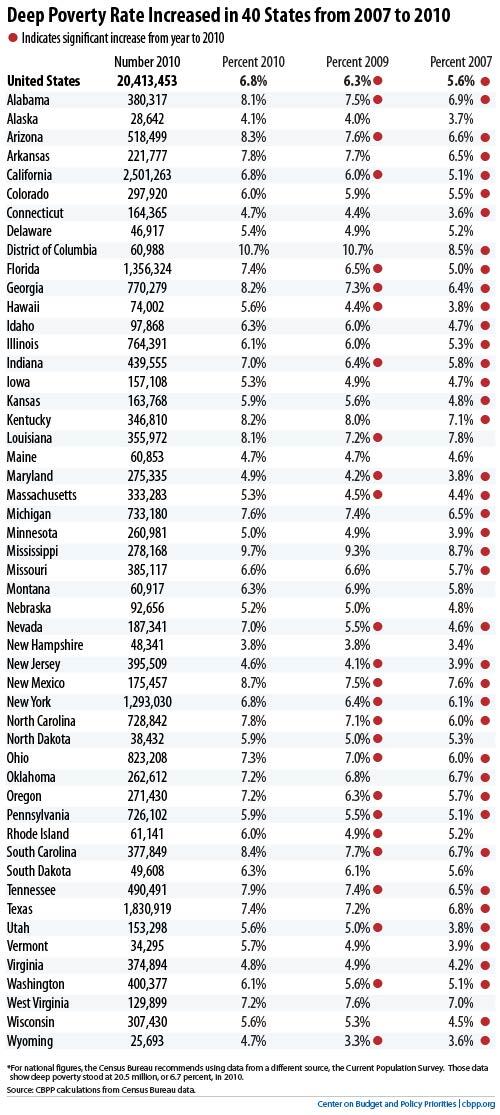
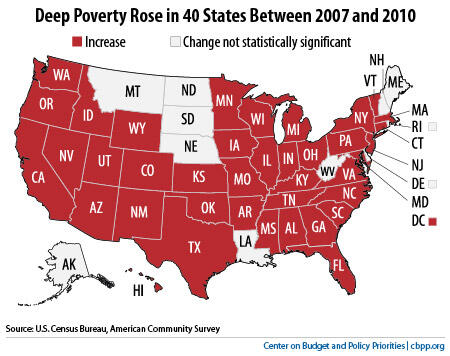
Deep poverty — that is, the share of the population with incomes below half the poverty line — rose by a statistically significant amount in 40 states (including the District of Columbia) from 2007 to 2010 and fell in none, Census Bureau data released today show.
Half of the poverty line corresponds to an income of $5,570 for an individual and $11,157 for a family of four.
The number of people in deep poverty rose to 20.4 million in 2010, up 4 million (25 percent) since 2007. The national poverty data that Census released last week, based on a different survey (see our analysis) showed that the deep poverty rate hit a record 6.7 percent in 2010, with data going back to 1975.
The states with the highest deep poverty rates in 2010 were Mississippi and New Mexico, at 9.7 percent and 8.7 percent, respectively. (The District of Columbia, which — unlike a state — consists entirely of a central city, had a deep poverty rate of 10.7 percent.) The largest increase in deep poverty since the start of the recession occurred in Nevada, where the rate rose from 4.6 percent in 2007 to 7.0 percent in 2010 — an increase of more than half.
Studies have found that deep poverty has a particularly strong negative effect on the education and development of young children. Even relatively small changes in incomes among low-income young children have been found to trigger significant changes in school achievement.
The new deep poverty figures, based on the Census Bureau’s official poverty definition, are for pre-tax cash income. They don’t include the value of tax credits or non-cash benefits such as SNAP (food stamps), which have increased in value since 1975. Alternative poverty data that Census will release next month will account for these benefits, as well as work expenses; we expect them to show a substantially smaller increase in deep poverty during the downturn, thanks in large measure to SNAP’s effective response to the increase in need.
But even if one accounts for tax credits and non-cash benefits, economists have found an increase in deep poverty over the last two decades, as we have noted. A major reason, they find, is that public safety-net expenditures have shifted away from those with the lowest incomes over the past two decades. For example, average safety-net benefits for out-of-work low-income families fell by 41 percent in inflation-adjusted terms between 1984 and 2004.