At Risk: Federal Grants to State and Local Governments
Programs for Low- and Moderate-Income Families Could Bear the Brunt of Cuts
These programs are too important to be considered as available resources that can be cut. Federal funds that go to state and local governments as grants help finance critical programs and services on which residents of every state rely.[1] These grants, and the programs they support, are at serious risk of being substantially diminished or eliminated, based on proposals from President Trump and congressional Republicans. These programs are too important, particularly to low- and moderate-income people, to be considered as available resources that can be cut — either immediately or over time — to reduce the overall budget, to pay for greater defense spending, or to finance other Administration priorities such as deep tax cuts for high-income people.
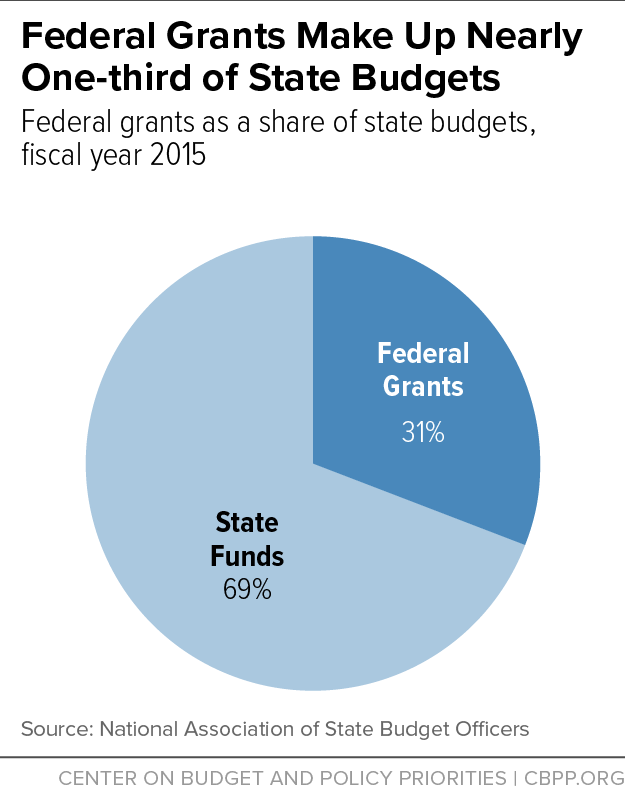
Grants matter to state and local budgets. Federal spending in the form of mandatory and discretionary grants accounts for a large share of state and local government revenues. Federal grants provide approximately 31 percent of state budgets. Considering state and local budgets together, federal funding provides 22 percent of spending.[2] The grants support health care, public education, housing, community development, child care, job training, transportation, and clean water, among other programs.
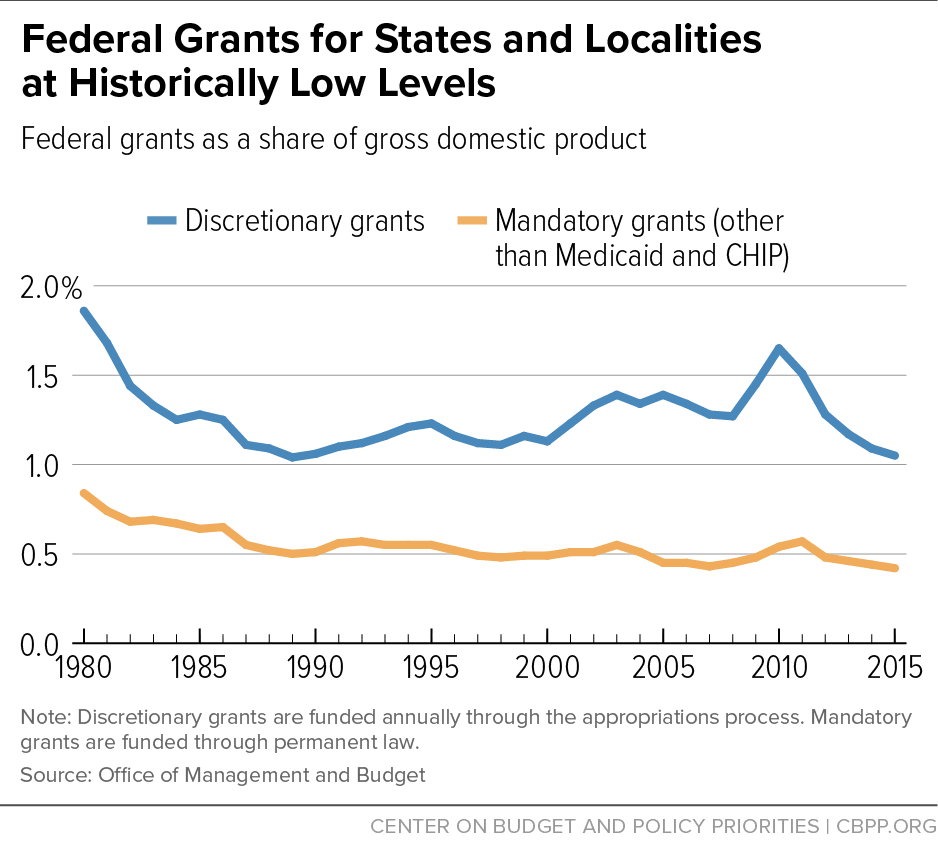
Grants are already at historically low levels. Grants from the mandatory (ongoing) portion of the federal budget for purposes other than Medicaid and the Children’s Health Insurance Program (CHIP) were at a lower share of the economy in 2015, at 0.42 percent of gross domestic product (GDP), than in any year since 1980.
Similarly, discretionary (annually appropriated) grants to state and local governments in federal fiscal year 2015 were 1.05 percent of GDP, lower than in all but one year since 1980. If the caps in the 2011 Budget Control Act (BCA), which were lowered by sequestration, remain in place, these grants will likely be cut further. The proposals expected this year to reduce domestic discretionary spending are likely to be in addition to the BCA reductions.
Grants are at risk, and states cannot absorb the magnitude of the potential cuts without reducing services. President Trump and Congress have proposed steep cuts in federal support for programs and services delivered by states and localities.
- Congressional Republicans are considering proposals that would cap Medicaid funding per beneficiary or under a block grant, as well as end the Affordable Care Act’s Medicaid expansion. These proposals are designed to make deep funding cuts that grow steeply over time, which would force states to limit eligibility or covered services for families, seniors, and people with disabilities now covered by Medicaid.
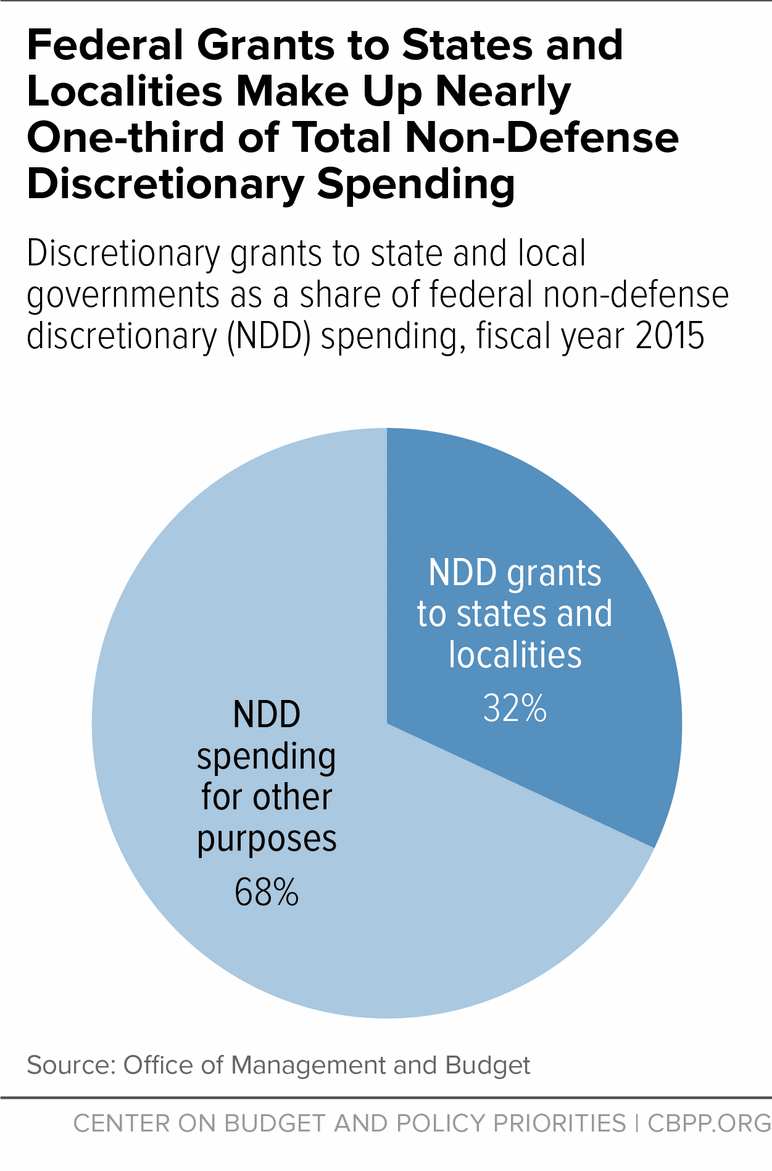
- The President’s forthcoming budget is reported to cut non-defense discretionary spending — the source of state and local discretionary grants — by $54 billion, and the 2017 budget that the Republican majority on the House Budget Committee approved last year would have cut $1 trillion out of non-defense discretionary spending over ten years. Grants to state and local governments make up nearly one-third of non-defense discretionary spending, and consequently would be severely reduced under these or similar scenarios.
Federal Grants Provide Large Share of State and Local Revenue
Following federal budget convention, the funding for grants to state and local governments comes from two parts of the federal budget: mandatory and discretionary. Combined, these federal grants provide approximately 31 percent of state budgets. (See Figure 1.) Considering state and local budgets together, federal funding provides 22 percent of spending.
Mandatory programs are set in ongoing federal law that remains in place until changed. Funding depends on formulas and eligibility requirements set in the law. Mandatory grants to state and local governments totaled $467 billion in federal fiscal year 2016. The vast majority — $385 billion, or 82 percent — was for Medicaid and CHIP. The remainder, $86 billion, funded a number of other programs important to families and children, some of which are described below.
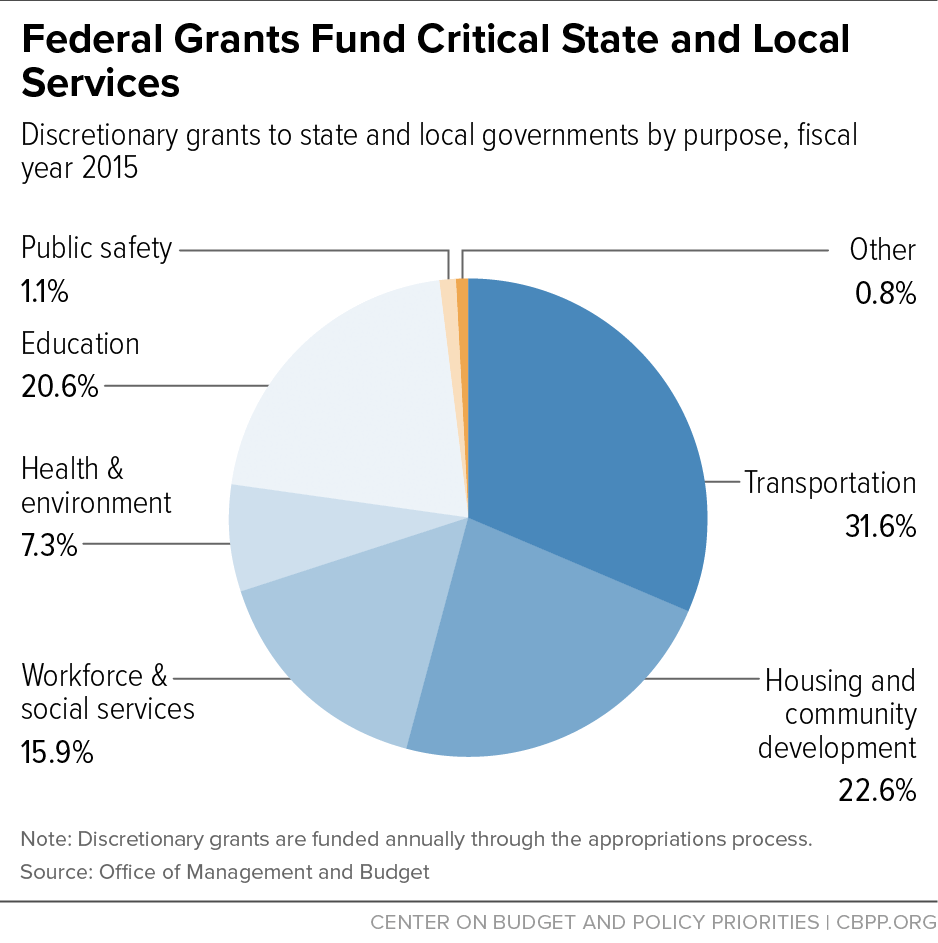
Federal spending for discretionary programs is appropriated annually. Grants to state and local governments come from the category known as non-defense discretionary programs. Discretionary grants to state and local governments are estimated to have totaled $199 billion in federal fiscal year 2016. The largest discretionary grant areas are transportation, including grants for highways, airports, and mass transit; education, including support to improve outcomes for low-income students and students with special needs; and programs to subsidize housing for low-income families and seniors and foster community development.
Mandatory Grants to States and Localities Include Critical Low-Income Programs
Mandatory grants provide funding for programs of particular importance to low- and moderate-income households, including children, seniors, and people with disabilities. Also known as entitlement programs, their benefits or services are available to anyone who meets their strict eligibility criteria, and funding increases automatically and immediately to respond to increased need. These programs include:
- Medicaid, which provides health coverage to low-income families and individuals, including children, parents, pregnant women, seniors, and people with disabilities. In general, the federal government picks up a fixed percentage of the cost — 57 percent, on average — although the federal percentage ranges from 50 percent in wealthier states to 75 percent in states with lower per-capita income. (For the Medicaid expansion, however, the federal government pays no less than 90 percent of the cost on a permanent basis). States pay the remainder. Approximately 74 million low-income Americans receive health insurance coverage through Medicaid.[3] Children make up one-half of Medicaid recipients, non-elderly adults are one-quarter, and seniors and people with disabilities another quarter. Three-quarters of non-elderly enrollees are in working families.
- CHIP, which covers uninsured children up to age 19 in families with incomes too high to qualify for Medicaid. In general, the federal government picks up 70 percent of the cost, on average (although the federal government is currently paying for 88 percent of the cost, on average, through 2019). More than 8 million children were enrolled in CHIP in 2015.[4]
- Child nutrition programs, which provide breakfast and lunch to low-income students in schools. During fiscal year 2015, some 30 million children ate a school lunch on a typical day, and 14 million children ate a school breakfast.[5]
- Child support enforcement and family support programs, which provide grants to states and tribes to engage in outreach, referral, case management, and other activities to increase parents’ ability and willingness to support their children. State and local child support agencies and the tribal child support agencies coordinate their work with other state or local programs, including Temporary Assistance for Needy Families (TANF), the Supplemental Nutrition Assistance Program (SNAP, formerly the Food Stamp Program), child welfare, workforce, veterans’, fatherhood, domestic violence, and prisoner re-entry programs. The Office of Child Support Enforcement calculates that every dollar spent resulted in $5.26 in child support collections in 2015.[6]
- Adoption and Foster Care Program, which helps to provide safe and stable out-of-home care for children until the children are safely returned home, placed permanently with adoptive families, or placed in other permanent arrangements. Funds awarded to states and tribes are available for monthly maintenance payments for the daily care and supervision of eligible children; administrative costs to manage the program; training of staff and foster care providers; recruitment of foster parents; and costs related to the design, implementation, and operation of a state-wide data collection system. Approximately 428,000 children nationwide were in foster care on September 30, 2015.[7]
- Child Care and Development Block Grant, which provides funds to states to finance high-quality child care for children with very low incomes whose parents work, are training for work, or attend school, and for children with special needs. There is both a mandatory and discretionary portion of this federal funding stream, and states provide matching funds. Together both funding streams provided child care services for 1.4 million children in 870,000 families in June 2016.[8]
- TANF, through which states provide cash assistance or other services such as child care to poor families with children or help support related programs such as foster care.
- Social Services Block Grant, which provides flexible funds states may use to support a wide variety of social services activities. The largest categories of expenditures under this grant are for child care, foster care, and special services for people with disabilities.[9]
Mandatory Grants Other Than Medicaid and CHIP Already at Low Level
Grants to state and local governments from the mandatory portion of the federal budget — other than for Medicaid and CHIP — are at a lower percentage of the economy than when President Reagan left office. In 1980, mandatory grants for purposes other than Medicaid and CHIP were 0.84 percent of GDP. When Reagan left office in 1989, they were 0.50 percent of GDP. By 2015, they were 0.42 percent of GDP — lower than any year since 1980 (rising only slightly to 0.46 percent of GDP in 2016).[10] (See Figure 2.)
In other words, investments in many programs critical to children and families’ well-being have already decreased. In part, this is because the funding for some of these programs, such as TANF and the Social Services Block Grant, has been either frozen at a nominal level or not increased over time relative to need.
Past proposals from congressional Republicans would have further reduced mandatory grants. And now there are proposals from House Republicans that would impose a per capita cap on Medicaid or convert it into a block grant, both of which would result in deep cuts to the program and shift significant costs and risks to states.[11]
The history of block grants for housing, health, and social services shows that when social programs are merged into or created as block grants, funding typically contracts in subsequent years and decades, with the reductions growing over time. For example, the TANF block grant declined 44 percent, in inflation-adjusted terms, between its first year in 1998 and 2017. Funding for the Social Services Block Grant has declined 81 percent since its creation in 1982, adjusted for inflation.[12]
A block grant would cap overall federal funding for a state’s Medicaid program, while a per capita cap would cap federal Medicaid funding per beneficiary. In each case, the state would be responsible for all costs above the cap; neither cap would respond to increased needs, as Medicaid now does. For example, under a per capita cap, states would be responsible for bearing the additional costs from faster-than-expected health care cost growth, a public health emergency, or the growing health care needs of aging baby boomers.[13] Under a block grant, states would also be responsible for increased need for Medicaid during recessions.
The magnitude of the federal funding cuts and resulting cost-shift to states would likely be substantial. For example, a preliminary estimate of the House Republican proposal to convert Medicaid to a per capita cap would cut federal Medicaid funding by $116 billion over ten years, relative to current law. Such cuts would likely force states to cut eligibility, benefits, and payments to providers in order to operate their programs with so much less funding.[14]
Moreover, repealing the Affordable Care Act’s Medicaid expansion, as some congressional Republicans support, would cut funding for the states that have adopted the expansion, requiring states to pay an estimated $253 billion more over ten years to sustain the expansion. At least 11 million people who receive health insurance through the Medicaid expansion would be at risk of losing their coverage and becoming uninsured.[15]
Beyond Medicaid, spending on other mandatory programs could be at risk if Congress uses the budget process known as reconciliation to enact tax cuts and seeks to offset them through reduced spending on mandatory programs. The revenue loss from a tax cut in reconciliation — the use of which requires that the package not increase the deficit after ten years — can be offset in only two ways: by raising other taxes or cutting mandatory programs.
The tax plan that President Trump issued during the campaign and the House Republican tax plan would both cut taxes deeply, to the benefit of the wealthy. Under the Trump plan, 48 percent of the tax cut would go to households with income over $1 million in 2025.[16] Under the House GOP “A Better Way” plan, nearly all of the tax cuts would go to households with incomes over $1 million in 2025; low- and middle-income households would gain only slightly. Over the next decade, millionaires would receive an estimated $2.6 trillion in tax cuts.[17] Meanwhile, cuts in mandatory programs to pay for the tax cuts would likely fall heavily on low- and middle-income families with children and on seniors.
Vital Discretionary Grants to State and Local Governments Also at Risk
Many discretionary grants are important to low- and moderate-income families and communities. (See Figure 3.) These grants must be appropriated every year. Among the programs these discretionary grants support are:
Education
- High-Poverty Schools (Title I), which are grants for schools with high numbers or proportions of disadvantaged children that help such children meet academic standards. In state fiscal year 2011-12, Title 1 served more than 18 million children in more than 51,000 schools.[18]
- Special Education in the schools (Individuals With Disabilities Education Act, or IDEA).[19] In 2013-14, IDEA funds served 6.5 million children, representing 12.9 percent of public school enrollment.[20]
- Other important education programs include preschool programs provided through Head Start, which enrolled 945,000 children in fiscal year 2015;[21]programs to improve teacher quality; and Impact Aid, which provides support to school districts that include parcels of land that are owned by the federal government or that have been removed from the local tax rolls by the federal government, including Native American lands.
Health
- Special Supplemental Nutrition Program for Women, Infants, and Children (WIC). WIC provides nutritious food and nutritional education (including breastfeeding education and support) to new and expecting low-income mothers, including those with children under age 5. In an average month in fiscal year 2016, the program — delivered by thousands of agencies and health clinics across the country — served 1.8 million low-income women and nearly 6 million infants and children.[22]
- Mental health and substance abuse services. These grants help states prevent and treat alcohol and drug abuse and provide community mental health services to adults and children with serious mental illnesses. In state fiscal year 2016, 1.58 million people were given care for opioid addiction under the grant, including inpatient and outpatient detoxification, rehabilitation, and opioid replacement therapy.[23]
- Community Health Centers. These nonprofit facilities provide primary care and preventative medical services to low-income people and medically underserved communities. In 2016, health centers provided services to 25 million patients in 9,800 communities as a key partner with Medicaid to improve outcomes and reduce costs.[24]
Training, Employment, and Social Services
- Training and Employment Services, which provide employment assistance, labor market information, and job training through programs such as the Workforce Investment and Opportunity Act, Job Corps, and apprenticeship.
- Child care. As discussed above, there are both mandatory and discretionary portions of the Child Care and Development Block Grant, which provide child care services in a typical month for 1.4 million children in 870,000 families.
- Children and Family Services programs, which fund grants to states for child protective services, family preservation, foster care, adoption, and related activities.[25]
Housing and Community Development
- Low Income Home Energy Assistance (LIHEAP), which provides people in need with help paying their home energy bill. Approximately 6.3 million households received assistance in fiscal year 2014. Nearly one-third of households receiving assistance had at least one member aged 60 years or older, about 38 percent of the households included a member with a disability, and 19 percent included at least one child aged 5 or under.[26]
- Rental assistance for low-income people, which includes the Housing Choice Voucher Program and the Project-Based Rental Assistance Program (collectively called “Section 8”), and public housing. Approximately 2.2 million households receive vouchers that are used to defray part of the rent on a modest apartment or other home in the private retail market. Roughly half of the low-income households benefiting include seniors or people with disabilities; most of the rest are families with children.[27] Another 1.1 million households receive rental assistance to live in project-based, privately owned affordable housing. And another 1.1 million households live in public housing, for which they typically pay 30 percent of their income (after deductions) for rent and utilities. About half of the residents of public housing are elderly or have disabilities.[28]
- Community Development Block Grants. States, cities, and counties use these funds to revitalize deteriorating neighborhoods, create jobs through the expansion and retention of businesses, improve water and sewer systems, and build community centers, youth centers, and libraries, as well as a range of other public infrastructure projects. Not less than 70 percent of CDBG funds must be used for activities that benefit low- and moderate-income persons.[29]
Transportation, Public Safety, Natural Resources, and Environment
- The federal government provides a variety of types of discretionary grants for airports, highways, and mass transit, including grants for building infrastructure, maintenance, and improvements in safety. Grants also support passenger rail service and pipeline safety. Unlike other types of discretionary grants, transportation expenditures are outside of the spending caps set by the BCA and exempt from sequestration (see below). That does not mean, however, that they are exempt from cuts. Past congressional Republican budget proposals have included transportation cuts.[30]
- In the area of public safety, discretionary grants support state and local law enforcement, juvenile justice programs, community-oriented policing programs, prevention and prosecution of violence against women, and combating drug trafficking.
- Grants that support preservation of natural resources and the environment include support for the Fish and Wildlife Service and grants to states and tribes from the Environmental Protection Agency.
Discretionary Grants at Historically Low Levels, at Risk for Further Cuts
Like mandatory grants other than Medicaid and CHIP, discretionary grants to state and local governments also have been declining over time. Under the BCA, which first set annual funding caps for non-defense discretionary programs and subsequently lowered the caps through a process called sequestration, discretionary grants to state and local government have fallen 39 percent relative to the economy, from 1.65 percent of GDP in 2010 to 1.05 percent in 2015. That 2015 level was lower than in all but one year since 1980. (See Figure 2.) If the tight BCA funding caps as lowered by sequestration remain in place as planned, these grants will likely be cut further.
Beyond the BCA, policymakers have made proposals that would result in draconian cuts to non-defense discretionary spending. Discretionary grants to state and local governments comprise 32 percent of total non-defense discretionary spending and would be at risk for deep cuts under these scenarios. (See Figure 4.)
For example, President Trump’s forthcoming budget may include a reported $54 billion cut in non-defense discretionary spending as a way to pay for an equivalent increase in defense spending. And the House Budget Committee-approved 2017 budget would have slashed non-defense discretionary programs over ten years by roughly $1 trillion below the already austere levels set by the BCA and sequestration. The “Penny Plan” that President Trump proposed during his campaign would reduce non-defense discretionary programs by about 29 percent from current levels by 2026,[31] after accounting for inflation, so the $54 billion may just be the first salvo, with further cuts to come. These or similar plans would cut discretionary grants to state and local governments far below previous record lows and imperil the programs and services these grants fund, with the effects falling heavily on vulnerable individuals and families.
States Cannot Absorb These Potential Federal Funding Cuts
State and local governments do not have the funds to replace the magnitude of funds that could be lost through cuts to mandatory and discretionary spending. Many states are experiencing revenue shortfalls this year, and struggle in most years to find adequate revenues to support services. In all likelihood, states and localities will be forced to scale back or eliminate services and programs for families, seniors, and people with disabilities, rather than raise their own funds to continue the programs at their current level.
Moreover, even if they did raise some taxes to continue fully funding some affected programs, low-income residents would bear the consequences. State and local tax systems are, on the whole, regressive (that is, they fall harder on lower-income residents than on high-income ones). Shifting responsibilities for funding services from the federal government, which has a progressive tax system, to states and localities would increase the burden on many of the same low-income people who would be at risk of losing services.
Appendix
| TABLE 1 | ||
|---|---|---|
| Federal Grants to States, State Fiscal Year 2016 | ||
| State | Federal Grants to States (Millions) |
Federal Grants to States as Share of State Spending |
| Alabama |
$10,135
|
38.3%
|
| Alaska |
$3,302
|
31.1%
|
| Arizona |
$15,809
|
38.9%
|
| Arkansas |
$7,301
|
30.6%
|
| California |
$96,129
|
36.2%
|
| Colorado |
$9,486
|
26.3%
|
| Connecticut |
$6,122
|
19.7%
|
| Delaware |
$2,151
|
21.0%
|
| Florida |
$24,921
|
31.8%
|
| Georgia |
$13,394
|
28.2%
|
| Hawaii |
$2,563
|
18.5%
|
| Idaho |
$2,905
|
36.6%
|
| Illinois |
$16,810
|
30.0%
|
| Indiana |
$12,448
|
39.6%
|
| Iowa |
$6,349
|
28.0%
|
| Kansas |
$4,023
|
25.9%
|
| Kentucky |
$12,182
|
37.3%
|
| Louisiana |
$10,338
|
34.9%
|
| Maine |
$2,536
|
31.5%
|
| Maryland |
$11,549
|
28.0%
|
| Massachusetts |
$9,751
|
16.1%
|
| Michigan |
$22,728
|
41.6%
|
| Minnesota |
$11,494
|
30.1%
|
| Mississippi |
$9,592
|
43.0%
|
| Missouri |
$7,677
|
31.2%
|
| Montana |
$2,370
|
37.1%
|
| Nebraska |
$2,989
|
25.7%
|
| Nevada |
$3,984
|
34.6%
|
| New Hampshire |
$2,162
|
37.4%
|
| New Jersey |
$17,440
|
29.1%
|
| New Mexico |
$7,375
|
40.8%
|
| New York |
$49,476
|
32.8%
|
| North Carolina |
$13,007
|
29.3%
|
| North Dakota |
$1,779
|
22.1%
|
| Ohio |
$12,450
|
18.5%
|
| Oklahoma |
$7,656
|
33.7%
|
| Oregon |
$10,317
|
27.8%
|
| Pennsylvania |
$27,153
|
34.8%
|
| Rhode Island |
$3,065
|
31.7%
|
| South Carolina |
$7,710
|
33.4%
|
| South Dakota |
$1,364
|
33.7%
|
| Tennessee |
$12,793
|
38.8%
|
| Texas |
$44,956
|
35.3%
|
| Utah |
$3,815
|
27.8%
|
| Vermont |
$2,016
|
36.2%
|
| Virginia |
$9,901
|
20.1%
|
| Washington |
$11,507
|
27.9%
|
| West Virginia |
$3,340
|
20.7%
|
| Wisconsin |
$10,796
|
23.6%
|
| Wyoming |
$1,308
|
16.6%
|
| United States |
$602,424
|
31.2%
|
| TABLE 2 | |
|---|---|
| Medicaid Grants to States, Federal Fiscal Year 2016 | |
| State | Federal Medicaid Funding by State (Thousands) |
| Alabama |
$4,228,202
|
| Alaska |
$1,060,996
|
| Arizona |
$9,138,727
|
| Arkansas |
$5,363,228
|
| California |
$55,158,572
|
| Colorado |
$5,063,899
|
| Connecticut |
$4,582,253
|
| Delaware |
$1,384,096
|
| District of Columbia |
$2,156,918
|
| Florida |
$13,964,879
|
| Georgia |
$6,760,281
|
| Hawaii |
$1,511,312
|
| Idaho |
$1,426,622
|
| Illinois |
$11,030,133
|
| Indiana |
$9,310,021
|
| Iowa |
$3,273,678
|
| Kansas |
$2,036,981
|
| Kentucky |
$8,500,784
|
| Louisiana |
$5,611,326
|
| Maine |
$1,729,074
|
| Maryland |
$6,150,223
|
| Massachusetts |
$10,215,520
|
| Michigan |
$13,481,742
|
| Minnesota |
$7,036,878
|
| Mississippi |
$4,227,529
|
| Missouri |
$6,789,301
|
| Montana |
$816,994
|
| Nebraska |
$1,062,547
|
| Nevada |
$2,672,745
|
| New Hampshire |
$1,307,665
|
| New Jersey |
$9,351,823
|
| New Mexico |
$4,689,065
|
| New York |
$38,358,580
|
| North Carolina |
$9,699,984
|
| North Dakota |
$939,767
|
| Ohio |
$16,523,349
|
| Oklahoma |
$3,382,730
|
| Oregon |
$7,758,965
|
| Pennsylvania |
$18,195,140
|
| Rhode Island |
$1,798,758
|
| South Carolina |
$4,576,918
|
| South Dakota |
$500,872
|
| Tennessee |
$7,097,070
|
| Texas |
$23,836,973
|
| Utah |
$1,846,548
|
| Vermont |
$1,255,021
|
| Virginia |
$4,742,423
|
| Washington |
$9,230,698
|
| West Virginia |
$3,227,817
|
| Wisconsin |
$5,252,265
|
| Wyoming |
$354,926
|
| TABLE 3 | ||
|---|---|---|
| Grants Provided to States and Localities from Discretionary Spending, Federal Fiscal Year 2016 | ||
| State | Amount (millions) |
Percent of Total State Grants |
| Alabama |
$ 2,384
|
1.7%
|
| Alaska |
1,268
|
0.9%
|
| Arizona |
2,684
|
1.9%
|
| Arkansas |
1,494
|
1.0%
|
| California |
16,135
|
11.2%
|
| Colorado |
2,036
|
1.4%
|
| Connecticut |
1,753
|
1.2%
|
| Delaware |
513
|
0.4%
|
| District of Columbia |
798
|
0.6%
|
| Florida |
7,121
|
5.0%
|
| Georgia |
4,351
|
3.0%
|
| Hawaii |
940
|
0.7%
|
| Idaho |
765
|
0.5%
|
| Illinois |
6,192
|
4.3%
|
| Indiana |
2,772
|
1.9%
|
| Iowa |
1,372
|
1.0%
|
| Kansas |
1,234
|
0.9%
|
| Kentucky |
2,121
|
1.5%
|
| Louisiana |
2,392
|
1.7%
|
| Maine |
687
|
0.5%
|
| Maryland |
2,404
|
1.7%
|
| Massachusetts |
3,001
|
2.1%
|
| Michigan |
4,269
|
3.0%
|
| Minnesota |
2,298
|
1.6%
|
| Mississippi |
1,657
|
1.2%
|
| Missouri |
2,731
|
1.9%
|
| Montana |
862
|
0.6%
|
| Nebraska |
904
|
0.6%
|
| Nevada |
1,113
|
0.8%
|
| New Hampshire |
553
|
0.4%
|
| New Jersey |
4,073
|
2.8%
|
| New Mexico |
1,192
|
0.8%
|
| New York |
11,278
|
7.9%
|
| North Carolina |
3,859
|
2.7%
|
| North Dakota |
631
|
0.4%
|
| Ohio |
4,902
|
3.4%
|
| Oklahoma |
1,791
|
1.2%
|
| Oregon |
1,787
|
1.2%
|
| Pennsylvania |
5,878
|
4.1%
|
| Rhode Island |
706
|
0.5%
|
| South Carolina |
2,062
|
1.4%
|
| South Dakota |
691
|
0.5%
|
| Tennessee |
2,771
|
1.9%
|
| Texas |
11,364
|
7.9%
|
| Utah |
1,149
|
0.8%
|
| Vermont |
507
|
0.4%
|
| Virginia |
3,154
|
2.2%
|
| Washington |
2,912
|
2.0%
|
| West Virginia |
1,102
|
0.8%
|
| Wisconsin |
2,392
|
1.7%
|
| Wyoming |
566
|
0.4%
|
End Notes
[1] This report uses the federal Office of Management and Budget classification of grants to state and local governments. In a few cases, that includes some programs in which federal funding in part or in whole goes directly to non-government providers. Examples include Head Start and Job Corps.
[2] National Association of State Budget Officers, “State Expenditure Report, Fiscal 2014-2016,” December 2016, http://nasbo.org/reports-data/state-expenditure-report and U.S. Census Bureau, “2014 State and Local Government Finances,” December 9, 2016, https://www.census.gov/govs/local/.
[3] Kaiser Family Foundation, “Medicaid Pocket Primer,” January 3, 2017, http://kff.org/medicaid/fact-sheet/medicaid-pocket-primer/.
[4] Centers for Medicare and Medicaid Services, “FFY 2015 Number of Children Ever-Enrolled in Medicaid and CHIP,” May 2, 2016, https://www.medicaid.gov/chip/downloads/fy-2015-childrens-enrollment-report.pdf. State-by-state data available.
[5] Zoë Neuberger, “School Meals Block Grant Proposal Gambles with Children’s Basic Nutrition,” Center on Budget and Policy Priorities, May 17, 2016, https://www.cbpp.org/blog/school-meals-block-grant-proposal-gambles-with-childrens-basic-nutrition.
[6] Office of Child Support Enforcement, “FY 2015 Annual Report to Congress,” January 12, 2017, https://www.acf.hhs.gov/css/resource/fy-2015-annual-report-to-congress. State-by-state data available.
[7] U.S. Department of Health and Human Services, Administration for Children and Families, Administration on Children, Youth and Families, Children’s Bureau, “The AFCARS Report,” No. 23, June 2016, https://www.acf.hhs.gov/sites/default/files/cb/afcarsreport23.pdf
[8] U.S. Department of Health and Human Services, Administration for Children and Families, “FY 2014 Final Data Table 1 – Average Monthly Adjusted Number of Families and Children Served,” November 1, 2016, https://www.acf.hhs.gov/occ/resource/fy-2014-final-data-table-1. This table represents the number funded through the Child Care and Development Fund, which includes federal discretionary, mandatory, and matching funds; TANF transfers to CCDF; and state matching and maintenance-of-effort funds. State-by-state data available here. Updated monthly.
[9] Karen E. Lynch, “Social Services Block Grant: Background and Funding,” Congressional Research Service, January 14, 2015, https://digital.library.unt.edu/ark:/67531/metadc809646/m1/3/.
[10] Office of Management and Budget, “Public Budget Database – Outlays,” February 27, 2017, https://obamawhitehouse.archives.gov/omb/budget/Supplemental.
[11] Edwin Park et al., “House Republican Proposals to Radically Overhaul Medicaid Would Shift Costs, Risks to States,” Center on Budget and Policy Priorities, February 24, 2017, https://www.cbpp.org/research/health/house-republican-proposals-to-radically-overhaul-medicaid-would-shift-costs-risks-to.
[12] David Reich et al., “Block-Granting Low-Income Programs Leads to Large Funding Declines Over Time, History Shows,” Center on Budget and Policy Priorities, February 22, 2017, https://www.cbpp.org/research/federal-budget/block-granting-low-income-programs-leads-to-large-funding-declines-over-time.
[13] Edwin Park, “Medicaid Per Capita Cap Would Shift Costs and Risks to States and Harm Millions of Beneficiaries,” Center on Budget and Policy Priorities, revised February 27, 2017, https://www.cbpp.org/research/health/medicaid-per-capita-cap-would-shift-costs-and-risks-to-states-and-harm-millions-of.
[14] Edwin Park, Aviva Aron-Dine, and Matt Broaddus, “House Republican Health Plan Shifts $370 Billion in Medicaid Costs to States,” Center on Budget and Policy Priorities, March 8, 2017, https://www.cbpp.org/research/health/house-republican-health-plan-shifts-370-billion-in-medicaid-costs-to-states.
[15] Ibid.
[16] Robert Greenstein, Chye-Ching Huang, and Isaac Shapiro, “Revised Trump Tax Plan Heavily Tilted Toward Wealthiest, Tax Policy Center Analysis Shows,” Center on Budget and Policy Priorities, October 11, 2016, https://www.cbpp.org/research/federal-tax/revised-trump-tax-plan-heavily-tilted-toward-wealthiest-tax-policy-center.
[17] Isaac Shapiro, Chye-Ching Huang, and Richard Kogan, “House GOP Framework Would Give Millionaires $2.6 Trillion in Tax Cuts, While Cutting Programs for Low- and Moderate-Income People by $3.7 Trillion,” Center on Budget and Policy Priorities, September 29, 2016, https://www.cbpp.org/research/federal-tax/house-gop-framework-would-give-millionaires-26-trillion-in-tax-cuts-while.
[18] National Center for Education Statistics, “Schools and Staffing Survey: 2011-12, Table 1,” 2011, https://nces.ed.gov/surveys/sass/tables/sass1112_2013312_s2s_001.asp. State-by-state data available here.
[19] U.S. Department of Education, “Special Education – Grants to States, Program Description,” May 5, 2016, https://www2.ed.gov/programs/osepgts/index.html.
[20] National Center for Education Statistics, “Students with Disabilities Fast Facts,” 2016, https://nces.ed.gov/fastfacts/display.asp?id=64.
[21] Early Childhood Learning & Knowledge Center, “Head Start Program Facts, Fiscal Year 2015,” February 2017, https://eclkc.ohs.acf.hhs.gov/hslc/data/factsheets/docs/head-start-fact-sheet-fy-2015.pdf. This fact sheet includes state-by-state data.
[22] USDA Food and Nutrition Service, “WIC Program, Monthly Data—State Level Participation by Category and Program Costs,” February 2017, https://www.fns.usda.gov/pd/wic-program. Includes state-by-state data.
[23] U.S. Department of Health and Human Services, Substance Abuse and Mental Health Services Administration, Block Grant Reporting Section, Fiscal Year 2016-2017 Block Grant Application and Plan, Table 10, https://www.cbpp.org/sites/default/files/atoms/files/2-24-17health2.pdf. Includes state-by-state data.
[24] National Association of Community Health Centers, “Health Centers and Medicaid Fact Sheet,” December 2016, http://nachc.org/wp-content/uploads/2016/12/Medicaid-FS_12.16.pdf. Includes state-by-state data.
[25] U.S. Department of Health and Human Services, Administration for Children and Families, Administration on Children, Youth and Families, Children’s Bureau, “Report to Congress on State Child Welfare Expenditures,” 2014, https://www.acf.hhs.gov/sites/default/files/cb/cfs101_report_congress_2014.pdf. Some state by state expenditure numbers are at the end of this document.
[26] U.S. Department of Health and Human Services, Administration for Children and Families, Administration for Children and Families, Office of Community Services, Division of Energy Assistance, “Low Income Home Energy Assistance Program, Report to Congress for Fiscal Year 2014,” 2015, https://www.acf.hhs.gov/sites/default/files/ocs/fy14_liheap_rtc_final.pdf. Includes state-by-state data.
[27] Alicia Mazzara, “Housing Choice Vouchers Provide Essential Assistance in Every State,” Center on Budget and Policy Priorities, July 26, 2016, https://www.cbpp.org/blog/housing-choice-vouchers-provide-essential-assistance-in-every-state. State-by-state data available here: Center on Budget and Policy Priorities, “National and State Housing Fact Sheets,” July 2016, https://www.cbpp.org/research/housing/national-and-state-housing-fact-sheets-data.
[28] Center on Budget and Policy Priorities, “Policy Basics: Public Housing,” May 31, 2016, https://www.cbpp.org/research/policy-basics-public-housing.
[29] U.S. Department of Housing and Urban Development, “Community Development Block Grant Program – CDBG,” February 2017, https://portal.hud.gov/hudportal/HUD?src=/program_offices/comm_planning/communitydevelopment/programs.
[30] For example, the 2014 House-passed budget cut transportation projects by about 8 percent — about $5 billion — relative to 2013 levels adjusted for inflation. Over the next ten years, it would have required about $139 billion in cumulative cuts to state and local transportation aid, relative to current levels adjusted for inflation — a 23 percent cut.
[31] Richard Kogan and David Reich, “Trump ‘Penny Plan’ Would Mean Large Cut in Non-Defense Spending,” Center on Budget and Policy Priorities, September 15, 2016, https://www.cbpp.org/research/federal-budget/trump-penny-plan-would-mean-large-cut-in-non-defense-spending.
More from the Authors

Areas of Expertise