Deep Poverty Among Children Rose in TANF’s First Decade, Then Fell as Other Programs Strengthened
Stronger Income Support Policies Needed to Make Further Progress
A close examination of the effectiveness of economic security programs, using more complete income figures than are widely available, reveals that policy shifts in aid for children in families with the least income have had a significant impact. In the decade after policymakers altered the public assistance system in the mid-1990s, it became much less effective at protecting children from deep poverty — that is, at lifting their incomes above half of the poverty line — and children’s deep poverty rose. But during the Great Recession, assistance policies for children in poverty and deep poverty grew stronger, bolstered by temporary recovery initiatives, and prevented what likely would have been a large surge in deep poverty among children.
"During the Great Recession, assistance policies for children in poverty and deep poverty grew stronger, bolstered by temporary recovery initiatives, and prevented what likely would have been a large surge in deep poverty among children."Deep poverty among children remains a significant problem. Some 2 million children live in families with income and benefits (net of taxes paid) below half the poverty line, or below just $14,000 a year for a typical family of four. To make significant progress in protecting children from this level of economic hardship will require strengthening income supports for families in deep poverty, including those where parents are out of work, either temporarily or over a longer period.
Our analysis finds:
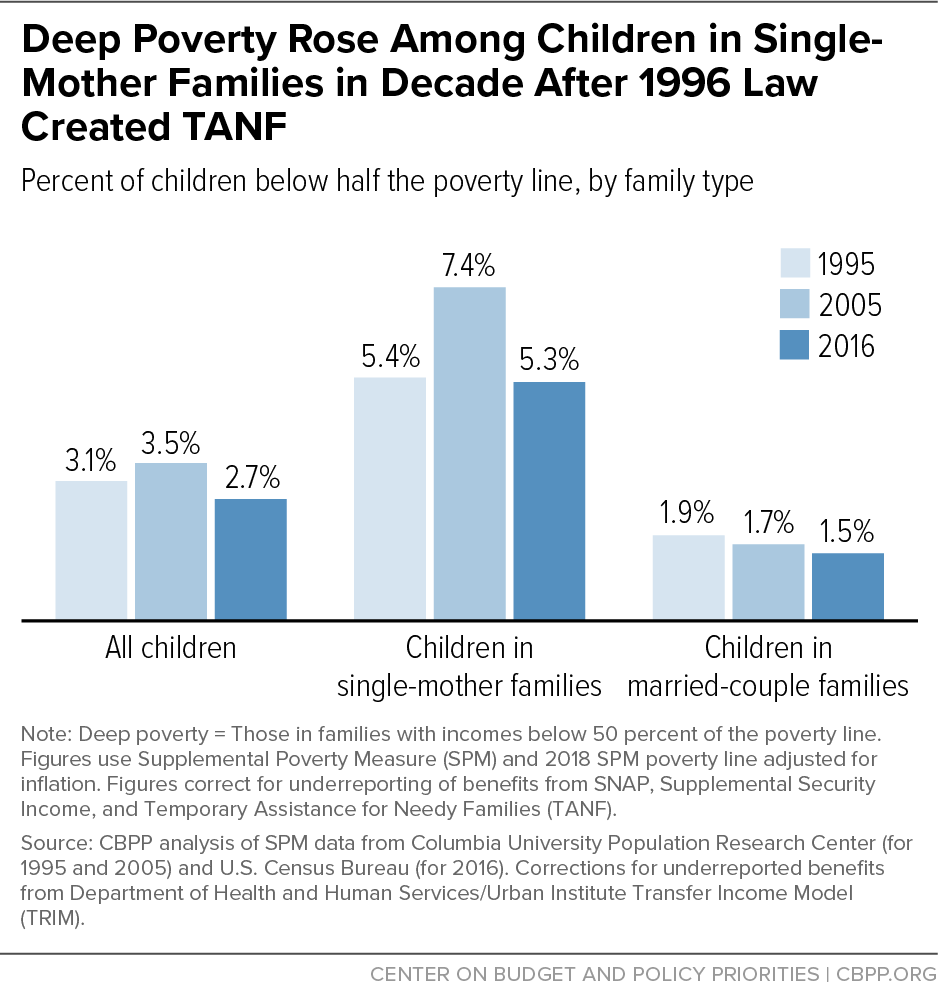
- The deep poverty rate among children rose in the decade after the 1996 law that created the Temporary Assistance for Needy Families (TANF) program, from 3.1 percent in 1995 to 3.5 percent in 2005. All of the increase occurred among the children most affected by the 1996 law: those in single-mother families. In 2005, an additional 300,000 children lived in deep poverty due to this increase.
- Deep poverty among children was lower in 2016 (2.7 percent) than in 2005 (3.5 percent), due to stronger government assistance programs and, since the Great Recession, an improving economy. However, government assistance programs did less in 2016 than they did two decades earlier, in 1995, to reduce deep poverty among children. Among children whose families were below half the poverty line before counting benefits from economic security programs, those benefits lifted 79 percent of them above half the poverty line in 2016, as opposed to 82 percent of such children in 1995.
- In contrast to the trends in deep poverty, overall child poverty fell between 1995 and 2005 and government assistance became more effective at lifting children above the poverty line. In 2005, government programs lifted 34 percent of children above the poverty line who’d otherwise be below it, as opposed to 24 percent in 1995. These contrasting trends suggest a shift in the focus of government assistance, away from helping children in families with the least income and toward those modestly higher on the income ladder. Between 2005 and 2016, government assistance programs continued to strengthen and helped drive the overall child poverty rate down further.
- While a majority of children in deep poverty in 2016 lived in single-parent families, and immigration status, race, and disability were other key risk factors, the group was diverse. Nearly half (45 percent) lived in the suburbs, for example.
- Twice as many children would live in deep poverty without the food assistance that the Supplemental Nutrition Assistance Program (SNAP, formerly food stamps) provides. SNAP lifted 1.9 million children above half of the poverty line in 2016, more than any other program.
These findings emerge from a comprehensive assessment of poverty that blends the Supplemental Poverty Measure (SPM) — which counts more forms of income than the “official” poverty measure (among other differences) and therefore more accurately reflects the resources available to low-income households — with corrections for underreporting of key government benefits in survey data. The SPM counts income from SNAP, rental subsidies, and other federal non-cash benefits and refundable tax credits, which the official poverty measure omits. The SPM also subtracts federal and state income taxes, federal payroll taxes, and certain expenses (such as child care) from income when calculating a family’s available income for basics such as food, clothing, and shelter. A family is considered poor if its resources are below a poverty threshold that accounts for differences in family composition and geographic differences in housing costs. Our analysis ends in 2016 since that’s the most recent year for which we have data that correct for underreporting of key government benefits.
We created a poverty series merging data files from the Census Bureau’s Current Population Survey (CPS) with historical SPM data produced by a Columbia University research team[1] and corrections for underreporting created by the Urban Institute. We use the Census Bureau’s SPM data for 2009 through 2016, and the Columbia SPM data for prior years. Our poverty series uses the 2018 SPM poverty line, adjusted in years before for inflation.[2] In 2018, the deep poverty threshold (defined as half of the SPM poverty line) for a two-adult, two-child family renting in an average-cost community was $14,083.
We provide a fuller picture of the public income support system for low-income families by correcting for the underreporting of key government benefits in the Census data.[3] These corrections expose the increase in deep poverty for children during the first decade after the creation of TANF. This increase is masked in the uncorrected data because changes in the degree of underreporting make it appear that benefits fell less than they actually did. (See Appendix II for more details.) One final adjustment to our data addresses the concern that some people who appear to be in deep poverty are self-employed business owners who may possess substantial assets but are experiencing temporary business losses. To reduce this concern, this report omits families with negative cash income from our counts of families in deep poverty.
The National Academy of Sciences, in its landmark report on child poverty released last year, used the same survey data and the same source for corrections for underreporting of key government benefits that we use in this report.[4]
Our findings are consistent with other recent academic research showing that deep poverty among children declined between 1993 and 2016.[5] Our analysis, however, provides a closer — and more troubling — view of the years and families most affected by the 1996 law. By doing this, we can identify the kinds of policies that raise or lower deep poverty and highlight policy changes that could help the 2 million children living in families below half of the poverty line.
Our findings are also consistent with earlier evaluations of the impact of imposing work requirements on cash assistance recipients. Evidence from welfare-to-work pilot programs in the early 1990s — based on rigorous, random-assignment study design and with income measured carefully using administrative records — showed that those programs tended to increase deep poverty. Those programs were, if anything, less harsh than the 1996 law. See Appendix I for more details.
Deep Poverty Among Children Rose in First Decade After 1996 Law
The decade from 1995 to 2005 is the most suitable period for examining the effects of the 1996 law that replaced Aid to Families with Dependent Children (AFDC), which had chiefly served families with little or no earnings, with TANF, which offers less assistance and includes stricter work requirements and time limits. This decade extends from the year before the law’s enactment until ten years later, when its major changes had mostly played out and before significant additional changes in low-income policies began blunting its negative impact on deep poverty. Further, 1995 and 2005 had similar overall unemployment rates and represent similar stages in the business cycle;[6] comparing years with similar economic conditions makes it easier to see the effects of policy changes.
We estimate that the share of children in deep poverty rose from 3.1 percent to 3.5 percent between 1995 and 2005. (See Figure 1.) The number of children in deep poverty climbed from 2.2 million to 2.6 million.
Children in single-mother families,[7] who make up the majority of TANF participants, showed a large increase in deep poverty rates from 1995 to 2005: from 5.4 percent to 7.4 percent. In contrast, the deep poverty rate appeared to fall slightly for children in married-couple families, although the change was not statistically significant.
Our finding that deep poverty rose for children in single-mother families during TANF’s first decade is consistent with administrative caseload data showing that the number of families receiving cash assistance (most of whom are single-parent families) fell by 2.7 million from 1995 to 2005, even though the number of single mothers without a job fell by only 0.4 million.[8]
Rise in Deep Poverty Largely Reflected TANF’s Weakening as Safety Net
Deep poverty for children rose in the decade after 1995 largely because government benefits became less effective at protecting children from deep poverty. In 1995, public benefits lifted above half of the poverty line 82 percent of children who otherwise would have been in deep poverty; by 2005, this figure had dropped to 74 percent. The main reason was the loss of cash assistance following the 1996 law.
The number of families served by AFDC/TANF fell by more than half from 1995 to 2005,[9] largely due to the 1996 law’s policies taking away cash assistance when a parent didn’t meet a work requirement, imposing time limits, erecting access barriers that made it hard for families to apply for and be approved for benefits, and making other changes. As a result, TANF cash assistance programs served a shrinking share of families with children in poverty over the decade.[10] The value of TANF benefits per recipient also fell: the maximum benefit for a three-person family in the median state declined 18 percent from January 1996 to January 2005, after adjusting for inflation.
In 1995, AFDC lifted 2.8 million children out of deep poverty. In 2005, TANF lifted only 700,000 children out of deep poverty, and in 2016 it lifted only 300,000. (See Figure 2.)
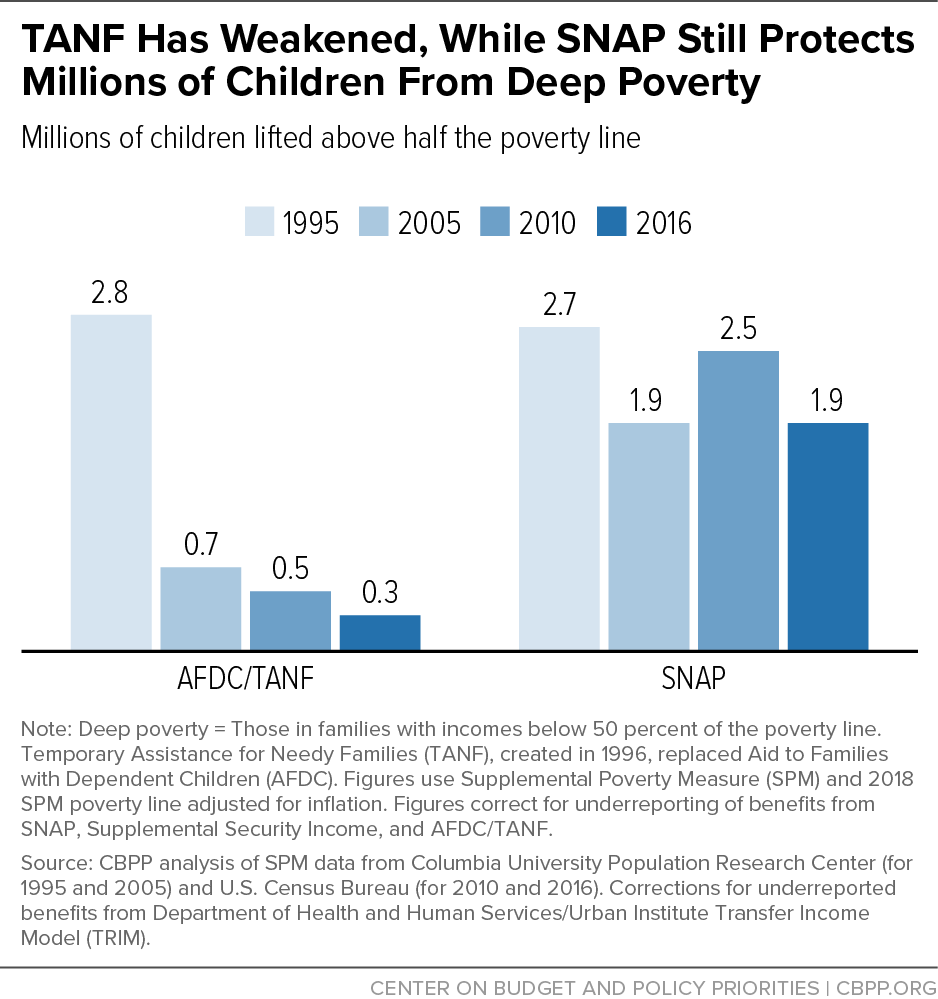
The 1996 law also imposed large cuts on SNAP and other programs, further weakening the safety net for families with the least income. The SNAP cuts included both across-the-board benefit reductions and targeted eligibility changes that denied benefits to many legal immigrants, unemployed childless adults, and others. While policymakers later restored some of the SNAP cuts, others remain in place. Another reason why SNAP rolls dropped sharply in TANF’s initial years is that families traditionally had enrolled in SNAP and cash assistance jointly; as cash assistance plummeted, many families also stopped receiving SNAP despite remaining eligible. As a result, the number of children whom SNAP lifted out of deep poverty fell from 2.7 million in 1995 to 1.9 million in 2005.
Overall Poverty Rate Among Children Fell in TANF’s First Decade
In contrast to deep poverty, overall child poverty fell between 1995 and 2005, from 21.9 percent to 16.0 percent. This decline reflected increases both in earnings and in the effectiveness of government assistance at lifting children above the poverty line. In 2005, government programs lifted 34 percent of children above the poverty line who’d otherwise be below it, as opposed to 24 percent in 1995.
These contrasting trends suggest there was a shift in the focus of government assistance, away from helping children in families with the least income (particularly with regard to TANF) and toward those modestly higher on the income ladder (particularly with the expansion of tax credits for low- and modest-income working families). Leading academic experts have noted this shift as well.[11] See Appendix Table 2 for more detailed data on deep and overall poverty trends for children and the effect of government assistance.
More Recently, Stronger Programs Helped Reduce Deep Poverty Among Children
The deep poverty rate among children fell from 3.5 percent in 2005 to 2.7 percent in 2016. This decline was largely driven by the improved anti-poverty effectiveness of government assistance programs other than TANF. In 2016, public benefits lifted above half of the poverty line 79 percent of children who would otherwise have been in deep poverty, up from 74 percent in 2005. (Of note, however, the 2016 figure still fell short of the 1995 figure of 82 percent. If government assistance programs had been as effective at lifting children above half the poverty line in 2016 as in 1995, some 300,000 fewer children would have lived in families in deep poverty.)
A key reason that government assistance became more effective between 2005 and 2016 at protecting children from deep poverty is that SNAP became significantly more effective: in 2016 it lifted 49 percent of children above half the poverty line who would otherwise have been in deep poverty, up from 42 percent in 2005. In contrast, TANF’s effectiveness continued declining: in 2016 it lifted just 13 percent of children who would otherwise have been in deep poverty above half the poverty line, down from 22 percent in 2005.
Stronger economic security programs helped prevent deep poverty among children from rising during the Great Recession. In fact, the deep poverty rate among children dropped from 3.2 percent to 2.6 percent between 2007 (the year before the recession took hold) and 2010 (the year after it officially ended but when the job market remained weak). A major reason was SNAP, which lifted more children out of deep poverty during the recession due to a combination of factors: the sharp increase in the number of eligible families as household incomes declined, bipartisan measures to improve program access that helped raise the participation rate among eligible households, and the 2009 Recovery Act’s temporary benefit increase, which expired in November 2013.[12]
The benefits from SNAP’s increased effectiveness during the Great Recession went well beyond reducing deep poverty among children. After the 2009 Recovery Act raised SNAP benefits, low-income households’ food spending rose and food insecurity fell.[13] This shows that increasing struggling families’ economic security can have immediate, positive impacts.
More broadly, the important steps that policymakers took to supplement economic security programs’ responsiveness during the Great Recession, including expanding tax credits and unemployment insurance as well as SNAP,[14] blunted the recession’s poverty-related impacts, shielding millions from falling into poverty or deep poverty.
Government Assistance Also Doing More to Reduce Overall Child Poverty
In terms of reducing overall child poverty, government assistance programs continued to strengthen over the last two decades. In 2016 they lifted above the poverty line 49 percent of children who would otherwise have been below it, compared to 34 percent in 2005 and 24 percent in 1995. This improvement helped drive the overall child poverty rate to record lows in the late 2010s.[15]
Deep Poverty Increased Among Black and Latino Children in TANF’s First Decade
All children, regardless of race or ethnicity, should have the opportunity to thrive. Yet steep barriers remain for families of color, including discrimination and bias in the labor market and in government policies. These factors contributed to Black and Latino children experiencing a higher increase in deep poverty than white children between 1995 and 2005.
In the first decade under the 1996 law, the deep poverty rate for Black and Latino children rose from 4.9 percent in 1995 to 6.3 percent in 2005;[16] among white children it appeared to dip slightly (from 2.2 percent to 1.8 percent), although the drop was not statistically significant. (See Figure 3.) Unequal declines in the government’s effectiveness at protecting children from deep poverty largely explain these trends. In 1995, public benefits lifted above half the poverty line 86 percent of Black and Latino children who would otherwise have been in deep poverty; by 2005, this figure had fallen to 74 percent. The comparable figure for white children remained statistically unchanged over this period.[17]
Among Black children specifically, the deep poverty rate rose from 4.1 percent in 1995 to 5.8 percent in 2005. This was largely because public assistance became less effective at protecting Black children from deep poverty: the share of Black children otherwise in deep poverty whom public assistance lifted above half the poverty line fell from 89 percent in 1995 to 81 percent in 2005. Black families were at particular risk of deep poverty as economic security programs weakened, partly because they lacked equal access to employment opportunities and because of historical and ongoing racial disparities in the design and implementation of government assistance policies. Similarly, Black families face steeper barriers to finding and keeping good jobs due to historical and ongoing discrimination in education, employment, and wages.[18] One study, for example, found that job candidates with white-sounding names were 50 percent more likely to make it to the interview stage than comparable candidates with Black-sounding names.[19]
Another reason why public assistance lifted a shrinking share of Black children out of deep poverty is the decline in TANF’s reach, which disproportionately harmed Black families. The 25 states where AFDC/TANF caseloads declined by more than 75 percent between 1995 and 2016 were home to 61 percent of the nation’s Black children in 1995, compared to 48 percent of white children.[20] TANF policy changes that cut families’ income, such as establishing harsher sanctions for failure to meet program requirements, were also implemented in racially discriminatory ways. Nearly every study comparing the race and ethnicity of sanctioned and non-sanctioned TANF recipients finds that Black recipients are significantly more likely to be sanctioned than their white counterparts.[21] In a direct test of racial bias, when asked whether they would sanction a fictional client with multiple violations of program requirements, TANF caseworkers (whether white or Black) were much more likely to sanction a Black client than an otherwise-identical white client.[22]
For Latino children, the 1996 law’s reduction in access to government assistance for immigrant families had a major effect on deep poverty. In 1995, 55 percent of Latino children lived in a family that included a non-citizen and 12 percent were non-citizens themselves. For Latino children living in a family that included a non-citizen, deep poverty rose from 6.0 percent in 1995 to 8.7 percent in 2005. For Latino children who were non-citizens themselves, deep poverty rose from 8.4 percent to 14.9 percent over that period.
These increases were driven by the decline in the effectiveness of public assistance at protecting these children from deep poverty. In 1995, public benefits lifted above half of the poverty line 82 percent of Latino children who lived in a family with a non-citizen and would otherwise have been in deep poverty; by 2005, this figure had dropped to 56 percent. For non-citizen Latino children, the drop was even larger, from 77 percent in 1995 to 41 percent in 2005. For citizen Latino children in families where everyone is a citizen, the decline was smaller, from 83 percent to 75 percent; their increase in family earnings outweighed the drop in the effectiveness of government assistance, and their likelihood of living in deep poverty appeared to fall from 5.4 percent to 4.6 percent between 1995 and 2005, although this drop was not statistically significant. Overall, deep poverty for Latino children appeared to increase between 1995 and 2005, from 5.8 percent to 6.8 percent, also not a statistically significant change.
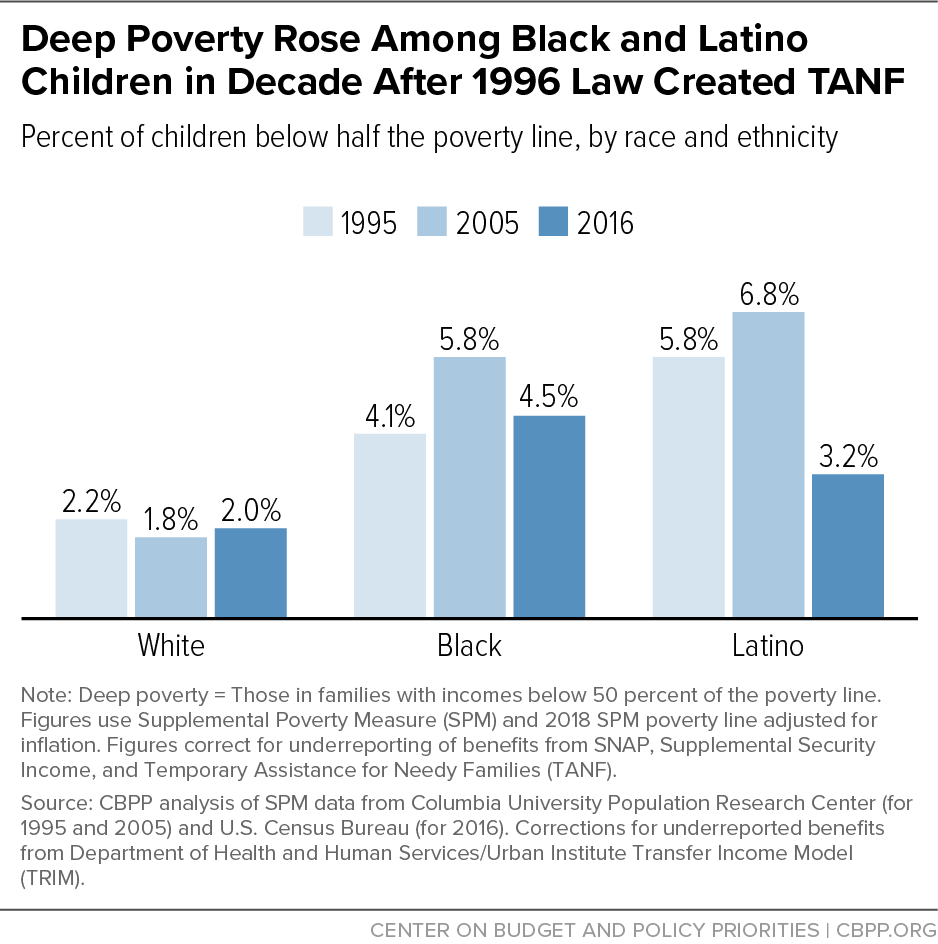
More recently, deep poverty rates receded for Black and Latino children due to stronger economic security programs and an improving economy, but racial disparities remain high. For Black children, the rate was lower in 2016 (4.5 percent) than in 2005 (5.8 percent) but remained twice the rate for non-Hispanic white children (2.0 percent). For Latino children, deep poverty fell to 3.2 percent in 2016, the lowest since 1993, when these data (which correct for underreporting) begin. Latino children living in families that include a non-citizen particularly benefited from bipartisan efforts to reverse some of the 1996 law’s immigration-related restrictions on government assistance; deep poverty among Latino children living in a family that includes a non-citizen fell to 4.1 percent in 2016, also the lowest since 1993. Nevertheless, government policies could do far more to undo the harmful legacies of past racism and the damage from continuing racial bias and discrimination.
2 Million Children Living in Deep Poverty Are Diverse Group
About 2 million children, or 2.7 percent of all children, lived in deep poverty in 2016 when using the SPM and data that correct for the underreporting of key government benefits. These figures are lower than those using uncorrected SPM data or the official poverty measure for two reasons.[23] Using the SPM lowers deep poverty by accounting for non-cash benefits such as SNAP and housing assistance, which are often particularly important for families with cash incomes far below the poverty line. Correcting for underreported benefits lowers deep poverty further by accounting for more of the assistance that households receive.
Children living in deep poverty are a diverse group and face varying challenges. In 2016:
- 37 percent were white, 30 percent were Latino, 23 percent were Black, and 6 percent were Asian;
- 45 percent lived in suburban areas, 32 percent in urban areas, and 11 percent in rural areas;
- 51 percent lived in a single-mother family, 37 percent in a married-couple family, and 6 percent in a single-father family,
- 16 percent lived in a family where someone had a work-limiting disability; and
- 89 percent were U.S. citizens and 31 percent lived in a family with a non-citizen.
However, deep poverty is far more likely for some children than for others. In 2016:
- The deep poverty rate was 4.5 percent for Black children, 3.5 percent for Asian children, 3.2 percent for Latino children, and 2.0 percent for white children.
- The deep poverty rate for children was 3.1 percent in urban areas, 2.7 percent in suburban areas, and 2.2 percent in rural areas.
- Children in single-mother families had a deep poverty rate of 5.3 percent, versus 3.1 percent for children in single-father families and 1.5 percent for children in married-couple families.
- The deep poverty rate for children in a family where someone had a work-limiting disability was 3.8 percent, versus 2.6 percent for children in families where no one had a work-limiting disability.
- The deep poverty rate was 10.8 percent for non-citizen children, 3.6 percent for citizen children in families with a non-citizen, and 2.5 percent for citizen children.
SNAP Protects More Children From Deep Poverty Than Any Other Program
SNAP lifted 1.9 million children out of deep poverty in 2016, almost twice as many as any other government assistance program. (See Figure 4.) SNAP’s effectiveness against deep poverty reflects its targeting the largest benefits to families with the least income and its high participation rate. An estimated 95 percent of eligible individuals living with children participated in SNAP in 2017.[24]
The next most important program protecting children from deep poverty is Social Security, which lifted 1.1 million children out of deep poverty in 2016. Social Security for children often replaces earnings for a breadwinner who has died or become disabled so that they cannot work; without Social Security to replace that income, the family would fall below half of the poverty line. Social Security can also reduce poverty for children living in a family that includes a retiree who receives Social Security benefits.
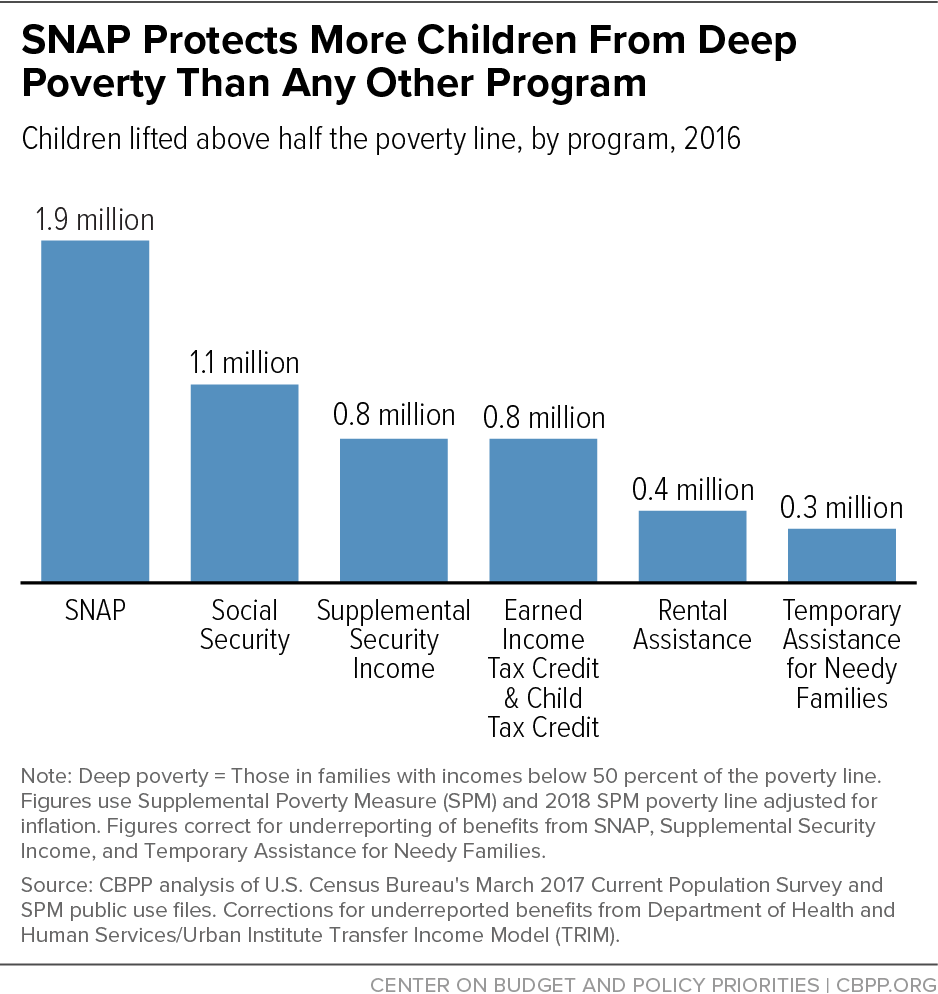
Rental assistance programs reach relatively few eligible households due to limited funding — 10 million people in 5 million low-income households in 2016, well below several other major government programs — but protect from deep poverty a larger share of those children they reach. Rental assistance lifted above half the poverty line 98 percent of children receiving rental assistance who otherwise would have been in deep poverty without this assistance. The next-highest program by this measure is Social Security, at 89 percent.
Policy Changes Could Sharply Reduce Deep Child Poverty
The experience of the last two decades shows that government policies can have a large impact on the number of children with family incomes below half of the poverty line. While deep poverty among children fell between 2005 and 2016, economic security programs do less today than in 1995 to protect children from deep poverty. To make more substantial progress in reducing the number of children in deep poverty will require further action.
A groundbreaking report from a National Academies of Sciences (NAS) committee that Congress charged with recommending ways to reduce child poverty found that either of two separate policy packages could cut children’s deep poverty — as well as child poverty overall — in half.[25] One plan expanded SNAP benefits, housing vouchers, the Earned Income Tax Credit (EITC), and child care assistance. The other plan created a “child allowance” of $2,700 a year per child, expanded the EITC and child care assistance, created a child support assurance program, ended certain restrictions on lawfully present immigrants’ eligibility for government assistance, and raised the minimum wage.
Comparing elements from these packages, the three policy changes with the largest impact on reducing child deep poverty are creating a child allowance, increasing SNAP benefits, and expanding housing vouchers.
One way to essentially create a child allowance would be to make the Child Tax Credit fully refundable — that is, fully available to children in low-income families regardless of whether their families have earnings. This idea is gaining some momentum among policymakers. The credit now provides little or no help to millions of children in families with the least income — those who need it most. Making it fully refundable would allow children in lower-income households, including those with little or no income, to benefit fully from it.
The American Family Act of 2019, introduced by Rep. Rosa DeLauro, Senator Michael Bennet, and others, would reduce deep child poverty by over 40 percent by making the full $2,000-per-child Child Tax Credit fully refundable and expanding it further, especially for children under age 6. The Working Families Tax Relief Act, introduced in 2019 by Senators Sherrod Brown, Michael Bennet, Richard Durbin, and Ron Wyden, would reduce deep child poverty by more than one-third by making the Child Tax Credit fully refundable, expanding it for young children, and expanding the EITC.[26] (The two bills have a number of features in common; the American Family Act would reduce deep child poverty somewhat more, while the Working Families Tax Relief Act would reduce poverty more among adults not raising children.) As a down payment on these approaches, the House Ways and Means Committee in 2019 approved Chairman Richard Neal’s Economic Mobility Act, which would make the Child Tax Credit fully refundable for the next two years and enhance the credit for children under age 4, while also expanding the EITC.
Raising SNAP benefits also would reduce deep child poverty substantially. Research links receipt of SNAP benefits with long-term advances in health and well-being,[27] but roughly half of all households participating in SNAP are still “food insecure,” meaning they lack consistent access to enough food to support an active, healthy life.[28] This suggests that SNAP’s quite-modest benefits — which average less than $1.40 per person per meal — may not be sufficient to meet the needs of families in poverty. Additional benefits would increase families’ food spending and improve food security.[29] The NAS report finds that a 35 percent increase in the SNAP maximum benefit would, by itself, reduce the number of children in deep poverty by more than one-fourth.[30]
Similarly, stable affordable housing is essential to families’ economic stability and children’s healthy development. Research shows that housing vouchers reduce hardship, and particularly benefit young children whose families use the vouchers to move to low-poverty, high-opportunity areas.[31] Due to inadequate funding, however, just 1 in 4 families with children eligible for housing assistance receives it.[32] The NAS report finds that providing vouchers to more low-income families with children, so that 70 percent of the eligible families with children not currently receiving housing assistance finally get it, would itself reduce the number of children in deep poverty by more than one-fourth.[33] A separate study finds that creating an additional 500,000 housing vouchers for families with children under age 6 — and assisting them in moving to high-opportunity areas — could largely eliminate homelessness among families with young children and substantially reduce the number of children growing up in neighborhoods of concentrated poverty.[34]
Increasing the number of families receiving TANF and the amount of direct cash assistance they receive would also lessen deep poverty. TANF reached just 23 families for every 100 families with children in poverty in 2017, down from 68 in 100 families in 1996; if TANF had the same reach as it did upon its creation in 1996, about 2.5 million more families nationwide would have received cash assistance in 2017.[35] TANF benefit levels have declined as well; in 33 states they have dropped by at least 20 percent in inflation-adjusted value since 1996.[36] In a positive trend, 14 states plus the District of Columbia have raised benefits since July 2018; New Hampshire has set its benefit level at 60 percent of the poverty line and California is on a path to increase benefits to about half of the poverty line. More states should follow their lead.
Reducing Deep Poverty Among Children Would Bring Long-Term Benefits
“[P]overty in early childhood, prolonged poverty, and deep poverty are all associated with worse child and adult outcomes,” the NAS committee explained. Moreover, the weight of the evidence indicates that “income poverty itself causes negative child outcomes, especially when poverty occurs in early childhood or persists throughout a large portion of childhood.”
Research indicates that toxic stress — the activation of the body’s stress response system when a child experiences frequent, persistent, or excessive fear or anxiety due to abuse, neglect, violence, or severe hardship — can pose serious risks for young children, whose brains are in a critical stage of development. Leading researchers at Harvard’s Center on the Developing Child explain that the early years of life are a “period of both great opportunity and great vulnerability.”[37] Children in poverty have significantly higher rates of harmful stress than other children, research shows.[38]
The NAS panel noted that reducing child poverty — especially deep or prolonged poverty among young children — should provide longer-term benefits for both children and society by leading to reductions in future medical expenditures and other costs of poverty and by increasing the children’s earnings and contributions to the economy in adulthood.[39] Research suggests that various economic security programs not only help families address their basic needs today, but also can have longer-term positive effects on children, improving their health and helping them do better (and go farther) in school, thereby boosting their expected earnings as adults.[40] The better outcomes linked with stronger income assistance include healthier birth weights, lower maternal stress (measured by reduced stress hormone levels in the bloodstream), better childhood nutrition, higher school enrollment, higher reading and math test scores, higher high school graduation rates, less use of drugs and alcohol, more positive behavior, and higher rates of college entry, the committee noted.
Deep Poverty Is Key Indicator of Well-Being of Children in Lowest-Income Families
Some researchers interested in measuring the well-being of children in families with the least income have focused on extreme poverty, usually defined as income below $2 per person per day.a This paper focuses on deep poverty, another relevant indicator of the well-being of children at the bottom of the income distribution.
Using an extreme poverty threshold can be revealing when analyzing trends in monthly cash income. It can show the number of people who could not get by without significant non-cash assistance and help document the degree to which certain groups of individuals lack cash income support. However, most families with children with very low cash incomes receive enough non-cash benefits — like SNAP — to keep them above the extreme poverty measure of $2/day when those benefits are considered. Using that standard alone to examine how many families with children struggle on very meager total (cash and non-cash) incomes would miss many families with significant resource deficits. For that reason, it is also important to consider families whose total resources are above $2/day but well below the poverty line.
For a four-person family, a $2/day threshold amounts to $2,920 per year. If that family received the maximum SNAP benefit for just five months of the year, this by itself would lift them above the annual extreme poverty threshold. Therefore, it’s not surprising that if one counts SNAP benefits, some have found that the number of children in extreme poverty falls to near zero on an annual basis; this just shows that SNAP participation is high for families with very low incomes. It’s also not surprising that those below the extreme poverty threshold are mostly childless adults or immigrants, since both groups face eligibility restrictions in SNAP.
A bipartisan consensus among federal policymakers to improve eligible households’ access to SNAP led to program changes in 2002 and 2008 that, along with state administrative improvements, raised program participation. For eligible families with children and incomes below half of the poverty line, participation is close to 100 percent.b
a For examples of this literature, see Luke Shaefer and Kathryn Edin, “Rising Extreme Poverty in the United States and the Response of Federal Means-Tested Transfer Programs,” Social Service Review, 2013, http://npc.umich.edu/publications/u/2013-06-npc-working-paper.pdf; Zach Parolin and David Brady, “Extreme Child Poverty and the Role of Social Policy in the United States,” Journal of Poverty & Social Justice, 2019, https://osf.io/preprints/socarxiv/u5ecn/; Bruce D. Meyer et al., “The Use and Misuse of Income Data and Extreme Poverty in the United States,” National Bureau of Economic Research Working Paper 25907, May 2019, http://www.nber.org/papers/w25907. Meyer et al. make additional assumptions about who can be considered in monthly extreme poverty. For example, they assume that no one with home equity above $25,000 a year is in extreme poverty, and that individuals’ annual earnings are spread equally across every month of the year even when that is not the case.
b Karen Cunnyngham, “Trends in Supplemental Nutrition Assistance Program Participation Rates: Fiscal Year 2010 to Fiscal Year 2016,” U.S. Department of Agriculture, July 2018, https://fns-prod.azureedge.net/sites/default/files/snap/Trends2010-2016.pdf.
Appendix I: Work Requirements for Cash Assistance Fueled Rise in Deep Poverty, Rigorous Evidence From 1990s Shows
A rise in deep poverty is consistent with earlier findings about the impact of imposing work requirements on cash assistance recipients. Rigorous random-assignment evidence from welfare-to-work pilot programs in the early 1990s showed that those programs — which were, if anything, less harsh than the 1996 nationwide legislation — tended to increase deep poverty.[41]
The largest federally funded study of work-requirement pilot programs for cash assistance recipients in the 1990s examined 11 programs — local forerunners of the work requirements in the 1996 welfare law. Most raised employment rates somewhat in the short term, but many recipients did not find work and many families were pushed off the program or had their benefits reduced by sanctions. As a result, deep poverty rose by a statistically significant amount in six of the 11 programs — and fell significantly in none — relative to randomly assigned control groups. (See Appendix Figure 1.)
The pilot programs were similar to the policies established under TANF but were generally less punitive toward low-income families. For example, the pilot programs excluded more families with young children from work requirements than TANF did, exempted recipients with substantial employment barriers, and required fewer hours of participation per week.
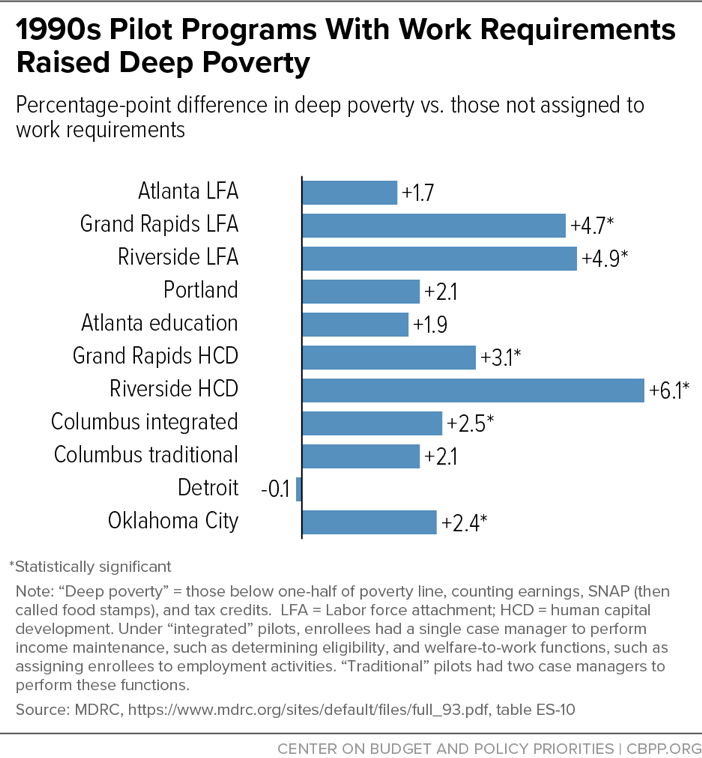
The findings reflect the most rigorous form of evidence: a comparison between program participants and control groups randomly assigned to more traditional welfare programs, which reveals the impact of the pilot programs distinct from other factors (such as the shifting economy). To measure income carefully, the evaluators used agencies’ administrative benefits data and employers’ payroll records rather than individuals’ recollections on a survey, which can be imprecise.
The findings also showed that work requirements can raise deep poverty even while, in some cases, reducing the share of participants below the poverty line. One program in particular (Riverside, California’s labor force attachment program) simultaneously increased the deep poverty rate by 4.9 percentage points and lowered the poverty rate by 2.4 percentage points, with both changes being statistically significant. In seven of the other ten pilot programs, deep poverty rose while poverty fell, although not by statistically significant amounts in both cases.
Averaging across all sites, the 11 programs lowered poverty by an average of 2.1 percentage points but raised deep poverty by 2.9 percentage points. This pattern suggests that the programs raised the stakes for families in poverty, pushing some to find more employment and perhaps climb above the poverty line, while letting other families — or the same families in unluckier months — fall into deeper financial hardship when they failed to find work or earnings were especially low. Consistent with that interpretation, the programs tended to increase the share of parents with jobs in any given three-month period but also the share with neither earnings nor assistance.
Importantly, the improvements in employment and traditional poverty did not last. The results above reflect the programs’ second year; a follow-up study found that, over five years, employment gains weakened and, “because the earnings gains were offset by reductions in welfare benefits,” the 11 programs did not yield “systematically greater income or reduced poverty for welfare recipients” and “did not generally improve the economic well-being of the welfare recipients.”[42]
Appendix II: Underreporting of Income Can Mask Rise in Deep Poverty
The Census Bureau’s counts of program participants in survey data typically fall well short of the totals shown in actual administrative records.[43] Such underreporting is common in household surveys; survey respondents tend to underreport benefits out of forgetfulness, embarrassment about receiving benefits, or other reasons. Underreporting affects estimates of poverty and, in particular, deep poverty because underreported benefits make up a larger share of the total income of those with the lowest reported incomes. While respondents may also underreport earned income, the net rate of underreporting in the Current Population Survey (CPS) is thought to be much lower for earnings than for benefits.
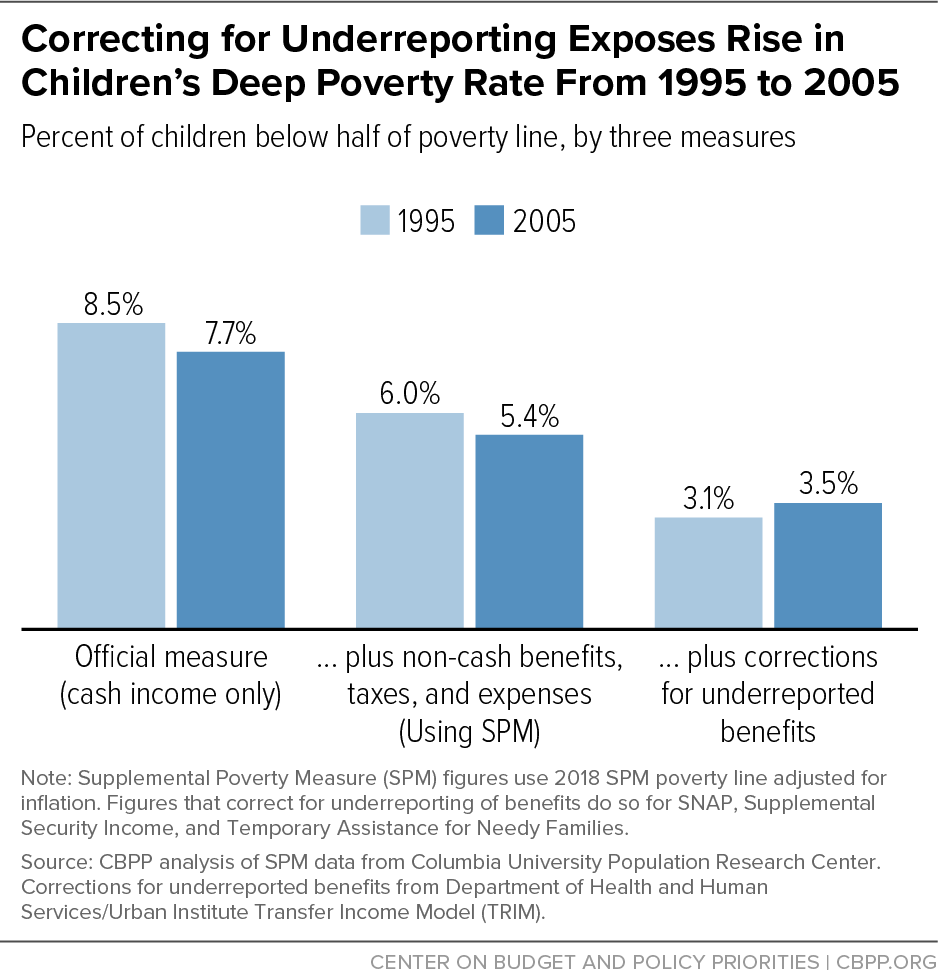
In data for 1995 to 2005, uncorrected CPS figures — whether using the official poverty definition or the SPM — do not show the rise in deep child poverty. The share of children below half of the poverty line fell from 8.5 percent to 7.7 percent under the official measure and from 6.0 percent to 5.4 percent under the SPM. But using the SPM and correcting for underreporting, the deep poverty rate among children rose over this period, from 3.1 percent to 3.5 percent. (See Appendix Figure 2.)
Correcting for underreporting has such a large impact on these figures because it accounts for billions of dollars per year of income from government benefit programs that the uncorrected figures miss. In particular, AFDC kept 2.8 million children above half of the poverty line in the corrected CPS data. By 2005, TANF was a much smaller program, keeping only about 700,000 children out of deep poverty using the corrected data. Correcting the CPS trend for missing cash assistance payments thus reveals the extent to which the old AFDC program lessened deep poverty in 1995, as well as the subsequent increase in deep poverty after its replacement by the much less effective TANF program.
Some recent research has suggested that the Transfer Income Model policy micro-simulation model, from which our corrected figures are derived, might overestimate the amount of TANF and SNAP that families with very low incomes receive.[44] If that is true, then the deep poverty rates presented in this paper may be too low and the true situation facing children may be even more severe.
Appendix III
| APPENDIX TABLE 1 | |||||||||
|---|---|---|---|---|---|---|---|---|---|
| Children in Deep Poverty, Counting and Not Counting Government Assistance and Taxes | |||||||||
| Figures use the Supplemental Poverty Measure (SPM) and 2018 SPM poverty line adjusted for inflation with the Consumer Price Index Research Series. We correct for underreporting of benefits from SNAP, Supplemental Security Income, and Temporary Assistance for Needy Families (TANF). | |||||||||
| Children | Children in Single-Mother Families | Children in Married-Couple Families | |||||||
| Year | Counting No Government Assistance or Taxes | Counting Government Assistance and Taxes | Percent Reduction in Deep Poverty | Counting No Government Assistance or Taxes | Counting Government Assistance and Taxes | Percent Reduction in Deep Poverty | Counting No Government Assistance or Taxes | Counting Government Assistance and Taxes | Percent Reduction in Deep Poverty |
| 1993 | 19.4% | 5.1% | 73.7% | 48.6% | 8.8% | 81.9% | 8.6% | 3.5% | 58.9% |
| 1994 | 18.2% | 4.1% | 77.4% | 46.4% | 6.8% | 85.3% | 7.7% | 2.9% | 62.2% |
| 1995 | 17.4% | 3.1% | 82.2% | 43.7% | 5.4% | 87.7% | 7.2% | 1.9% | 74.1% |
| 1996 | 17.3% | 3.2% | 81.3% | 43.2% | 6.4% | 85.1% | 7.5% | 1.7% | 77.7% |
| 1997 | 16.6% | 3.9% | 76.3% | 42.6% | 8.9% | 79.2% | 6.8% | 1.7% | 74.3% |
| 1998 | 14.4% | 3.6% | 74.9% | 37.2% | 8.5% | 77.2% | 6.0% | 1.6% | 73.5% |
| 1999 | 12.8% | 3.4% | 73.1% | 34.1% | 7.6% | 77.6% | 5.2% | 1.7% | 67.7% |
| 2000 | 11.6% | 3.4% | 71.1% | 29.5% | 6.8% | 76.9% | 5.2% | 1.8% | 65.5% |
| 2001 | 12.5% | 3.8% | 69.4% | 31.4% | 8.5% | 73.0% | 5.4% | 1.8% | 67.3% |
| 2002 | 12.4% | 3.4% | 72.2% | 31.1% | 7.1% | 77.0% | 5.5% | 1.8% | 66.8% |
| 2003 | 13.2% | 3.8% | 71.4% | 32.6% | 7.9% | 75.8% | 5.6% | 1.9% | 66.5% |
| 2004 | 13.1% | 3.4% | 74.3% | 33.3% | 7.3% | 78.2% | 5.6% | 1.7% | 69.4% |
| 2005 | 13.4% | 3.5% | 73.8% | 33.4% | 7.4% | 77.9% | 5.7% | 1.7% | 69.7% |
| 2006 | 12.7% | 3.2% | 74.8% | 31.5% | 6.7% | 78.6% | 5.5% | 1.7% | 69.4% |
| 2007 | 12.9% | 3.2% | 75.2% | 30.8% | 6.2% | 79.8% | 5.6% | 1.8% | 67.5% |
| 2008 | 14.5% | 3.4% | 76.9% | 33.2% | 6.9% | 79.1% | 7.1% | 1.8% | 74.3% |
| 2009 | 15.9% | 3.0% | 81.4% | 34.0% | 4.6% | 86.5% | 8.2% | 2.0% | 75.7% |
| 2010 | 16.4% | 2.6% | 84.1% | 35.3% | 4.7% | 86.8% | 8.2% | 1.6% | 80.4% |
| 2011 | 16.0% | 2.5% | 84.4% | 34.7% | 4.8% | 86.3% | 7.5% | 1.3% | 82.2% |
| 2012 | 16.4% | 2.5% | 84.5% | 34.9% | 4.5% | 87.2% | 8.2% | 1.6% | 80.7% |
| 2013 | 15.7% | 2.7% | 82.9% | 35.5% | 5.2% | 85.4% | 7.2% | 1.5% | 79.4% |
| 2014 | 15.1% | 2.6% | 82.5% | 33.4% | 5.0% | 85.0% | 7.1% | 1.5% | 78.7% |
| 2015 | 14.7% | 2.9% | 80.0% | 32.0% | 4.9% | 84.6% | 7.1% | 1.7% | 76.1% |
| 2016 | 13.1% | 2.7% | 79.2% | 29.9% | 5.3% | 82.4% | 6.0% | 1.5% | 74.4% |
| APPENDIX TABLE 2 | ||||||||
|---|---|---|---|---|---|---|---|---|
| Effect of Specified Income Sources on Poverty and Deep Poverty (Under Age 18) | ||||||||
| Figures are in thousands and use the Supplemental Poverty Measure (SPM) and 2018 SPM poverty line adjusted for inflation with the Consumer Price Index Research Series. We correct for underreporting of benefits from SNAP, Supplemental Security Income, and Temporary Assistance for Needy Families (TANF). | ||||||||
| Below 100% of Poverty Line | Below 50% of Poverty Line | |||||||
| 1995 | 2005 | 2010 | 2016 | 1995 | 2005 | 2010 | 2016 | |
| Population | 71,142 | 73,973 | 74,916 | 74,047 | 71,142 | 73,973 | 74,916 | 74,047 |
| Number in poverty or deep poverty | 15,599 | 11,807 | 10,350 | 9,767 | 2,209 | 2,599 | 1,944 | 2,010 |
| As a percentage of the population | 21.9% | 16.0% | 13.8% | 13.2% | 3.1% | 3.5% | 2.6% | 2.7% |
| Would be living in poverty or in deep poverty if the following family income were not counted: | ||||||||
| All public benefits* | 20,446 | 17,894 | 22,434 | 19,007 | 12,384 | 9,923 | 12,261 | 9,666 |
| Social Security | 16,900 | 13,000 | 11,947 | 11,463 | 3,278 | 3,664 | 3,122 | 3,075 |
| Unemployment Insurance | 16,085 | 12,178 | 11,777 | 9,995 | 2,372 | 2,688 | 2,588 | 2,065 |
| Means-tested benefits* | 20,909 | 18,046 | 21,479 | 19,352 | 11,186 | 8,715 | 9,765 | 8,456 |
| TANF | 17,008 | 12,469 | 11,157 | 10,369 | 4,992 | 3,312 | 2,489 | 2,297 |
| SSI | 16,666 | 12,685 | 11,628 | 10,844 | 3,052 | 3,445 | 2,687 | 2,812 |
| SNAP (formerly food stamps) | 17,571 | 13,603 | 14,870 | 13,052 | 4,911 | 4,449 | 4,423 | 3,933 |
| Rental assistance | 16,420 | 12,553 | 11,756 | 11,032 | 2,894 | 3,382 | 2,254 | 2,415 |
| EITC and Child Tax Credit:** | 17,967 | 15,624 | 15,303 | 14,824 | 2,940 | 3,493 | 2,660 | 2,806 |
| (Example: In 2016, 3.9 million children lived in families whose non-SNAP income was below half the SPM poverty line.) | ||||||||
| Lifted above the poverty line or above half the poverty line by the following family income:*** | ||||||||
| All public benefits* | 4,848 | 6,087 | 12,085 | 9,241 | 10,176 | 7,324 | 10,317 | 7,655 |
| Social Security | 1,301 | 1,193 | 1,597 | 1,696 | 1,069 | 1,066 | 1,178 | 1,065 |
| Unemployment Insurance | 487 | 371 | 1,427 | 229 | 164 | 89 | 645 | 55 |
| Means-tested benefits* | 5,311 | 6,239 | 11,130 | 9,585 | 8,977 | 6,116 | 7,822 | 6,446 |
| TANF | 1,410 | 662 | 807 | 602 | 2,783 | 714 | 545 | 287 |
| SSI | 1,067 | 878 | 1,279 | 1,077 | 843 | 847 | 743 | 802 |
| SNAP (formerly food stamps) | 1,973 | 1,796 | 4,521 | 3,286 | 2,703 | 1,850 | 2,480 | 1,923 |
| Rental assistance | 821 | 746 | 1,406 | 1,265 | 686 | 784 | 310 | 405 |
| EITC and Child Tax Credit:** | 2,369 | 3,817 | 4,954 | 5,057 | 732 | 894 | 716 | 796 |
| (Example: In 2016, 1.9 million children lived in families whose income was lifted above half the poverty line by SNAP.) | ||||||||
| Lifted above, as a percentage of those who would be living in poverty or in deep poverty without the specified income source: | ||||||||
| All public benefits* | 24% | 34% | 54% | 49% | 82% | 74% | 84% | 79% |
| Social Security | 8% | 9% | 13% | 15% | 33% | 29% | 38% | 35% |
| Unemployment Insurance | 3% | 3% | 12% | 2% | 7% | 3% | 25% | 3% |
| Means-tested benefits* | 25% | 35% | 52% | 50% | 80% | 70% | 80% | 76% |
| TANF | 8% | 5% | 7% | 6% | 56% | 22% | 22% | 13% |
| SSI | 6% | 7% | 11% | 10% | 28% | 25% | 28% | 29% |
| SNAP (formerly food stamps) | 11% | 13% | 30% | 25% | 55% | 42% | 56% | 49% |
| Rental Assistance | 5% | 6% | 12% | 11% | 24% | 23% | 14% | 17% |
| EITC and Child Tax Credit:** | 13% | 24% | 32% | 34% | 25% | 26% | 27% | 28% |
| (Example: In 2016, SNAP lifted above half the poverty line 49% of children who would otherwise have been living in deep poverty.) | ||||||||
| APPENDIX TABLE 3 | ||||||||
|---|---|---|---|---|---|---|---|---|
| Effect of Specified Income Sources on Poverty and Deep Poverty (All Ages) | ||||||||
| Figures are in thousands and use the Supplemental Poverty Measure (SPM) and 2018 SPM poverty line adjusted for inflation with the Consumer Price Index Research Series. We correct for underreporting of benefits from SNAP, Supplemental Security Income, and Temporary Assistance for Needy Families (TANF). | ||||||||
| Below 100% of Poverty Line | Below 50% of Poverty Line | |||||||
| 1995 | 2005 | 2010 | 2016 | 1995 | 2005 | 2010 | 2016 | |
| Population | 264,234 | 293,672 | 306,110 | 320,372 | 264,234 | 293,672 | 306,110 | 320,372 |
| Number in poverty or deep poverty | 44,998 | 41,664 | 42,277 | 43,175 | 8,965 | 11,364 | 11,267 | 12,611 |
| As a percentage of the population | 17.0% | 14.2% | 13.8% | 13.5% | 3.4% | 3.9% | 3.7% | 3.9% |
| Would be living in poverty or in deep poverty if the following family income were not counted: | ||||||||
| All public benefits* | 69,013 | 70,260 | 88,039 | 83,020 | 44,682 | 45,298 | 56,755 | 53,584 |
| Social Security | 63,360 | 62,376 | 66,576 | 69,862 | 26,584 | 31,117 | 33,739 | 36,930 |
| Unemployment Insurance | 46,333 | 42,716 | 47,312 | 43,893 | 9,496 | 11,720 | 13,931 | 12,906 |
| Means-tested benefits* | 56,477 | 55,190 | 66,709 | 65,052 | 27,092 | 25,484 | 29,897 | 29,234 |
| TANF | 47,584 | 42,836 | 43,743 | 44,244 | 13,384 | 12,545 | 12,182 | 13,138 |
| SSI | 47,935 | 44,640 | 46,822 | 47,687 | 12,551 | 15,303 | 15,194 | 16,824 |
| SNAP (formerly food stamps) | 48,696 | 45,056 | 51,991 | 50,408 | 13,665 | 14,955 | 16,912 | 17,020 |
| Rental assistance | 46,662 | 43,294 | 45,909 | 46,756 | 10,447 | 13,096 | 12,158 | 13,858 |
| EITC and Child Tax Credit:** | 49,614 | 48,953 | 51,766 | 52,825 | 10,440 | 13,123 | 12,770 | 14,254 |
| (Example: In 2016, 17.0 million Americans lived in families whose non-SNAP income was below half the SPM poverty line.) | ||||||||
| Lifted above the poverty line or above half the poverty line by the following family income:*** | ||||||||
| All public benefits* | 24,015 | 28,596 | 45,762 | 39,845 | 35,717 | 33,934 | 45,488 | 40,973 |
| Social Security | 18,362 | 20,713 | 24,299 | 26,687 | 17,620 | 19,753 | 22,472 | 24,319 |
| Unemployment Insurance | 1,335 | 1,053 | 5,035 | 718 | 531 | 355 | 2,664 | 295 |
| Means-tested benefits* | 11,478 | 13,526 | 24,432 | 21,877 | 18,127 | 14,120 | 18,630 | 16,623 |
| TANF | 2,586 | 1,172 | 1,466 | 1,069 | 4,420 | 1,181 | 915 | 527 |
| SSI | 2,937 | 2,976 | 4,545 | 4,512 | 3,586 | 3,939 | 3,927 | 4,213 |
| SNAP (formerly food stamps) | 3,698 | 3,392 | 9,714 | 7,233 | 4,700 | 3,590 | 5,645 | 4,409 |
| Rental assistance | 1,664 | 1,631 | 3,632 | 3,581 | 1,483 | 1,732 | 891 | 1,247 |
| EITC and Child Tax Credit:** | 4,616 | 7,289 | 9,489 | 9,650 | 1,476 | 1,758 | 1,503 | 1,643 |
| (Example: In 2016, 4.4 million Americans lived in families whose income was lifted above half the poverty line by SNAP.) | ||||||||
| Lifted above, as a percentage of those who would be living in poverty without the specified income source: | ||||||||
| All public benefits* | 35% | 41% | 52% | 48% | 80% | 75% | 80% | 76% |
| Social Security | 29% | 33% | 36% | 38% | 66% | 63% | 67% | 66% |
| Unemployment Insurance | 3% | 2% | 11% | 2% | 6% | 3% | 19% | 2% |
| Means-tested benefits* | 20% | 25% | 37% | 34% | 67% | 55% | 62% | 57% |
| TANF | 5% | 3% | 3% | 2% | 33% | 9% | 8% | 4% |
| SSI | 6% | 7% | 10% | 9% | 29% | 26% | 26% | 25% |
| SNAP (formerly food stamps) | 8% | 8% | 19% | 14% | 34% | 24% | 33% | 26% |
| Rental assistance | 4% | 4% | 8% | 8% | 14% | 13% | 7% | 9% |
| EITC and Child Tax Credit:** | 9% | 15% | 18% | 18% | 14% | 13% | 12% | 12% |
| (Example: In 2016, SNAP lifted above half the poverty line 26% of Americans who would otherwise have been living in deep poverty.) | ||||||||
| APPENDIX TABLE 4A | |||||||
|---|---|---|---|---|---|---|---|
| Persons in Deep Poverty (Below 50% of Poverty Line), By Age and Family Structure | |||||||
| Figures use the Supplemental Poverty Measure (SPM) and 2018 SPM poverty line adjusted for inflation with the Consumer Price Index Research Series. We correct for underreporting of benefits from SNAP, Supplemental Security Income, and Temporary Assistance for Needy Families (TANF). | |||||||
| Year | All persons | Under 18, in married-couple family | Under 18, in single-mother family |
Under 18, in single-father family |
18 to 64, with kids in SPM unit |
18 to 64, with no kids in SPM unit |
65 and over |
| 1993 | 4.6% | 3.5% | 8.8% | 5.1% | 4.0% | 4.7% | 4.6% |
| 1994 | 4.1% | 2.9% | 6.8% | 3.4% | 3.1% | 4.9% | 4.7% |
| 1995 | 3.4% | 1.9% | 5.4% | 3.9% | 2.1% | 4.6% | 4.0% |
| 1996 | 3.5% | 1.7% | 6.4% | 3.8% | 2.1% | 4.4% | 4.7% |
| 1997 | 3.7% | 1.7% | 8.9% | 4.0% | 2.6% | 4.3% | 4.4% |
| 1998 | 3.5% | 1.6% | 8.5% | 3.0% | 2.3% | 4.2% | 4.4% |
| 1999 | 3.5% | 1.7% | 7.6% | 3.3% | 2.4% | 4.1% | 4.2% |
| 2000 | 3.3% | 1.8% | 6.8% | 3.8% | 2.2% | 4.0% | 4.0% |
| 2001 | 3.7% | 1.8% | 8.5% | 4.5% | 2.5% | 4.5% | 4.1% |
| 2002 | 3.7% | 1.8% | 7.1% | 3.4% | 2.5% | 4.7% | 4.3% |
| 2003 | 4.0% | 1.9% | 7.9% | 4.8% | 2.7% | 4.8% | 5.0% |
| 2004 | 3.9% | 1.7% | 7.3% | 3.3% | 2.4% | 5.2% | 4.7% |
| 2005 | 3.9% | 1.7% | 7.4% | 3.2% | 2.4% | 5.1% | 4.6% |
| 2006 | 4.0% | 1.7% | 6.7% | 3.4% | 2.4% | 5.3% | 5.9% |
| 2007 | 3.9% | 1.8% | 6.2% | 3.4% | 2.5% | 5.0% | 5.5% |
| 2008 | 3.9% | 1.8% | 6.9% | 2.6% | 2.4% | 5.0% | 4.7% |
| 2009 | 3.8% | 2.0% | 4.6% | 3.3% | 2.4% | 5.3% | 3.9% |
| 2010 | 3.7% | 1.6% | 4.7% | 2.6% | 2.3% | 5.5% | 3.4% |
| 2011 | 3.7% | 1.3% | 4.8% | 2.9% | 2.2% | 5.6% | 3.3% |
| 2012 | 3.8% | 1.6% | 4.5% | 2.4% | 2.3% | 5.7% | 3.6% |
| 2013 | 4.0% | 1.5% | 5.2% | 2.6% | 2.3% | 6.1% | 4.1% |
| 2014 | 4.1% | 1.5% | 5.0% | 2.9% | 2.3% | 6.3% | 4.3% |
| 2015 | 3.9% | 1.7% | 4.9% | 4.1% | 2.4% | 5.7% | 3.6% |
| 2016 | 3.9% | 1.5% | 5.3% | 3.1% | 2.3% | 5.7% | 4.4% |
| APPENDIX TABLE 4B | |||||||
|---|---|---|---|---|---|---|---|
| Persons in Deep Poverty (Below 50% of Poverty Line), By Age and Family Structure | |||||||
| Figures are in thousands and use the Supplemental Poverty Measure (SPM) and 2018 SPM poverty line adjusted for inflation with the Consumer Price Index Research Series. We correct for underreporting of benefits from SNAP, Supplemental Security Income, and Temporary Assistance for Needy Families (TANF). | |||||||
| Year | All persons | Under 18, in married-couple family |
Under 18, in single-mother family |
Under 18, in single-father family |
18 to 64, with kids in SPM unit |
18 to 64, with no kids in SPM unit |
65 and over |
| 1993 | 11,917 | 1,738 | 1,515 | 122 | 3,007 | 3,938 | 1,417 |
| 1994 | 10,816 | 1,444 | 1,198 | 89 | 2,352 | 4,098 | 1,461 |
| 1995 | 8,965 | 920 | 973 | 114 | 1,574 | 3,908 | 1,274 |
| 1996 | 9,233 | 821 | 1,140 | 122 | 1,609 | 3,846 | 1,483 |
| 1997 | 10,014 | 864 | 1,556 | 133 | 2,013 | 3,772 | 1,414 |
| 1998 | 9,599 | 792 | 1,505 | 99 | 1,762 | 3,799 | 1,429 |
| 1999 | 9,505 | 858 | 1,305 | 106 | 1,879 | 3,766 | 1,372 |
| 2000 | 9,251 | 918 | 1,139 | 130 | 1,708 | 3,770 | 1,330 |
| 2001 | 10,409 | 902 | 1,471 | 156 | 1,977 | 4,290 | 1,372 |
| 2002 | 10,617 | 936 | 1,266 | 122 | 2,015 | 4,611 | 1,466 |
| 2003 | 11,399 | 948 | 1,437 | 173 | 2,144 | 4,762 | 1,721 |
| 2004 | 11,378 | 863 | 1,336 | 121 | 1,984 | 5,245 | 1,653 |
| 2005 | 11,364 | 879 | 1,338 | 120 | 1,922 | 5,230 | 1,614 |
| 2006 | 11,996 | 853 | 1,268 | 120 | 2,032 | 5,477 | 2,115 |
| 2007 | 11,702 | 918 | 1,197 | 132 | 1,991 | 5,324 | 2,014 |
| 2008 | 11,651 | 919 | 1,331 | 98 | 1,963 | 5,410 | 1,780 |
| 2009 | 11,471 | 1,009 | 902 | 137 | 2,009 | 5,737 | 1,511 |
| 2010 | 11,267 | 792 | 945 | 112 | 1,879 | 6,099 | 1,346 |
| 2011 | 11,297 | 649 | 981 | 132 | 1,795 | 6,264 | 1,382 |
| 2012 | 11,681 | 771 | 894 | 115 | 1,864 | 6,384 | 1,550 |
| 2013 | 12,519 | 725 | 1,037 | 120 | 1,853 | 6,871 | 1,802 |
| 2014 | 12,968 | 742 | 998 | 130 | 1,891 | 7,143 | 1,980 |
| 2015 | 12,415 | 829 | 974 | 193 | 1,962 | 6,555 | 1,717 |
| 2016 | 12,611 | 749 | 1,019 | 148 | 1,855 | 6,597 | 2,149 |
| APPENDIX TABLE 5A | |||||||
|---|---|---|---|---|---|---|---|
| Persons in Poverty (Below 100% of Poverty Line), By Age and Family Structure | |||||||
| Figures use the Supplemental Poverty Measure (SPM) and 2018 SPM poverty line adjusted for inflation with the Consumer Price Index Research Series. We correct for underreporting of benefits from SNAP, Supplemental Security Income, and Temporary Assistance for Needy Families (TANF). | |||||||
| Year | All persons | Under 18, in married-couple family |
Under 18, in single-mother family |
Under 18, in single-father family |
18 to 64, with kids in SPM unit |
18 to 64, with no kids in SPM unit |
65 and over |
| 1993 | 20.3% | 18.0% | 52.9% | 30.5% | 20.6% | 13.7% | 20.9% |
| 1994 | 18.6% | 15.3% | 47.9% | 27.1% | 17.7% | 14.0% | 20.2% |
| 1995 | 17.0% | 13.5% | 43.5% | 21.9% | 15.7% | 13.5% | 18.9% |
| 1996 | 16.7% | 13.0% | 42.5% | 23.5% | 15.7% | 12.9% | 19.0% |
| 1997 | 16.4% | 12.6% | 43.6% | 20.3% | 15.3% | 13.1% | 18.2% |
| 1998 | 15.2% | 11.7% | 40.4% | 18.3% | 14.1% | 12.0% | 17.3% |
| 1999 | 14.5% | 11.0% | 36.7% | 18.2% | 13.2% | 12.2% | 16.5% |
| 2000 | 14.0% | 11.0% | 34.0% | 20.2% | 12.4% | 11.5% | 17.8% |
| 2001 | 14.6% | 10.9% | 35.4% | 18.9% | 13.1% | 12.4% | 17.6% |
| 2002 | 14.5% | 11.6% | 33.0% | 18.6% | 13.0% | 12.4% | 17.7% |
| 2003 | 14.6% | 10.1% | 34.6% | 20.3% | 12.9% | 12.9% | 17.9% |
| 2004 | 14.2% | 9.4% | 32.3% | 14.2% | 12.0% | 13.6% | 17.6% |
| 2005 | 14.2% | 9.4% | 32.7% | 16.7% | 12.1% | 13.3% | 17.8% |
| 2006 | 14.2% | 9.4% | 32.5% | 15.6% | 12.4% | 13.0% | 18.3% |
| 2007 | 14.3% | 10.1% | 30.5% | 18.8% | 13.0% | 12.9% | 18.0% |
| 2008 | 14.3% | 10.2% | 30.4% | 17.1% | 12.8% | 13.2% | 17.4% |
| 2009 | 13.6% | 9.1% | 24.7% | 17.6% | 12.2% | 14.1% | 14.3% |
| 2010 | 13.8% | 8.5% | 25.8% | 16.1% | 12.0% | 14.5% | 15.5% |
| 2011 | 14.3% | 8.7% | 26.7% | 16.0% | 13.0% | 15.1% | 14.8% |
| 2012 | 14.7% | 9.1% | 27.1% | 17.6% | 13.4% | 15.4% | 15.2% |
| 2013 | 15.4% | 9.0% | 29.0% | 16.8% | 13.5% | 16.5% | 16.1% |
| 2014 | 15.5% | 9.8% | 27.9% | 18.3% | 13.6% | 16.7% | 15.9% |
| 2015 | 14.1% | 9.2% | 24.9% | 17.6% | 12.4% | 14.9% | 14.6% |
| 2016 | 13.5% | 8.1% | 25.3% | 13.4% | 11.5% | 14.2% | 15.3% |
| APPENDIX TABLE 5B | |||||||
|---|---|---|---|---|---|---|---|
| Persons in Poverty (Below 100% of Poverty Line), By Age and Family Structure | |||||||
| Figures are in thousands and use the Supplemental Poverty Measure (SPM) and 2018 SPM poverty line adjusted for inflation with the Consumer Price Index Research Series. We correct for underreporting of benefits from SNAP, Supplemental Security Income, and Temporary Assistance for Needy Families (TANF). | |||||||
| Year | All persons | Under 18, in married-couple family |
Under 18, in single-mother family |
Under 18, in single-father family |
18 to 64, with kids in SPM unit |
18 to 64, with no kids in SPM unit |
65 and over |
| 1993 | 52,662 | 8,850 | 9,109 | 737 | 15,662 | 11,411 | 6,434 |
| 1994 | 48,662 | 7,549 | 8,425 | 709 | 13,436 | 11,810 | 6,321 |
| 1995 | 44,998 | 6,633 | 7,863 | 636 | 11,904 | 11,513 | 5,982 |
| 1996 | 44,521 | 6,431 | 7,516 | 750 | 12,002 | 11,264 | 6,056 |
| 1997 | 44,207 | 6,241 | 7,668 | 675 | 11,741 | 11,556 | 5,825 |
| 1998 | 41,343 | 5,810 | 7,159 | 597 | 10,776 | 10,894 | 5,614 |
| 1999 | 39,659 | 5,580 | 6,275 | 595 | 10,226 | 11,174 | 5,382 |
| 2000 | 38,718 | 5,616 | 5,692 | 684 | 9,641 | 10,759 | 5,862 |
| 2001 | 41,028 | 5,524 | 6,139 | 662 | 10,398 | 11,938 | 5,938 |
| 2002 | 41,450 | 5,887 | 5,847 | 661 | 10,451 | 12,167 | 6,043 |
| 2003 | 42,004 | 5,130 | 6,302 | 727 | 10,420 | 12,815 | 6,196 |
| 2004 | 41,191 | 4,762 | 5,931 | 525 | 9,810 | 13,584 | 6,199 |
| 2005 | 41,664 | 4,768 | 5,933 | 624 | 9,886 | 13,665 | 6,305 |
| 2006 | 42,068 | 4,771 | 6,118 | 548 | 10,291 | 13,498 | 6,585 |
| 2007 | 42,864 | 5,094 | 5,850 | 739 | 10,527 | 13,745 | 6,612 |
| 2008 | 43,182 | 5,151 | 5,841 | 647 | 10,506 | 14,174 | 6,567 |
| 2009 | 41,313 | 4,598 | 4,857 | 724 | 10,130 | 15,182 | 5,527 |
| 2010 | 42,277 | 4,205 | 5,236 | 682 | 9,881 | 15,978 | 6,069 |
| 2011 | 44,203 | 4,214 | 5,492 | 721 | 10,580 | 16,824 | 6,162 |
| 2012 | 45,761 | 4,448 | 5,423 | 837 | 10,928 | 17,321 | 6,569 |
| 2013 | 48,121 | 4,375 | 5,791 | 775 | 11,098 | 18,659 | 7,142 |
| 2014 | 48,938 | 4,769 | 5,572 | 808 | 11,252 | 19,036 | 7,303 |
| 2015 | 44,833 | 4,464 | 4,927 | 824 | 10,119 | 17,255 | 6,955 |
| 2016 | 43,175 | 3,979 | 4,890 | 654 | 9,301 | 16,583 | 7,524 |
| APPENDIX TABLE 6A | |||||
|---|---|---|---|---|---|
| Children in Deep Poverty (Below 50% of Poverty Line), By Race and Ethnicity | |||||
| Figures use the Supplemental Poverty Measure (SPM) and 2018 SPM poverty line adjusted for inflation with the Consumer Price Index Research Series. We correct for underreporting of benefits from SNAP, Supplemental Security Income, and Temporary Assistance for Needy Families (TANF). | |||||
| Year | All children | White only, not Latino |
Black only, not Latino |
Latino (any race) |
Asian only, not Latino |
| 1993 | 5.1% | 3.6% | 6.7% | 9.9% | 8.0% |
| 1994 | 4.1% | 3.3% | 4.1% | 7.5% | 7.9% |
| 1995 | 3.1% | 2.2% | 4.1% | 5.8% | 4.8% |
| 1996 | 3.2% | 2.1% | 5.2% | 5.3% | 4.1% |
| 1997 | 3.9% | 2.4% | 6.1% | 7.8% | 4.3% |
| 1998 | 3.6% | 1.9% | 6.0% | 7.6% | 4.9% |
| 1999 | 3.4% | 2.0% | 5.0% | 7.2% | 3.1% |
| 2000 | 3.4% | 2.0% | 6.1% | 6.2% | 3.0% |
| 2001 | 3.8% | 2.2% | 6.7% | 6.9% | 3.3% |
| 2002 | 3.4% | 2.0% | 6.2% | 5.8% | 3.8% |
| 2003 | 3.8% | 2.1% | 6.4% | 6.4% | 5.4% |
| 2004 | 3.4% | 2.1% | 5.2% | 6.0% | 3.9% |
| 2005 | 3.5% | 1.8% | 5.8% | 6.8% | 3.7% |
| 2006 | 3.2% | 1.7% | 5.1% | 6.1% | 3.4% |
| 2007 | 3.2% | 1.9% | 4.5% | 5.6% | 3.7% |
| 2008 | 3.4% | 1.8% | 5.0% | 6.2% | 3.8% |
| 2009 | 3.0% | 2.0% | 3.4% | 4.7% | 4.4% |
| 2010 | 2.6% | 1.6% | 3.4% | 4.4% | 2.3% |
| 2011 | 2.5% | 1.4% | 3.3% | 4.6% | 2.6% |
| 2012 | 2.5% | 1.6% | 3.1% | 4.1% | 3.2% |
| 2013 | 2.7% | 1.8% | 3.6% | 4.1% | 3.1% |
| 2014 | 2.6% | 1.8% | 3.7% | 3.8% | 3.3% |
| 2015 | 2.9% | 2.2% | 4.0% | 3.8% | 4.1% |
| 2016 | 2.7% | 2.0% | 4.5% | 3.2% | 3.5% |
| APPENDIX TABLE 6B | |||||
|---|---|---|---|---|---|
| Children in Deep Poverty (Below 50% of Poverty Line), By Race and Ethnicity | |||||
| Figures are in thousands and use the Supplemental Poverty Measure (SPM) and 2018 SPM poverty line adjusted for inflation with the Consumer Price Index Research Series. We correct for underreporting of benefits from SNAP, Supplemental Security Income, and Temporary Assistance for Needy Families (TANF). | |||||
| Year | All children | White only, not Latino |
Black only, not Latino |
Latino (any race) |
Asian only, not Latino |
| 1993 | 3,554 | 1,666 | 745 | 942 | 162 |
| 1994 | 2,906 | 1,531 | 460 | 740 | 136 |
| 1995 | 2,209 | 999 | 455 | 594 | 138 |
| 1996 | 2,295 | 987 | 578 | 562 | 120 |
| 1997 | 2,815 | 1,110 | 685 | 850 | 132 |
| 1998 | 2,610 | 885 | 674 | 861 | 149 |
| 1999 | 2,488 | 915 | 554 | 838 | 91 |
| 2000 | 2,443 | 888 | 681 | 741 | 92 |
| 2001 | 2,770 | 991 | 747 | 887 | 105 |
| 2002 | 2,526 | 894 | 681 | 774 | 102 |
| 2003 | 2,772 | 926 | 712 | 879 | 148 |
| 2004 | 2,495 | 890 | 564 | 861 | 110 |
| 2005 | 2,599 | 791 | 625 | 1,003 | 106 |
| 2006 | 2,372 | 716 | 556 | 924 | 99 |
| 2007 | 2,372 | 805 | 491 | 889 | 109 |
| 2008 | 2,498 | 764 | 532 | 1,020 | 111 |
| 2009 | 2,214 | 835 | 359 | 797 | 140 |
| 2010 | 1,944 | 644 | 352 | 780 | 73 |
| 2011 | 1,856 | 546 | 339 | 817 | 90 |
| 2012 | 1,884 | 629 | 312 | 727 | 109 |
| 2013 | 1,993 | 683 | 364 | 729 | 108 |
| 2014 | 1,954 | 694 | 377 | 679 | 118 |
| 2015 | 2,181 | 822 | 415 | 698 | 151 |
| 2016 | 2,010 | 744 | 462 | 598 | 130 |
| APPENDIX TABLE 7A | |||||
|---|---|---|---|---|---|
| Children in Poverty (Below 100% of Poverty Line), By Race and Ethnicity | |||||
| Figures use the Supplemental Poverty Measure (SPM) and 2018 SPM poverty line adjusted for inflation with the Consumer Price Index Research Series. We correct for underreporting of benefits from SNAP, Supplemental Security Income, and Temporary Assistance for Needy Families (TANF). | |||||
| Year | All children | White only, not Latino |
Black only, not Latino |
Latino (any race) |
Asian only, not Latino |
| 1993 | 27.5% | 18.0% | 47.2% | 50.6% | 26.8% |
| 1994 | 24.2% | 15.6% | 40.7% | 45.8% | 25.0% |
| 1995 | 21.9% | 12.6% | 38.2% | 44.4% | 25.6% |
| 1996 | 21.3% | 12.6% | 35.6% | 43.1% | 22.7% |
| 1997 | 21.0% | 12.0% | 36.3% | 42.4% | 23.2% |
| 1998 | 19.5% | 10.8% | 33.5% | 39.7% | 21.7% |
| 1999 | 17.8% | 9.8% | 31.6% | 34.7% | 17.4% |
| 2000 | 17.2% | 9.4% | 29.5% | 34.2% | 18.8% |
| 2001 | 17.6% | 9.9% | 30.5% | 32.4% | 16.4% |
| 2002 | 17.5% | 9.7% | 30.1% | 32.4% | 17.9% |
| 2003 | 17.1% | 9.3% | 30.0% | 31.6% | 15.8% |
| 2004 | 15.7% | 8.6% | 26.3% | 29.7% | 14.0% |
| 2005 | 16.0% | 8.5% | 28.2% | 28.7% | 16.0% |
| 2006 | 15.8% | 8.1% | 26.8% | 29.2% | 15.4% |
| 2007 | 16.1% | 8.3% | 24.8% | 31.1% | 17.0% |
| 2008 | 16.0% | 8.2% | 24.9% | 30.1% | 16.1% |
| 2009 | 14.0% | 8.1% | 19.1% | 24.9% | 15.7% |
| 2010 | 13.8% | 7.3% | 22.4% | 24.0% | 12.6% |
| 2011 | 14.4% | 7.7% | 22.3% | 24.9% | 13.2% |
| 2012 | 14.8% | 8.0% | 21.2% | 25.9% | 14.6% |
| 2013 | 15.2% | 8.5% | 23.4% | 25.6% | 13.8% |
| 2014 | 15.4% | 8.9% | 23.0% | 25.2% | 15.1% |
| 2015 | 14.2% | 9.1% | 20.2% | 21.9% | 14.2% |
| 2016 | 13.2% | 7.8% | 20.9% | 20.5% | 11.6% |
| APPENDIX TABLE 7B | |||||
|---|---|---|---|---|---|
| Children in Poverty (Below 100% of Poverty Line), By Race and Ethnicity | |||||
| Figures are in thousands and use Supplemental Poverty Measure (SPM) and 2018 SPM poverty line adjusted for inflation with the Consumer Price Index Research Series. We correct for underreporting of benefits from SNAP, Supplemental Security Income, and Temporary Assistance for Needy Families (TANF). | |||||
| Year | All children | White only, not Latino |
Black only, not Latino |
Latino (any race) |
Asian only, not Latino |
| 1993 | 19,154 | 8,330 | 5,219 | 4,816 | 544 |
| 1994 | 17,095 | 7,303 | 4,568 | 4,530 | 431 |
| 1995 | 15,599 | 5,801 | 4,282 | 4,575 | 732 |
| 1996 | 15,200 | 5,788 | 3,950 | 4,565 | 657 |
| 1997 | 15,084 | 5,475 | 4,069 | 4,636 | 711 |
| 1998 | 14,059 | 4,932 | 3,741 | 4,488 | 660 |
| 1999 | 12,877 | 4,475 | 3,522 | 4,060 | 521 |
| 2000 | 12,456 | 4,263 | 3,291 | 4,114 | 570 |
| 2001 | 12,754 | 4,401 | 3,420 | 4,179 | 516 |
| 2002 | 12,789 | 4,248 | 3,290 | 4,326 | 476 |
| 2003 | 12,572 | 4,039 | 3,315 | 4,381 | 429 |
| 2004 | 11,599 | 3,732 | 2,872 | 4,254 | 397 |
| 2005 | 11,807 | 3,653 | 3,070 | 4,248 | 453 |
| 2006 | 11,693 | 3,449 | 2,920 | 4,448 | 448 |
| 2007 | 11,981 | 3,485 | 2,699 | 4,894 | 497 |
| 2008 | 11,935 | 3,400 | 2,670 | 4,953 | 476 |
| 2009 | 10,474 | 3,346 | 2,033 | 4,246 | 502 |
| 2010 | 10,350 | 2,976 | 2,351 | 4,206 | 403 |
| 2011 | 10,636 | 3,009 | 2,270 | 4,406 | 448 |
| 2012 | 10,943 | 3,111 | 2,160 | 4,614 | 500 |
| 2013 | 11,222 | 3,262 | 2,356 | 4,604 | 482 |
| 2014 | 11,347 | 3,412 | 2,356 | 4,562 | 545 |
| 2015 | 10,505 | 3,462 | 2,071 | 4,006 | 515 |
| 2016 | 9,767 | 2,960 | 2,135 | 3,785 | 432 |
End Notes
[1] Chris Wimer et al., Historical Supplemental Poverty Measure Data, Columbia Population Research Center, 2017, https://www.povertycenter.columbia.edu/data-release/2016/8/23/historical-spm-data.
[2] Using a recent year’s SPM threshold and adjusting it back for inflation creates an “anchored” SPM series. Some analysts prefer it to the standard or “relative” SPM, which allows thresholds to grow slightly faster than inflation as living standards rise across decades. For this analysis, we used an anchored series to ensure that the trends we find are purely due to changes in families’ resources, not changes in the poverty thresholds. Chris Wimer et al., “Trends in Poverty with an Anchored Supplemental Poverty Measure,” Columbia Population Research Center Working Paper No. 13-01, December 2013, https://academiccommons.columbia.edu/doi/10.7916/D8RN3853. We anchored all poverty thresholds to 2018 since it is the latest SPM threshold available, and to make this analysis consistent with the methodology we used in Danilo Trisi and Matt Saenz, “Economic Security Programs Cut Poverty Nearly in Half Over Last 50 Years,” Center on Budget and Policy Priorities, updated November 26, 2019, https://www.cbpp.org/research/poverty-and-inequality/economic-security-programs-cut-poverty-nearly-in-half-over-last-50.
[3] We correct for the tendency of Census Bureau data to underreport income from three government assistance programs: AFDC/TANF, Supplemental Security Income, and SNAP. The corrections come from the Transfer Income Model (TRIM) policy micro-simulation model developed by the Urban Institute with primary funding from the U.S. Department of Health and Human Services Office of the Assistance Secretary for Planning and Evaluation. TRIM starts with Census survey data but adjusts those data to more closely match actual numbers and characteristics of benefit recipients shown in program records. Our analysis ends in 2016 because that is the last year for which these corrections are available.
[4] National Academies of Sciences, Engineering, and Medicine, A Roadmap to Reducing Child Poverty, National Academies Press, 2019, https://www.nap.edu/read/25246.
[5] David Brady and Zachary Parolin, “The Levels and Trends in Deep and Extreme Poverty in the U.S., 1993-2016,” Forthcoming at Demography, November 10, 2019, https://osf.io/utpg2/. Consistent with their analysis, we also find that deep poverty for childless adults increased between 1993 and 2016 (see Appendix Table 4a).
[6] Unemployment stood at 5.6 percent in 1995 and 5.1 percent in 2005. Each year represented the fourth full year of economic growth following a recession.
[7] Figures are based on the marital status of the child’s parent (or other family head if no parent is present). An unmarried partner may or may not be present. An alternative approach is to look at the marital status of the head of the SPM family — a larger family unit that could include grandparents, aunts or uncles, or other relatives. Among children in SPM family units headed by a woman with no spouse and no partner present, the children’s deep poverty rate rose from 5.9 percent in 1995 to 7.9 percent in 2005.
[8] LaDonna Pavetti, “TANF Studies Show Work Requirement Proposals for Other Programs Would Harm Millions, Do Little to Increase Work,” Center on Budget and Policy Priorities, November 13, 2018, https://www.cbpp.org/research/family-income-support/tanf-studies-show-work-requirement-proposals-for-other-programs-would.
[9] U.S. Department of Health and Human Services Administration for Children and Families, “Temporary Assistance for Needy Families – 12th Annual Report to Congress,” January 2018, https://www.acf.hhs.gov/sites/default/files/ofa/12th_annual_tanf_report_to_congress_final.pdf, Fig. 2-A.
[10] Ife Floyd, Ashley Burnside, and Liz Schott, “TANF Reaching Few Poor Families,” Center on Budget and Policy Priorities, updated November 28, 2018, https://www.cbpp.org/research/family-income-support/tanf-reaching-few-poor-families.
[11] Robert A. Moffitt, “The Deserving Poor, the Family, and the U.S. Welfare System,” Demography, Vol. 52, No. 3, June 2015, https://www.ncbi.nlm.nih.gov/pmc/articles/PMC4487675/pdf/nihms699516.pdf; Hilary W. Hoynes and Diane Whitmore Schanzenbach, “Safety Net Investments in Children,” Brookings Papers on Economic Activity, Spring 2018, https://www.brookings.edu/wp-content/uploads/2018/03/HoynesSchanzenbach_Text.pdf.
[12] Robert Greenstein, Brynne Keith-Jennings, and Dottie Rosenbaum, “Factors Affecting SNAP Caseloads,” Center on Budget and Policy Priorities, August 8, 2018, https://www.cbpp.org/research/food-assistance/factors-affecting-snap-caseloads.
[13] Mark Nord and Mark Prell, “Food Security of SNAP Recipients Improved Following the 2009 Stimulus Package,” Amber Waves, Vol. 9, No. 2, June 2011, https://ageconsearch.umn.edu/bitstream/121096/2/02FoodSecuritySNAP.pdf.
[14] Arloc Sherman, “Poverty and Financial Distress Would Have Been Substantially Worse in 2010 Without Government Action, New Census Data Show,” Center on Budget and Policy Priorities, November 7, 2011, www.cbpp.org/cms/?fa=view&id=3610.
[15] Danilo Trisi and Matt Saenz, “Economic Security Programs Cut Poverty Nearly in Half Over Last 50 Years,” Center on Budget and Policy Priorities, updated November 26, 2019, https://www.cbpp.org/research/poverty-and-inequality/economic-security-programs-cut-poverty-nearly-in-half-over-last-50.
[16] Sample sizes for children in deep poverty from other racial and ethnic groups in the Current Population Survey were too small to draw reliable conclusions about trends over time, so we focused our analysis on Black and Latino children.
[17] The figure in 2005 was 76 percent, not statistically different from 1995’s figure of 74 percent.
[18] For more on the role of government in such discrimination, see Elizabeth Hinton, From the War on Poverty to the War on Crime, Harvard University Press, 2016; Michelle Alexander, The New Jim Crow, The New Press, 2012; and Richard Rothstein, The Color of Law, Liveright, 2017.
[19] Marianne Bertrand and Sendhil Mullainathan, “Are Emily and Greg More Employable than Lakisha and Jamal? A Field Experiment on Labor Market Discrimination,” NBER Working Paper No. 9873, July 2003, http://www.nber.org/papers/w9873. Another study found that among low-wage job seekers, Black applicants with no criminal record were no more likely to receive a call back or job offer than white applicants with the same qualifications and a criminal record. Devah Pager, Bruce Western, and Bart Bonikowski, “Discrimination in a Low-Wage Labor Market: A Field Experiment,” IZA Discussion Paper No. 4469, October 2009, http://ftp.iza.org/dp4469.pdf.
A meta-analysis of every available field experiment of recent decades that tested job discrimination in hiring found no change in discrimination against African American job applicants today compared to 1989. Lincoln Quillian et al., “Meta-analysis of field experiments shows no change in racial discrimination in hiring over time,” Proceedings of the National Academy of Sciences, September 12, 2017, http://www.pnas.org/content/early/2017/09/11/1706255114.
[20] Unpublished CBPP analysis based on population data from the Census Bureau’s Current Population Survey and caseload data from the U.S. Department of Health and Human Services and state agencies. For more information on the caseload data used and the decline in TANF’s reach, see Floyd, Burnside, and Schott, op. cit. Nationwide, AFDC/TANF caseloads declined by 71 percent between 1995 and 2016. Caseloads in the median state declined 75 percent. For population totals, we averaged three years of CPS data centered on 1995.
[21] See for example, Ariel Kalil, Kristin S. Seefeldt, and Hui-chen Wang, “Sanctions and Material Hardship under TANF,” Social Service Review, December 2002, https://www.jstor.org/stable/10.1086/342998; and Chi-Fang Wu et al., “How Do Welfare Sanctions Work?” Institute for Research on Poverty, June 2004, https://www.irp.wisc.edu/publications/dps/pdfs/dp128204.pdf.
[22] Joe Soss, “The Racial Biases of the Welfare System,” Spotlight on Poverty & Opportunity, April 28, 2014, https://spotlightonpoverty.org/spotlight-exclusives/the-racial-biases-of-the-welfare-system.
[23] According to the official poverty measure, 6.0 million children, or 8.2 percent of all children, were in deep poverty in 2016. According the SPM data without any corrections, 3.3 million children, or 4.4 percent of all children, were in deep poverty in 2016.
[24] Alma Vigil, “Trends in Supplemental Nutrition Assistance Program Participation Rates: Fiscal Year 2010 to Fiscal Year 2017,” prepared for the Food and Nutrition Service, United States Department of Agriculture, September 2019, Table A.5A, https://fns-prod.azureedge.net/sites/default/files/resource-files/Trends2010-2017.pdf.
[25] National Academies, op. cit.
[26] Chuck Marr et al., “Working Families Tax Relief Act Would Raise Incomes of 46 Million Households, Reduce Child Poverty,” Center on Budget and Policy Priorities, April 10, 2019, https://www.cbpp.org/research/federal-tax/working-families-tax-relief-act-would-raise-incomes-of-46-million-households.
[27] Brynne Keith-Jennings, Joseph Llobrera, and Stacy Dean, “Links of the Supplemental Nutrition Assistance Program With Food Insecurity, Poverty, and Health: Evidence and Potential,” American Journal of Public Health, December 1, 2019, https://doi.org/10.2105/AJPH.2019.305325.
[28] Alisha Coleman-Jensen et al., “Household Food Security in the United States in 2018,” U.S. Department of Agriculture Economic Research Service, September 2019, https://www.ers.usda.gov/webdocs/publications/94849/err-270.pdf.
[29] Steven Carlson, Brynne Keith-Jennings, and Joseph Llobrera, “Policy Brief: More Adequate SNAP Benefits Would Help Millions of Participants Better Afford Food,” Center on Budget and Policy Priorities, July 30, 2019, https://www.cbpp.org/research/food-assistance/policy-brief-more-adequate-snap-benefits-would-help-millions-of.
[30] National Academies, op. cit., Table 6-3.
[31] Will Fischer, “Research Shows Housing Vouchers Reduce Hardship and Provide Platform for Long-Term Gains Among Children,” Center on Budget and Policy Priorities, October 7, 2015, https://www.cbpp.org/research/housing/research-shows-housing-vouchers-reduce-hardship-and-provide-platform-for-long-term.
[32] CBPP analysis of Department of Housing and Urban Development (HUD) custom tabulations of the 2017 American Housing Survey; 2017 HUD administrative data; fiscal year 2018 McKinney-Vento Permanent Supportive Housing bed counts; and the USDA FY2018 Multi-Family Fair Housing Occupancy Report.
[33] National Academies, op. cit., Table 6-3.
[34] Barbara Sard, Mary K. Cunningham, Robert Greenstein, “Helping Young Children Move out of Poverty by Creating a New Type of Rental Voucher,” US Partnership on Mobility from Poverty, February 2018, https://www.mobilitypartnership.org/helping-young-children-move-out-poverty-creating-new-type-rental-voucher.
[35] Ashley Burnside, “TANF at 23: Over 2.5 Million More Families Could Be Getting Cash Assistance, Work Supports,” Center on Budget and Policy Priorities, August 20, 2019, https://www.cbpp.org/blog/tanf-at-23-over-25-million-more-families-could-be-getting-cash-assistance-work-supports.
[36] Ashley Burnside and Ife Floyd, “More States Raising TANF Benefits to Boost Families’ Economic Security,” Center on Budget and Policy Priorities, December 9, 2019, https://www.cbpp.org/research/family-income-support/more-states-raising-tanf-benefits-to-boost-families-economic-security.
[37] Center on the Developing Child at Harvard University, “From Best Practices to Breakthrough Impacts: A Science-Based Approach to Building a More Promising Future for Young Children and Families,” May 2016, http://developingchild.harvard.edu/resources/from-best-practices-to-breakthrough-impacts/.
[38] Greg Duncan, Katherine Magnuson, and Elizabeth Votruba-Drzal, “Boosting Family Income to Promote Child Development,” Future of Children, Vol. 24, No. 1, Spring 2014, https://www.fcd-us.org/assets/2014/07/24_01_05.pdf.
[39] National Academies, op. cit.
[40] Arloc Sherman and Tazra Mitchell, “Economic Security Programs Help Low-Income Children Succeed Over Long Term, Many Studies Find,” Center on Budget and Policy Priorities, July 17, 2017, https://www.cbpp.org/research/poverty-and-inequality/economic-security-programs-help-low-income-children-succeed-over.
[41] Arloc Sherman, “Work Requirements for Cash Assistance Fueled Rise in Deep Poverty,” Center on Budget and Policy Priorities, November 13, 2018, https://www.cbpp.org/blog/work-requirements-for-cash-assistance-fueled-rise-in-deep-poverty.
[42] Gayle Hamilton and Charles Michalopoulos, “Job Search or Basic Education Participation First: Which Improves Welfare Recipients’ Earnings More in the Long Term?” MDRC, October 2016, https://www.mdrc.org/sites/default/files/NEWWS-final-Web.pdf.
[43] Bruce D. Meyer and Nikolas Mittag, “Using Linked Survey and Administrative Data to Better Measure Income: Implications for Poverty, Program Effectiveness and Holes in the Safety Net,” National Bureau of Economic Research Working Paper 21676, October 2015, https://www.nber.org/papers/w21676.
[44] Kathryn Shantz and Liana E. Fox, “Precision in Measurement: Using State-Level SNAP Administrative Records and the Transfer Income Model (TRIM3) to Evaluate Poverty Measurement,” U.S. Census Bureau Social, Economic, and Housing Statistics Division Working Paper #2018-30, November 2018, https://www.census.gov/content/dam/Census/library/working-papers/2018/demo/SEHSD-WP2018-15.pdf.
More from the Authors