Benefits of Expanding Child Tax Credit Outweigh Small Employment Effects
The House-passed COVID-19 relief bill, the American Rescue Plan, would temporarily increase the Child Tax Credit and make the full Child Tax Credit available to all children except those in families with the highest incomes (sometimes called making the credit “fully refundable”). This proposal would markedly reduce the number of children with incomes below the poverty line while narrowing the gap in poverty rates between white children and Black and Latino children. The strong benefits of the proposal far outweigh any potential reduction in employment. Researchers assessing a very similar proposal estimated that more than 99 percent of low- and moderate-income working adults affected by the proposal would remain employed after it takes effect.Researchers assessing a very similar proposal estimated that more than 99 percent of low- and moderate-income working adults affected by the proposal would remain employed after it takes effect.[1]
Research shows that poverty — and the hardships that poor children often face, including food insecurity and unstable housing — shortchange children’s futures, but research also shows that economic security programs such as the Child Tax Credit that reduce poverty improve children’s long-term health and educational outcomes, boosting their opportunities and benefitting the nation as a whole. The nation’s long-term success depends on the success of all our children and their parents, regardless of race, ethnicity, or income.
The proposed expansion would make the full Child Tax Credit available to 27 million children — including roughly half of all Black and Latino children — whose families now don’t get the full credit because their parents don’t earn enough. This proposal would lift 9.9 million children above or closer to the poverty line including 4.1 million Latino children, 2.3 million Black children, and 441,000 Asian American children. It would also lift 1.1 million children out of “deep poverty,” raising their family incomes after taxes above 50 percent of the poverty line ($10,980 a year for a family of three).[2]
It’s particularly important to enact this expansion now because it would help alleviate the high rates of hardship that families with children are facing during the current health and economic crisis. Children in families with low income, disproportionately children of color, have been particularly hard hit by the pandemic and its related economic and educational harms.
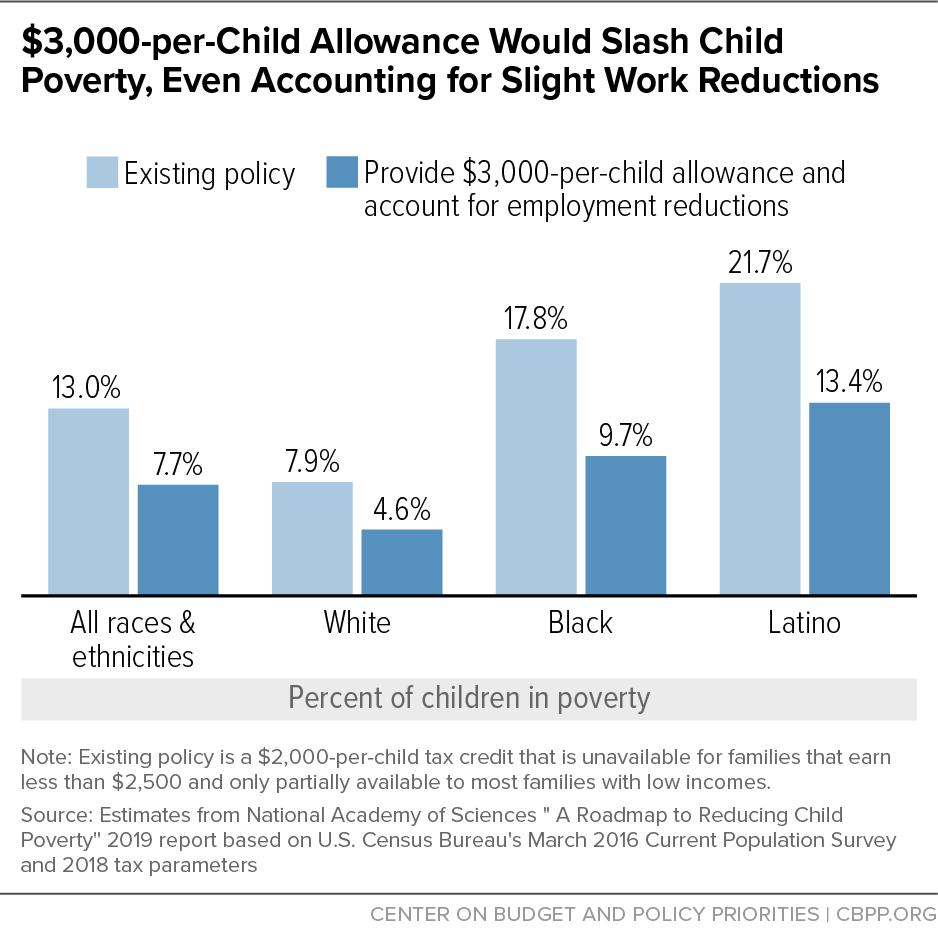
Some have raised concerns that proposals to expand the Child Tax Credit and make the full credit available to all children in families with low income, including those in which a parent is out of work, will discourage work. Those concerns are overstated and misguided. While an expanded credit could slightly reduce work, the anti-poverty effects of expanding the Child Tax Credit would far outweigh any small reductions in employment. A $3,000-per-child allowance would substantially reduce child poverty and racial inequities even after accounting for employment reductions, a 2019 National Academy of Sciences (NAS) expert panel’s report on reducing child poverty found.[3] (See Figure 1.)
Expanding Child Tax Credit Would Ease Hardship, Improve Children’s Prospects
The proposal in the House bill would make the full Child Tax Credit available to children in families with low earnings or that lack earnings in a year, and it would increase the credit’s maximum amount to $3,000 per child and $3,600 for children under age 6. It would also extend the credit to 17-year-olds. The increase in the maximum amount would begin to phase out for heads of households making $112,500 and married couples making $150,000.
The NAS expert panel’s report on reducing child poverty noted the causal connection between raising the incomes of children growing up in poverty through policies like the Child Tax Credit and higher birthweights, lower maternal stress, better childhood nutrition, and better academic outcomes.[4] When families received additional income supports for their children, those children had better health and stronger earnings as adults, the NAS report also explained. By reducing future medical expenditures and other costs of poverty, these steps have broad benefits for the nation as a whole.
Additional research similarly concludes that investing in families and children through the Child Tax Credit benefits all of society. Researchers studied the impact of increasing the Child Tax Credit to levels proposed by the House economic relief bill. By boosting the future earnings and tax payments of child beneficiaries, improving the health and longevity of parents and children, and reducing health care, child protection, and criminal justice costs, the Child Tax Credit expansion would likely provide large and lasting gains for the next generation, the researchers project.[5]
Poverty rates in most other wealthy nations are lower than in the United States because those countries have much stronger policies to shore up incomes of households that don’t earn enough to make ends meet, such as providing a child allowance. Notably, Canada, which recently expanded its child allowance, lowered child poverty from 16.5 percent in 2015 to 10.8 percent in 2018.[6]
Conversely, there are serious dangers for children when their families have low and unsteady income. One is toxic stress, the excessive or prolonged activation of the body’s stress response. When parents are stressed about their inability to pay the rent or afford food, they cannot effectively buffer children from the stress caused by such deprivation, which can overload children’s biological systems and lead to negative long-term health, educational, and employment consequences.[7]
Black, American Indian and Alaska Native, and Latino children are disproportionally represented among children in families with very low and unsteady income[8] and are, therefore, more likely to experience toxic stress than white children.[9] Black and other parents of color with low income not only struggle with making ends meet but also experience racism in society, such as discrimination in the labor or housing market, making it harder for them to serve as a protective buffer against stressful events.[10] Past and present discrimination in both private markets and public policies has left poverty rates more than twice as high among Black and Latino children as among white children.[11]
Expanding the Child Tax Credit would help alleviate the high rates of hardship that families with children are facing during the current health and economic crisis. These high hardship rates raise serious concerns about the long-term consequences of the current crisis for children’s health and their academic outcomes. At least 10 million children have a family member who is unemployed or who lacks paid work because of the pandemic.[12] More than one-third of children in renter households — 6 million children — live in a household that is not caught up on rent.[13]
Particularly alarming is the sharp rise in food hardship among children. In data collected January 6-18, 2021, between 7 and 11 million children lived in a household where children weren’t eating enough because the household couldn’t afford it in the last seven days. In data collected in December 2019, 1.1 million children lived in a household where children were sometimes or often not eating enough because the household couldn’t afford it at some point in the last 30 days.[14]
Food hardship is disproportionately affecting children in Black and Latino households. Up to 27 percent of children in Black households and up to 26 percent of children in Latino households live in households where the children didn’t eat enough in the last seven days because the household couldn’t afford it, compared to up to 9 percent of children in white households.[15]
An expanded Child Tax Credit could help stabilize families and their living circumstances, reducing stress that can impede parents’ ability to care for their children or to take the steps necessary to find employment when they are able to work. A single mother with a 2-year-old daughter and 8-year-old son, who is out of work for the year due to a health condition, now receives no Child Tax Credit. Under the House plan, she would receive the full Child Tax Credit of $3,600 for her daughter and $3,000 for her son to help with the children’s expenses. These additional resources, while not enough to live on for a long period of time, could help the mother afford rent, food, diapers and wipes, internet service, and other essentials that better enable her to focus on caring for herself and her children. Similarly, a parent working in a low-paid job who can only get part-time work during the pandemic would receive a sizable increase in her Child Tax Credit under the American Rescue Plan, helping her pay her bills and weather this crisis.
Concerns That the Child Tax Credit Expansion Would Discourage Work Are Overstated
“The NAS expert panel found that almost all employed people in low- and moderate-income families with children would continue to work after the implementation of a $3,000-per-child allowance.”
While some have raised the concern that an expanded Child Tax Credit would discourage work, the evidence suggests that those arguments are overstated and misguided. The NAS expert panel found that almost all employed people in low- and moderate-income families with children (99.5 percent) would continue to work after the implementation of a $3,000-per-child allowance and more than four-fifths (82 percent) would not reduce their work hours at all.[16] The researchers estimated that employed parents covered by the child allowance who reduced their work hours would do so only slightly — an average of about one hour per week.[17]
Among parents who decided to work less, a small reduction in work hours may well improve child well-being. A parent who reduced their hours slightly in a job that forces them to work odd hours, for example, would free up parents’ time, relieve parental stress, and allow the parent to spend more time with their child, which supports healthy child development, many studies suggest.[18] In fact, allowing parents to spend more time with their children was a hope for many policymakers when they passed the Child Tax Credit in 1997.[19]
Many working parents work long hours. One in seven (14.7 percent) working parents in families with low or moderate incomes in 2019 usually worked more than 40 hours per week, and they averaged 52 hours of work per week, analysis of Census data shows.[20] In addition, a substantial share of working parents — especially lower-income working parents — work irregular shifts. Fully 27 percent of working mothers with low income whose children are under age 12 regularly work an evening or night shift or work an irregular schedule that changes daily or weekly.[21] If parents have adequate income to care for their children, a small reduction in parental work hours is likely to benefit many of these children.
In fact, the small employment effects of a $3,000-per-child allowance can actually be converted into employment increases when combined with other work-supporting policies such as increased child care subsidies and an increase in the Earned Income Tax Credit (EITC), the NAS report further showed. (Notably, the House-passed American Rescue Plan also includes significant support for child care subsidies. And, unlike under the Romney Child Tax Credit plan — which called for a similar expansion in the Child Tax Credit — the House economic relief bill does not pair the Child Tax Credit expansion with a cut in the EITC.)
Critics of Expanding the Child Tax Credit to Families With Little or No Earnings Ignore Why Some Parents May Not Be Working
Those who oppose providing the full Child Tax Credit to families with very low income on the basis of specious arguments about work incentives ignore the more serious reasons families cannot work. Instead, they often promote ineffective work requirements in the Temporary Assistance for Needy Families (TANF) program[22] that have long been associated with racist rhetoric and divisive politics.
Low-wage jobs, upon which many families in poverty rely, are highly unstable. These jobs have little wage growth over time, fluctuating hours, and high turnover.[23] This instability is associated with low-wage workers experiencing unemployment more often than people working better-paying jobs.[24] Limiting the availability of the Child Tax Credit based on earnings means these families would continue to miss out on stabilizing supports that reduce poverty and hardship.
Historical and ongoing racial discrimination has caused opportunities for fair housing, equal education, and employment to differ greatly across lines of race and ethnicity.[25] As a result, people of color are overrepresented in unstable, low-wage jobs, and Black and Latino children are more likely to be in families that have low earnings and experience periods of joblessness and, thus, don’t receive the full benefit of the Child Tax Credit.
A parent may not be working at a particular time for various reasons. During the current crisis, millions of people are not working because of the impact of the pandemic on their employer, because they are ill or caring for someone who is ill with symptoms associated with COVID-19, or because schools or child care programs are closed. The Labor Department reported that in January 14.8 million adults were unable to work at some point in the last four weeks because their employer closed or lost business due to the coronavirus pandemic.[26] Moreover, among people not in the labor force in January, some 4.7 million reported that the pandemic prevented them from looking for work in the last four weeks. [27]
But even during good times, parents are out of work for a variety of important reasons. In 2019, before the pandemic, 1 million parents listed attending school as their primary reason for not working some or all of the year and over 2 million listed illness or disability — not all of whom receive federal disability benefits.[28] Others were in between jobs, taking care of a very young child, or caring for a family member who has an illness or disability.
Denying support that can help children thrive because their parents are not currently employed harkens back to inaccurate and racist stereotypes of Black women as “welfare queens” who only had children to receive more assistance and needed to be forced to work.[29] Unfortunately, TANF work requirements — often held up as a model by some critics of the Child Tax Credit expansion — weren’t designed to ensure that parents would get a well-paying, stable job.[30] Instead, they have been used to deny TANF cash assistance to large numbers of very poor children, disproportionately children of color, leaving many with no regular means of support.[31]
Policymakers can take a different path by expanding the Child Tax Credit and making the full credit available to all low-income children as an effective mechanism for reducing poverty and hardship and improving children’s outcomes.
End Notes
[1] National Academies of Sciences, Engineering, and Medicine, A Roadmap to Reducing Child Poverty, National Academies Press, 2019, https://www.nap.edu/read/25246.
[2] Chuck Marr et al., “House Ways and Means COVID Relief Bill Includes Critical Expansions of Child Tax Credit and EITC,” Center on Budget and Policy Priorities, February 9, 2021, https://www.cbpp.org/research/federal-tax/house-ways-and-means-covid-relief-bill-includes-critical-expansions-of-child.
[3] National Academies of Sciences, Engineering, and Medicine, op. cit.
[4] Ibid.
[5] Irwin Garfinkel et al., “The Costs and Benefits of a Child Allowance,” Center on Poverty and Social Policy at Columbia University, February 18, 2021, https://www.povertycenter.columbia.edu/news-internal/2021/child-allowance/cost-benefit-analysis.
[6] Statistics Canada. Table 11-10-0135-01 Low income statistics by age, sex and economic family type. https://doi.org/10.25318/1110013501-eng.
[7] Harvard University Center for the Developing Child, “Connecting the Brain to the Rest of the Body,” https://46y5eh11fhgw3ve3ytpwxt9r-wpengine.netdna-ssl.com/wp-content/uploads/2020/06/InBrief-Connecting-the-Brain-to-the-Rest-of-the-Body.pdf.
[8] Uyen Sophie Nguyen, Sheila Smith, and Maribel R. Granja, “Young Children in Deep Poverty: Racial/Ethnic Disparities and Child Well-Being Compared to Other Income Groups,” National Center for Children in Poverty, October 2020, https://www.nccp.org/wp-content/uploads/2020/10/Deep-Poverty-Report-11.11.20_Final.pdf.
[9] Leila Morsy and Richard Rothstein, “Toxic stress and children’s outcomes: African American children growing up poor are at greater risk of disrupted physiological functioning and depressed academic achievement,” Economic Policy Institute, May 1, 2019, https://files.epi.org/pdf/164823.pdf.
[10] Harvard University Center for the Developing Child, “How Racism Can Affect Child Development,” https://developingchild.harvard.edu/resources/racism-and-ecd/.
[11] Danilo Trisi and Matt Saenz, “Economic Security Programs Reduce Overall Poverty, Racial and Ethnic Inequities,” Center on Budget and Policy Priorities, January 28, 2021, https://www.cbpp.org/research/poverty-and-inequality/economic-security-programs-reduce-overall-poverty-racial-and-ethnic.
[12] Chad Stone and Matt Saenz, “Labor Market Weaker Than Headline Numbers Suggest,” Center on Budget and Policy Priorities, March 1, 2021, https://www.cbpp.org/research/economy/labor-market-weaker-than-headline-numbers-suggest.
[13] Claire Zippel and Arloc Sherman, “Bolstering Family Income Is Essential to Helping Children Emerge Successfully From the Current Crisis,” Center on Budget and Policy Priorities, updated February 25, 2021, https://www.cbpp.org/research/poverty-and-inequality/bolstering-family-income-is-essential-to-helping-children-emerge.
[14] Ibid.
[15] Ibid.
[16] The NAS report estimates that 25.487 million people in families below 200 percent of the Supplemental Poverty Measure would be employed after the enactment of a $3,000-per-child allowance. That compares to 25.607 million people employed in such families under existing policy. The NAS report estimates that 4.552 million people in families below 200 percent of the Supplemental Poverty Measure would opt to work fewer hours, thereby decreasing their earnings. For these figures, see “CA Main Sheet” tab in Appendix E: TRIM3 Summary Tables found here: https://www.nap.edu/catalog/25246/a-roadmap-to-reducing-child-poverty#resources. Below 200 percent of the Supplemental Poverty Measure is roughly equivalent to the lower half of the disposable income distribution.
[17] The NAS report estimates that the enactment of a $3,000-per-child allowance would result in 277.4 million fewer hours worked, economy-wide. (See Table CA-2, p. 546.) That reduction in hours is spread over 6.079 million people of all incomes who are predicted to work fewer hours and therefore decrease their earnings and 149,000 people who are predicted to stop working. (See Table CA-3, p. 548.) Those figures yield 44.5 fewer work hours per year for each worker or 0.9 fewer hours per week over the 52 weeks of the year. We find a similar result even if we focus on the 4.552 million people in families below 200 percent of the Supplemental Poverty Measure that the NAS report estimates would decrease their earnings and assume that all reductions in hours worked occur within that group. If we divide the 277.4 million hours by those workers, we find an average reduction of hours worked per person of 1.2 hours per week.
[18] Carolyn J. Heinrich, “Parents’ Employment and Children’s Wellbeing,” Future of Children, Vol. 24, No. 1, Spring 2014, https://files.eric.ed.gov/fulltext/EJ1029033.pdf; Heather Sandstrom, “Why Parents’ Nonstandard Work Schedules Matter for Children: Is It the Hours or the Instability?” Urban Institute, August 31, 2015, https://www.urban.org/urban-wire/why-parents-nonstandard-work-schedules-matter-children-it-hours-or-instability; Jianghong Li et al., “Parents’ Nonstandard Work Schedules and Child Well-Being: A Critical Review of the Literature,” Journal of Primary Prevention, Vol. 35, No. 1, 2013, https://link.springer.com/article/10.1007/s10935-013-0318-z.
[19] Ceci Connolly, “Many on Hill Claim Parentage of Plan on Child Tax Credits,” Washington Post, July 22, 1997, https://www.washingtonpost.com/archive/politics/1997/07/22/many-on-hill-claim-parentage-of-plan-for-child-tax-credits/454363f4-38dd-41c9-933a-03bc19f052ba/.
[20] CBPP analysis of March 2020 Current Population Survey. We define low- and moderate-income families as those below 200 percent of the Supplemental Poverty Measure, which is roughly equivalent to the lower half of the disposable income distribution.
[21] Sandstrom, op. cit.
[22] LaDonna Pavetti, “TANF Studies Show Work Requirement Proposals for Other Programs Would Harm Millions, Do Little to Increase Work,” Center on Budget and Policy Priorities, November 13, 2018, https://www.cbpp.o. rg/research/family-income-support/tanf-studies-show-work-requirement-proposals-for-other-programs.
[23] Kristin F. Butcher and Diane Whitmore Schanzenbach, “Most Workers in Low-Wage Labor Market Work Substantial Hours, in Volatile Jobs,” Center on Budget and Policy Priorities, July 24, 2018, https://www.cbpp.org/research/poverty-and-inequality/most-workers-in-low-wage-labor-market-work-substantial-hours-in.
[24] Ibid.
[25] Richard Rothstein, The Color of Law: A Forgotten History of How Our Government Segregated America, Liveright, 2017; U.S. Bureau of Labor Statistics (BLS), “Labor force characteristics by race and ethnicity, 2018,” BLS Report 1082, October 2019, https://www.bls.gov/opub/reports/race-and-ethnicity/2018/home.htm.
[26] Bureau of Labor Statistics, Supplemental data measuring the effects of the coronavirus (COVID-19) pandemic on the labor market, Table 5, https://www.bls.gov/cps/effects-of-the-coronavirus-covid-19-pandemic.htm.
[27] Bureau of Labor Statistics, Supplemental data measuring the effects of the coronavirus (COVID-19) pandemic on the labor market, Table 9, https://www.bls.gov/cps/effects-of-the-coronavirus-covid-19-pandemic.htm.
[28] CBPP analysis of March 2020 Current Population Survey.
[29] Elisa Minoff, “The Racist Roots of Work Requirements,” Center for the Study of Social Policy, February 2020, https://cssp.org/wp-content/uploads/2020/02/Racist-Roots-of-Work-Requirements-CSSP-1.pdf.
[30] Ali Safawi and LaDonna Pavetti, “Most Parents Leaving TANF Work, But in Low-Paying, Unstable Jobs, Recent Studies Find,” Center on Budget and Policy Priorities, November 19, 2020, https://www.cbpp.org/research/family-income-support/most-parents-leaving-tanf-work-but-in-low-paying-unstable-jobs-recent.
[31] Pavetti, op. cit.
Más de los autores

Areas of Expertise