Table of Contents
Federal rental assistance programs help people and families with low incomes afford good-quality, stable housing and make ends meet. Federal rental assistance provides vital support to over 10 million people in roughly 5 million households, primarily through three major programs — Housing Choice Vouchers, Section 8 Project-Based Rental Assistance, and Public Housing.[1] Research shows that rental assistance sharply cuts homelessness, housing instability, and overcrowding, and improves a range of other outcomes for participants. But it also could do more to help people live in the community of their choosing, in a way that maximizes their health and well-being.
This analysis provides a window into how local patterns of economic and racial segregation shape where assisted people live across the 100 largest (most populous) metropolitan areas.[2] These metro areas span the country, from coastal metros like New York (21 million people) and Los Angeles (13 million) to smaller metros in the Midwest and South, like Wichita, Kansas (655,000) and Jackson, Mississippi (575,000). Forty-three of the metropolitan areas in our analysis have populations of under 1 million people.
We examine whether federal rental assistance programs enable people receiving assistance to live in an economically diverse range of neighborhoods, as measured by the neighborhood’s poverty rate. We find that these programs help people afford housing in a wide variety of neighborhoods across central cities and their suburbs, often where the standard of living is high. But many assisted households — like other renter households with similarly low incomes — live in neighborhoods with high poverty rates, under-resourced schools, and a shortage of basic services like grocery stores. Place-based rental assistance, where rental subsidies are attached to particular properties, is especially likely to be in neighborhoods with higher rates of poverty.
To understand the location of assisted housing is to know that past and present racist policies are largely responsible for the prevalence of separate and unequal neighborhoods. Public and private practices such as stealing land from Indigenous people; racial covenants and redlining, which actively enforced segregation by preventing people from purchasing homes in certain neighborhoods based on race, ethnicity, and religion; and “urban renewal” programs that allowed governments to displace predominantly communities of color in the name of redevelopment and highway construction[3] directly shape who gets to live where in the U.S.
But these historical practices are not the only culprits. Modern-day forces — gentrification, zoning regulations, immigration and asylum policy, community members fighting local affordable housing developments, landlord discrimination — also play a major role in the inequities in the metropolitan landscape.
This analysis looks at the location of households who use the three largest federal rental assistance programs — which account for 84 percent of all households receiving federal rental assistance — and compares them to the locations of all rental units and of rental units that are affordable to people using a housing voucher. We group households and rental units based on the neighborhood poverty rate, a proxy for the kind of schools, jobs, parks, and grocery stores the households likely will have access to. Neighborhoods with high poverty rates often have less access to highly resourced schools, job opportunities, public services, transit, and grocery stores,[4] but a full analysis of additional neighborhood characteristics is beyond the scope of this report. We find that some rental assistance programs are better than others at providing households with more neighborhood choice, allowing them to live in areas best suited to their needs.
Meanwhile, high housing costs, housing instability, and homelessness disproportionately affect people of color, who — due to systemic racism in the nation’s economic, education, and housing systems — are more likely to have lower incomes and rent their homes. Providing enough funding to help every person who needs housing assistance is a key step in reducing harm to those experiencing housing instability or homelessness.
Housing justice requires repair, from both current and past harm. The harm caused by racist housing policies reaches back generations. Because people of color, particularly those with lower incomes, have been denied freedom of choice in the housing market, housing policies and programs must at minimum create the conditions for free choice now. Likewise, federal, state, and local policymakers should ensure that all people with low incomes can afford stable, good-quality housing, that they can freely decide to stay in their current neighborhood or move to another location of their choice — and that wherever they live, they have access to the community resources and amenities they need to thrive.
Rental assistance programs alone cannot undo the decades of racist policies behind today’s unequal neighborhoods or gaping income and wealth inequality. Needed housing policy steps include eliminating landlord discrimination and ensuring that people with low incomes can rent housing they can afford in a wide range of neighborhoods across every city, suburb, or small town. They also include policies that change cities themselves, until all neighborhoods provide opportunity and safety to everyone who lives there. Ultimately, making people whole will require a multifaceted set of solutions, from revitalizing neighborhoods to providing educational and economic opportunities to those historically denied them. This analysis offers a first step toward understanding what housing policy changes are needed as part of a larger strategy to achieve this goal.
Each of the 100 metropolitan areas in this analysis has a unique story. But by highlighting a handful of metro areas, as this piece does, we can illustrate major trends across the country. Readers can also explore data for all 100 metropolitan areas using our interactive mapping tool and the interactive tables in the appendix.[5] The data can be used to identify the people and communities whom racial and economic segregation have most affected. It is then up to federal, state, and local policymakers to develop solutions in collaboration with these communities, ensuring that their needs and voices are heard and reflected.

Main Findings From 100 Metro Analysis: Some Programs Provide Greater Housing Choice
Our main findings for the 100 most populous metropolitan areas are:
Over half of public housing residents live in high-poverty neighborhoods, often reflecting local patterns of economic and racial segregation. The Public Housing program is the nation’s oldest form of federal rental assistance, dating back to the 1930s. Prevailing housing policies at the time of its inception, like restrictive covenants and redlining, fostered separate and unequal neighborhoods based on race and class. During much of the period when the government constructed the bulk of public housing, it segregated most developments, with separate, more favorable developments for white residents than for Black residents. Many white residents eventually moved out of public housing and went on to purchase homes, while policies like redlining and lending discrimination denied Black residents the same opportunities. Today, the majority of the 1.6 million people living in public housing are in neighborhoods with high rates of poverty. Just 12 percent of all occupied rental units in the 100 largest metros are in high-poverty areas. By comparison, 51 percent of all households assisted by public housing are. Because rental assistance in public housing is tied to the housing development, residents must continue to live in public housing to receive rental assistance, even if they would prefer to move to a different neighborhood.
Some 56 percent of families with children in public housing are in a high-poverty neighborhood. That is in part because discrimination has often made it especially difficult to build public and other affordable housing in lower-poverty areas if the housing would serve families with children. Resistance to developments serving this population is often motivated by racist stereotypes about low-income families with children, but other factors such as financial challenges to building larger units can also play a role. Today, little public housing is in low-poverty areas: Only 1 in 10 households assisted by public housing in the 100 largest metros live in low-poverty neighborhoods. (See Figure 1.)
Project-based rental assistance provides a critical source of rental assistance in a more diverse range of neighborhoods than public housing. Congress in 1974 established Section 8 Project-Based Rental Assistance (PBRA), under which private development owners sign rental assistance agreements with the Department of Housing and Urban Development (HUD). Nearly 30 percent of developments receiving this assistance are in high-poverty neighborhoods. (See Figure 1.) However, roughly 1 in 5 households in the program live in low-poverty neighborhoods, meaning PBRA provides a greater range of neighborhood options than public housing. PBRA is especially critical for older adults with low incomes — who head over half of the 1.2 million households in the program — allowing them to age in place.[6]

Renters with a housing voucher are more likely to live in low-poverty areas, and less likely in high-poverty areas, than those with other federal rental assistance. Congress authorized the Housing Choice Voucher (HCV) program in 1974. Today it is the largest form of federal rental assistance, assisting roughly 5 million people in over 2 million households. Unlike Public Housing or PBRA, most housing vouchers are tenant based, meaning the voucher is issued to an individual or family to use in the private rental market. Households using vouchers are more likely to rent in neighborhoods where the poverty rate is 10 percent or less, despite sometimes facing discrimination from landlords that refuse to accept vouchers. Housing Choice Voucher program participants are equally likely to be in a low- or high-poverty neighborhood: about 1 in 5 households using vouchers live in low-poverty neighborhoods, a notably larger share than public housing residents.
Renters with a tenant-based housing voucher are the most likely to live in low-poverty, and least likely in high-poverty, areas. Nearly 1 in 4 voucher holders (23 percent) with a tenant-based voucher live in low-poverty neighborhoods, the highest share among all the federal rental assistance programs in this analysis. Some critics of the voucher program have expressed concern that voucher recipients tend to live in high-poverty neighborhoods. However, in the 100 largest metros, people using tenant-based vouchers are not significantly more likely to live in high-poverty neighborhoods than similar but likely unassisted renters. Nineteen percent of extremely low-income renters who pay over half their income for housing live in high-poverty neighborhoods.[7] These renters would likely be unassisted but eligible and in need of rental assistance based on their income and high rent cost burdens.[8] Where voucher holders live is often a reflection of pre-existing patterns of economic and racial segregation in a metro area, which constrains housing choice for all extremely low-income renters. While some households use their voucher to move to a new neighborhood, others use the voucher to make the home they are in more affordable. Just 21 percent of households with a tenant-based voucher live in high-poverty neighborhoods, compared to 19 percent of extremely low-income households (those below the poverty line or 30 percent of the local median income) who face severe rent cost burdens (pay more than half of their income for housing).[9]
But it is important for renters to have choice. While most Housing Choice Vouchers are tenant based, meaning people can use them to rent any private apartment that meets program guidelines, project-based vouchers are attached to specific units. Project-based vouchers are distributed very similarly to PBRA. Thirty percent of project-based vouchers are in high-poverty neighborhoods, while 18 percent are in low-poverty neighborhoods.

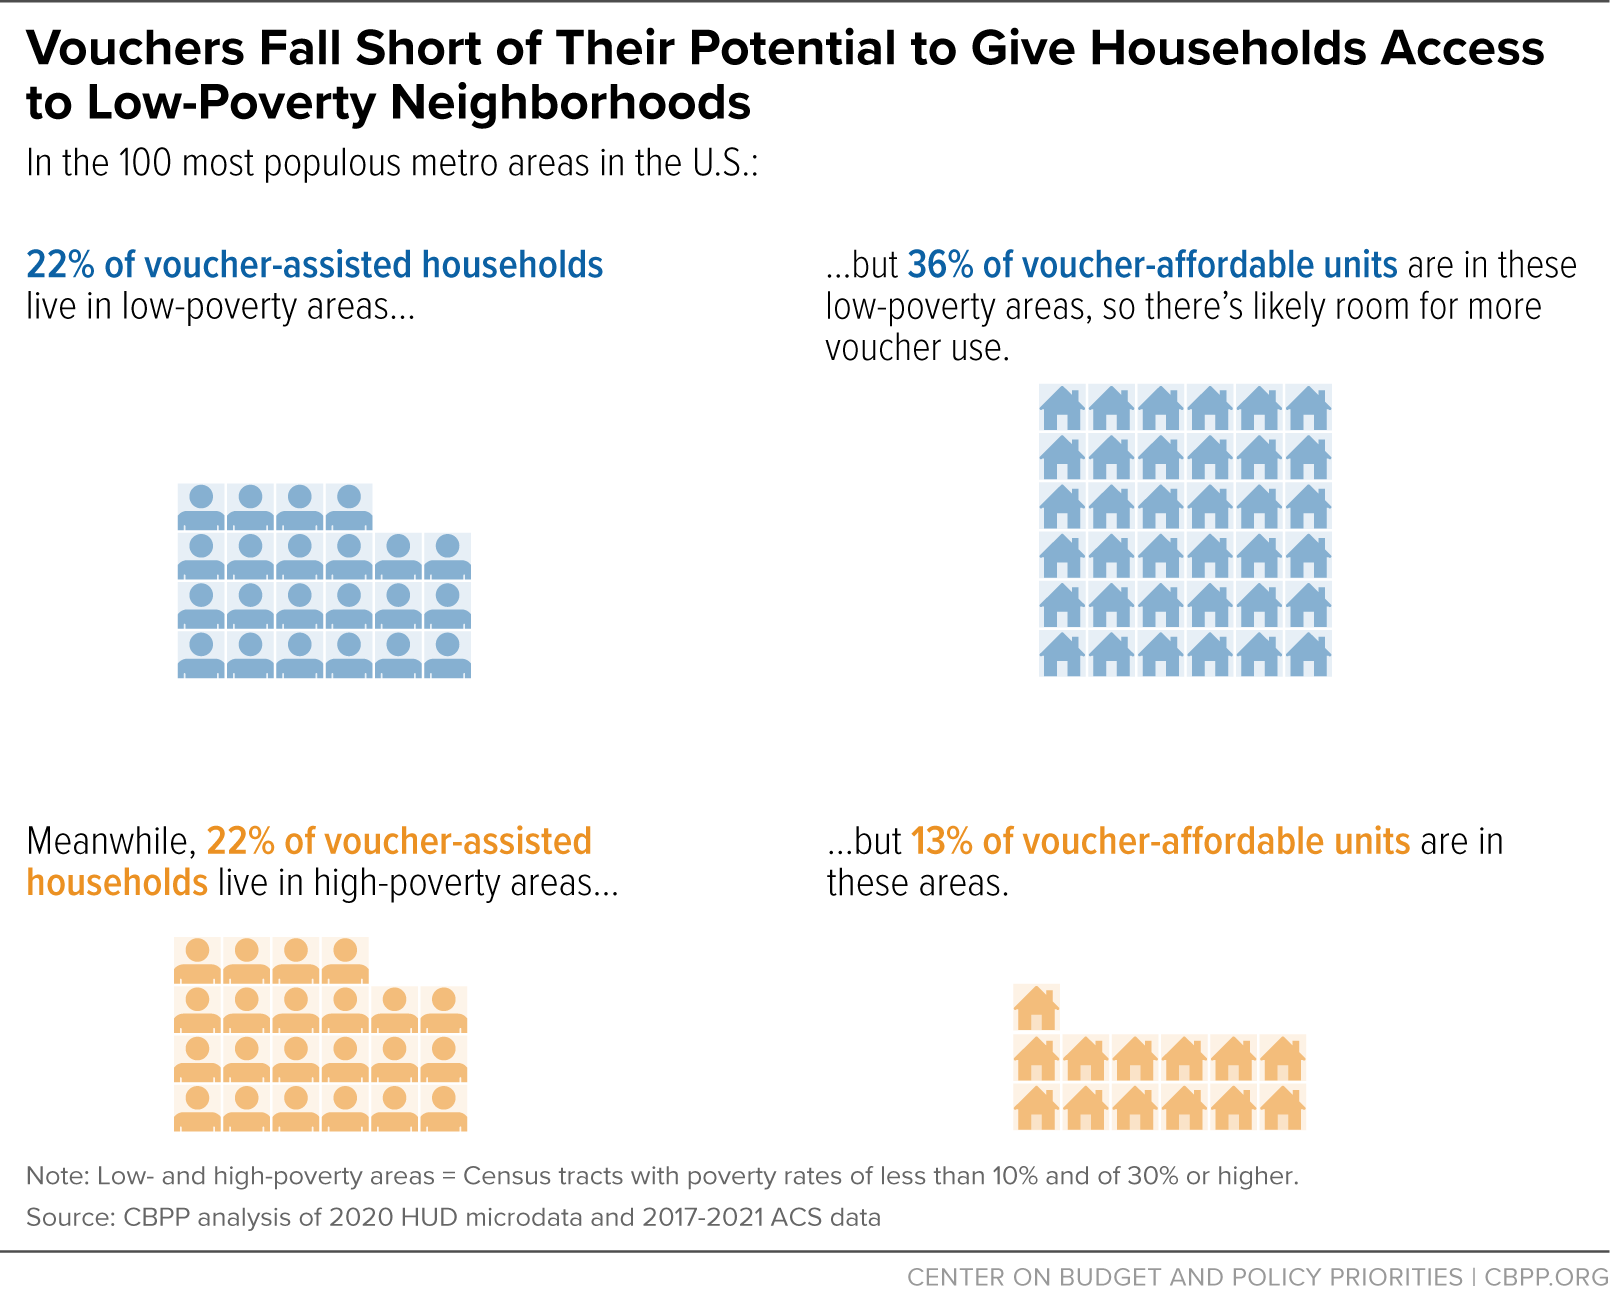
Over a third of all units affordable to renters using vouchers in the 100 largest metros are in low-poverty neighborhoods, but not all these units are available or accessible to voucher holders. Twenty-two percent of families using vouchers live in low-poverty neighborhoods, despite 36 percent of voucher-affordable units — units whose rents are low enough to be covered by the voucher subsidy — being located in low-poverty neighborhoods. (See Figure 2.) In some metros, low rental vacancy rates may partly explain this mismatch. Or, studio and one-bedroom units may be affordable with a voucher but too small for many families with children.[10] But landlord discrimination also plays a role: in low-poverty neighborhoods, landlords are significantly more likely to refuse to rent to someone with a voucher, research shows.[11] Some states and localities have passed “source of income” protections — which prohibit landlords from discriminating against potential leasers based on the kind of income they will use to pay rent — as a way to prevent this discrimination, but they do not always enforce them, and there is no national law against the practice.
Across Three Programs in Three Metros, Federal Rental Assistance Could Be Providing More Housing Choice and Access to Resources
Washington, D.C.’s Public Housing Reflects Deeply Entrenched Racial Segregation
Established in 1937, the Public Housing program is the nation’s oldest form of federal rental assistance. Early projects were usually segregated on the basis of race, a practice that was not officially outlawed until the 1960s.[12] Today, most of the 1.6 million Americans living in over 800,000 households assisted by public housing (see Figure 3) live in neighborhoods with high rates of poverty.[13] Most public housing developments are over 40 years old and in dire need of investment and repair. Public housing properties are operated by a network of about 2,700 state and local public housing agencies.

D.C. Public Housing Residents Far More Likely to Live in High-Poverty Areas
Public housing remains a critical source of permanently affordable housing, particularly in the Northeast and Puerto Rico. Public housing can help prevent displacement as housing costs rise, enabling families and individuals with low incomes to continue living in the D.C. metro area as affordable housing options dwindle in the private market. Many public housing residents also develop a sense of community with other residents, building important social ties they rely on for support and safety.[24] These connections can also be foundational in tenant organizing efforts, so residents can hold housing agencies accountable and leverage their lived expertise to improve living conditions.[25]
However, public housing is not available in a wide range of neighborhoods, and is particularly scarce in low-poverty neighborhoods. A significant share of the D.C. area’s public housing stock — and therefore many of its assisted families — is located in areas of high poverty. For example, only 2 percent of people in the metro area live in high-poverty neighborhoods, yet a third (33 percent) of Black families with children assisted by public housing do.[26] Living in high-poverty neighborhoods can worsen access to jobs, commuting costs, and access to fresh and reasonably priced food and other basic goods and services.
Families and individuals in the D.C. metro area living in public housing are much more likely to live in higher-poverty neighborhoods as compared to households participating in other federal rental assistance programs. Some 28 percent of households assisted by public housing live in high-poverty neighborhoods, compared to 13 percent of PBRA-assisted households and 9 percent of voucher-assisted households. Public housing residents are also less likely to live in low-poverty neighborhoods relative to PBRA-assisted households and voucher-assisted households in the DC metro area. While it can be difficult for renters with a housing voucher to find a landlord to rent to them, a much higher share of voucher holders are able to rent units in moderate- and low-poverty neighborhoods of their choosing.
Because so much public housing is in high-poverty neighborhoods in the D.C. metro area, residents who rely on it do not have the same choice about where they get to live. This is especially significant given the long history of housing policies that have limited where Black and other people of color can live. Given that over 90 percent of households living in D.C.’s public housing are headed by a Black person, this is deeply unjust.
Public Housing Is a Key Source of Affordable Housing, but D.C.’s Is Marred by Poor Conditions, High Vacancy Rates
Despite its shortcomings, many renters apply to live in public housing in the hopes of finding an affordable place to live. But insufficient funding creates long wait times to secure a unit; a group of residents admitted to D.C. Housing Authority (DCHA) public housing in 2022 spent an average of nearly 16 years on the waiting list before receiving assistance.[27] Nationally, public housing residents waited an average of 20 months before receiving assistance in 2023.[28]
Demand for public housing far outstrips supply: DCHA’s public housing assists roughly 5,350 households,[29] yet over 24,000 households are still on DCHA’s waiting list for public housing as of 2023.[30] Over three-fourths of families assisted by public housing in the metro area live in the city of D.C., partly due to most public housing complexes being built before the development of the surrounding suburbs.[31]
Despite high demand, DCHA has the lowest public housing occupancy rate of any large housing agency, a recent HUD report found, with over 1 in 5 units currently vacant.[32] (See Figure 5.) Units may sit unused due to poor conditions stemming from insufficient funding for repairs and renovation. Coupled with poor management, many of these vacant units are left dilapidated due to neglect, in some cases posing significant health and safety hazards.
During its inspection of vacant public housing units, HUD found multiple units with mold and moss growing on the walls and floors from active leaks. In 2019, DCHA reported that the vast majority of its units need significant capital improvements, such as new heating and cooling systems, roofs, and plumbing, requiring an estimated $2.2 billion to address.[33]

In Los Angeles, PBRA Largely Helps Asian, NHPI, and Older People Living Mostly in Higher-Poverty Areas
The Section 8 Project-Based Rental Assistance Program (PBRA) was established in 1974. Project-based assistance means the rental subsidy is tied to a unit in a building. The tenant will receive assistance as long as they occupy the unit. It is administered by private owners who enter into rental assistance agreements with HUD. Most owners are for-profit entities, but nonprofits and some public housing agencies own a significant share of Section 8 PBRA properties. By the mid-1980s, the program faced criticism for rising costs and concentrating assisted families in neighborhoods with high poverty rates.[34] Although Congress stopped funding new PBRA contracts in 1983, the program still helps house roughly 2 million people in 1.2 million households. (See Figure 6.)[35]

PBRA, Which Helps Many Older Angelenos, Can Provide Critical Supportive Housing Services
Older adults make up the overwhelming majority of those assisted by PBRA in the Los Angeles metro area: over 3 in 4 PBRA-assisted households (77 percent) are headed by a person aged 62 and older, a much higher share than voucher-assisted households and public housing residents.[48] (See Figure 8.) While this aligns with national demographics of PBRA-assisted households, it’s a significantly higher share than the roughly half (53 percent) of PBRA-assisted households headed by older adults overall.[49]

This partly reflects properties providing housing to older adults through the Housing for the Elderly program (also known as Section 202) that are subsidized through the PBRA program.[50] Section 202 housing typically includes service coordinators who help connect residents with other community services that support independent living, including physical and behavioral health services for those who want and need them. PBRA is a critical funding source for affordable housing for older adults, helping provide financing to preserve existing properties.
Rental assistance helps communities create a variety of integrated housing options for older adults — including supportive housing — so that people can choose the housing that meets their needs without being isolated from the rest of the community. This includes scattered-site supportive housing, including for households with tenant-based vouchers, and project-based supportive housing that houses a mix of people who do and don’t need supportive services. This can help older adults who want to age in place live in their own homes, instead of congregate care settings such as nursing homes or psychiatric facilities.[51]
Older adults and non-elderly people with disabilities are much more likely to receive federal rental assistance than other people in need of assistance, but there are still many people in these groups who face serious hardship because they can’t afford housing.[52] A recent representative study of adults experiencing homelessness in California found that 44 percent of unhoused adults were 50 and older.[53] Many older adults are no longer able to work and rely on fixed incomes provided by Supplemental Security Income (SSI) that are often too low to cover housing costs.[54]
In 2023, over 4,700 people experiencing homelessness in the Los Angeles City and County Continuum of Care (CoC) were 65 and older, and nearly three-fourths (74 percent) of them were experiencing unsheltered homelessness.[55] Living in a car, on the street, or other places not meant for human habitation can exacerbate the risk of chronic disease and serious mental illness, lower access to health services, and increase food insecurity for older adults.[56]
More Can Be Done to Support Use of Housing Choice Vouchers in More Milwaukee Neighborhoods
In 1974 Congress authorized the Section 8 tenant-based rental assistance program that evolved into the Housing Choice Voucher (HCV). Today housing vouchers are the largest form of federal rental assistance, assisting roughly 5 million people in 2.3 million households. (See Figure 10.)[63] The vast majority of housing vouchers are tenant based, meaning the voucher is issued to an individual or family to use in the private rental market. A voucher recipient must find a unit that meets the program’s quality standards and has a landlord willing to participate.
A family with a voucher generally must contribute the higher of 30 percent of their income or a “minimum rent” of up to $50 for rent and utilities. The voucher covers the rest of those costs, up to a limit (called a payment standard) that the housing agency sets based on HUD’s Fair Market Rent estimates. If a family moves, they can take their voucher with them, provided the new unit is eligible and the landlord is willing to participate in the program.[64] The HCV program is administered by a network of nearly 2,200 state and local public housing agencies.[65]

Voucher-Assisted People of Color Doubly Affected by Landlord Discrimination
Beyond discrimination from landlords that do not wish to participate in the voucher program, voucher-assisted families and individuals of color can face additional landlord discrimination because of their race or ethnicity. The compounding effect of both voucher and racial discrimination may help explain why so few families and individuals of color can use their vouchers in low-poverty neighborhoods. In the Milwaukee metro, only 7 percent of Black households and 16 percent of Latine households with a voucher live in low-poverty neighborhoods, compared to 46 percent of white Milwaukee households with a voucher. (See Figure 12.)
Severe racial inequities partly reflect the racial discrimination Black and Latine people continue to face in the rental market.[84] During housing searches, landlords and realtors often steer people of color toward higher-poverty, racially segregated neighborhoods, reproducing patterns of racial and economic segregation.[85] Voucher recipients may not even realize their housing choices are being constrained because they do not know that the landlord is not showing them all available properties.
Voucher-assisted families with children may also face additional housing discrimination from landlords, receiving differential treatment due to anticipated issues children may cause, such as overcrowding and more wear and tear on units.[86] One study found that while families with children are as likely as those without children to obtain an appointment for an available rental unit, they are shown fewer units and are told about slightly larger units that were more expensive to rent compared to renters without children inquiring about the same-size units.[87] Discrimination can also have intersecting impacts across race, ethnicity, gender, and presence of children. For example, limited evidence suggests Black and Latina women are penalized during housing searches for being parents and for being single mothers, while white women are not.[88]

Policy Recommendations
Federal, state, and local policymakers should seek to ensure that all people with low incomes can afford stable, good-quality housing, that they can freely decide to stay in their current neighborhood or move to another location of their choice, and that wherever they live they have access to the community resources and amenities they need to thrive. We’re far short of those goals today, but there are many steps that policymakers could take to advance us closer to them.
Expand Federal Rental Assistance to Make It Available to Everyone Who Needs It
The most important way to ensure that people have access to good-quality, stable, affordable housing is to expand federal rental assistance and ultimately make it available to every low-income person who needs it. Rental assistance is highly effective at reducing homelessness, overcrowding, and housing instability, but federal rental assistance only reaches 1 in 4 eligible households due to funding limitations.[89] Policymakers should also take other steps to make housing more affordable, such as increasing subsidies for affordable housing development, reforming zoning rules to allow more subsidized and market-rate housing to be built, and instituting well-designed rent regulations where appropriate. But these measures generally won’t make housing affordable to households with incomes around or below the poverty line unless the households also have rental assistance, so expanding federal rental assistance must accompany supply strategies to be successful at helping those with the greatest challenges.[90]
Make Rental Assistance More Responsive to Participants’ Needs and Choices
For people to have greater choice about where they live, it must be easier for people to use tenant-based rental assistance in a wide range of neighborhoods.[91] Policymakers should fund housing navigators and other search assistance[92] and ensure that voucher holders have adequate time to look for housing before their vouchers expire. Other key changes would make it easier for families with vouchers to compete with higher-income applicants for available units. Such changes include allowing voucher subsidies to be used for security deposits, streamlining inspection requirements to avoid unnecessary delays, and ensuring that voucher subsidies cover typical rents even in higher-cost neighborhoods by extending use of ZIP code-level Small Area Fair Market Rents that better reflect rents in individual neighborhoods.[93]
Along with these adjustments to the existing voucher program, it would be valuable to test a more fundamental change: provision of rental assistance directly to tenants rather than through owners. Direct rental assistance could reduce administrative burdens for families, agencies, and owners, and potentially broaden choice for participants. HUD called for local pilots to test direct rental assistance in a September 2023 statement that has already prompted emerging efforts around the country, and a federally funded demonstration could evaluate the approach on a large enough scale to determine whether it should be adopted more broadly.[94]
Prevent Discrimination Against People With Rental Assistance
Federal, state, and local policymakers should also strengthen rules prohibiting owners from discriminating against voucher holders. This includes enacting prohibitions against discrimination in states and localities where they don’t exist today, and ultimately passing a federal law that would outlaw voucher discrimination everywhere. Policymakers should also strengthen enforcement of existing laws prohibiting discrimination, including state and local bans and prohibitions on discrimination in units built or rehabilitated using federal affordable housing subsidies. In addition, strengthening enforcement of the Fair Housing Act of 1968 — because most voucher holders are people of color and/or are members of other groups protected within this legislation — would broaden choice for people with vouchers in addition to fighting discrimination more broadly.
Build and Preserve Housing That People With Low Incomes Can Rent in a Wide Range of Neighborhoods
Policymakers should also take steps to ensure that there are units available for federal rental assistance recipients to rent in a wide range of neighborhoods. This should include modifying zoning laws that exclude lower-cost housing types from many communities, such as large minimum lot sizes and bans on multifamily housing.
In addition, it is critical that subsidy programs like the Low-Income Housing Tax Credit (LIHTC) build and preserve housing in a wide range of neighborhoods, including in areas where it is otherwise difficult for people with low incomes to rent and in gentrifying neighborhoods where the availability of affordable housing is declining. States can ensure that their LIHTC qualified allocation plans[95] support housing in a variety of neighborhoods, and federal policymakers can support this goal as well.[96]
For example, the proposed Affordable Housing Credit Improvement Act includes important provisions to prevent local governments and state elected officials from excluding affordable housing developments from their communities. In addition, policymakers could increase the long-run benefits of developing affordable housing in low-poverty or gentrifying areas by taking steps such as requiring long-term or permanent affordability protections, or public or social ownership or control.[97]
Project-based assistance (including PBRA, public housing, project-based vouchers, and other smaller programs) can also help people with low incomes afford good-quality, stable housing and give them access to a wider range of neighborhoods. Many PBRA and other older subsidized housing developments need additional investment for renovations, which could be provided through special supplemental subsidies or by prioritizing them for funding through LIHTC and other programs. The needs are even greater in public housing, where many years of inadequate federal funding has resulted in a backlog of unmet renovation needs that exceed $70 billion according to some estimates.
As a result, many public housing residents live in unsafe or unhealthy conditions, and many developments are at risk of being demolished or otherwise lost as affordable housing — including developments that provide difficult-to-replace affordable housing in low-poverty or gentrifying areas. Federal policymakers should provide both a large infusion of upfront public housing capital funding and reliable ongoing subsidies. These ongoing subsidies could be provided through mechanisms like the Rental Assistance Demonstration (RAD) that convert public housing to long-term PBRA or project-based voucher subsidies, which increase more reliably over time to keep pace with costs than public housing subsidies do and make it easier for housing agencies to obtain private financing to fund renovations. Policymakers should then ensure that the converted developments remain subject to strong tenant protections and long-term affordability guarantees.
Policymakers should also consider increasing funding for HUD’s Choice Neighborhoods Initiative (CNI), which supports both renovation and replacement of public and other subsidized housing developments and investment in the surrounding neighborhoods. HUD is in the process of evaluating CNI’s ongoing impact, and policymakers should take those results into consideration.[98]
Project-based assistance can also be used to ensure that people with the lowest incomes have access to new subsidized housing. This is particularly valuable in neighborhoods where tenant-based vouchers are hard to use. Most new project-based assistance is provided through project-based vouchers (PBVs), which are especially effective for expanding choice since PBV residents have the right to move with the next tenant-based voucher that becomes available after they have lived in a development for a year. State and local housing agencies are permitted to project-base up to 30 percent of their vouchers (and often more, since some types of PBVs are exempt from the 30 percent cap). Most could project-base additional vouchers without hitting that limit, and expanding the size of the voucher program would further increase the availability of both project-based and tenant-based vouchers.
It will be important, however, to ensure that most vouchers remain tenant based, since tenant-based assistance also has a central role to play in expanding choice and helping people afford housing.[99] In addition, policymakers should extend the right to move with a tenant-based voucher after a year — which project-based voucher residents already have — to other types of project-based assistance (including PBRA and public housing) and institute reforms to make this right easier to use, so that all people who receive federal rental assistance have the option to move if they wish to do so.
Invest in Under-Resourced Neighborhoods
At the same time policymakers seek to enable people to choose from a wider variety of neighborhoods, they should also act to ensure that no one is denied access to critical resources, amenities, and services because of where they live. Many areas with high poverty rates also struggle with a range of other challenges — from under-resourced schools to environmental hazards to inadequate parks and other public facilities — which result from a long history of underinvestment and discrimination.
Housing policy can help address the challenges of under-resourced neighborhoods. For example, some high-poverty neighborhoods have many vacant or deteriorating housing units, so grants and loans for repairs and ongoing voucher subsidies that pay enough rent to cover maintenance and repair costs can help improve conditions.
But many of the measures that are needed go beyond housing policy, including investments or reforms in areas such as education, workforce development, transportation, policing, health, parks, and environmental protection. And broader fiscal and political reforms also have an important role to play in ensuring that all local governments have adequate revenues to meet the needs of their communities and that residents of every neighborhood can influence decisions that affect them. Taken together, these interventions can help bring about a future where every neighborhood has the resources its residents need to thrive.
Appendix
Interactive Charts and Tables
Explore the data by metro area and household type for the 100 most populous metro areas using the charts and tables below. For more detailed metro-level data, download the supplemental spreadsheet.[100]
Methodology and Data Sources
Data Sources and Definitions
Poverty rate: Data on poverty by census tract are from the 2017-2021 American Community Survey, Table S1701: Poverty Status in the Past 12 Months. High-poverty neighborhoods are census tracts with poverty rates at or above 30 percent, and low-poverty neighborhoods, under 10 percent.
Total population by race/ethnicity: Data on total population by race/ethnicity are from the 2020 Decennial Census, Table P2: Hispanic or Latino, and not Hispanic or Latino by Race.
Households receiving federal rental assistance: Data on households receiving federal rental assistance are from a 2020 dataset from the HUD Office of Policy Development and Research, obtained through a research agreement. This dataset contains demographic and location information collected through HUD Form 50058 through December 2020. Race and ethnicity of assisted households were determined using data on the head of household.
Metropolitan areas: We define metropolitan areas using U.S. Census metropolitan statistical areas (MSAs). MSAs consist of the county or counties (or equivalent entities) associated with at least one urbanized area of at least 50,000 people, plus adjacent counties having a high degree of social and economic integration with the core as measured through commuting ties.[101] We use September 2018 Office of Management and Budget (OMB) MSA delineations.[102] We identify the 100 most populous MSAs using data from the 2020 Decennial Census, Table P1: Total Population.[103]
Neighborhoods: Census tracts are small, relatively permanent geographic subdivisions of a county or equivalent entity; they generally have a population between 1,200 and 8,000 people, with an optimum size of 4,000. We use census tracts as neighborhood proxies. Where appropriate, we aggregate all census tracts in a given MSA to calculate metropolitan-level measures.[104] We use census tract boundaries from the 2010 decennial census and incorporate numbering and other geographic changes from 2011 and 2012. There are 47,401 census tracts in the most populous 100 MSAs, accounting for 67 percent of the total population nationally (including Puerto Rico).
Geographic adjustments: The Census Bureau changes tract geography boundaries every ten years to account for population changes, with the most recent changes occurring in 2020. While the 2020 HUD data on assisted households use 2010 census tract geographies, we decided to use more recent 2017-2021 ACS and 2020 Decennial Census data based on 2020 census tract geographies. We match the ACS and Decennial Census data to the HUD data using the IPUMS National Historical Geographic Information System (NHGIS) 2020 to 2010 Block Group crosswalk.[105]
For consistency, we treat the Poughkeepsie-Newburgh-Middletown, NY MSA as part of the New York-Newark-Jersey City, NY-NJ-PA MSA due to it losing MSA status from 2013 to 2018.
We rely on Missouri Census Data Center’s MABLE/Geocorr 18 crosswalks in our analysis, which do not include Puerto Rico. To include the San Juan-Bayamón-Caguas, PR MSA in our analysis, we created crosswalks using the Census Bureau’s September 2018 OMB MSA delineation file and the 2010 ZIP Code Tabulation Area (ZCTA) to census tract relationship file.[106]
Voucher-affordable rental units: We consider a rental unit to be affordable to someone using a housing voucher if its gross rent is below the prevailing Small Area Fair Market Rent (SAFMR). HUD sets SAFMRs to the 40th percentile of each ZIP code’s rent distribution. A family with a voucher pays about 30 percent of their income for rent and utilities, and the voucher covers the remainder up to a payment standard set by the state or local housing agency, which is generally within 10 percent of the Fair Market Rent (FMR). HUD generally sets the FMR to the 40th percentile rent for the entire metropolitan area. Because SAFMRs are based on rents in particular ZIP codes, they reflect neighborhood rents more accurately than metro-level FMRs.[107] All housing agencies in metro areas are permitted to base their payment standards on SAFMRs instead of FMRs; housing agencies in 65 metro areas are required to do so. In 2016 HUD began requiring housing agencies in 24 metro areas to use SAFMRs, and in 2023 expanded that list to another 41 areas.
We used data from the following sources to calculate the number of voucher-affordable units in metropolitan census tracts:
- 2017-2021 American Community Survey, Table B25063, which contains counts of renter-occupied units by their gross rent;[108]
- fiscal year 2021 Small Area Fair Market Rents;[109]
- fiscal year 2021 Fair Market Rents;[110]
- 2020 HUD Tract-to-USPS ZIP Code crosswalk;[111]
- Missouri Census Data Center’s MABLE/Geocorr 18 Tract-to-ZCTA crosswalk;[112] and
- Missouri Census Data Center’s MABLE/Geocorr 18 Tract-to-CBSA crosswalk.
We compute census tract estimates of all rental units with gross rents below the prevailing two-bedroom SAFMR. HUD generates SAFMRs based on the number of bedrooms in a unit. However, the American Community Survey only publishes census tract counts of all rental units with detailed gross rent values, without specifying the number of bedrooms. Because two-bedroom rental units are the modal rental unit in the nation and because most families with children using vouchers consist of one adult with two children, we use the two-bedroom SAFMR. Consequently, we estimate voucher-affordable rental units as all rental units (independent of bedroom size) in the tract with gross rents below the two-bedroom SAFMR.
To do this, we join ZIP code-level SAFMRs to the tract-level gross rent data using census tract-to-ZIP code correspondence files. Some ZIP codes span multiple metro areas and so are assigned multiple SAFMRs. To ensure the correct SAFMRs are always assigned to tracts, metro area codes are first joined to the tract-to-ZIP code correspondence files and SAFMRs are then matched to tracts by using combined ZIP code-metro area codes. Gross rent data for census tracts are compared to a weighted average of the SAFMRs for all ZIP codes intersecting with a tract. Rental units are aggregated for all gross rent increment categories below the weighted average SAFMR. Linear interpolation is used to compute the number of units below the SAFMR and above the adjacent highest rent increment threshold, based on the methodology used in McClure, Schwartz, and Taghavi (2015).[113]
While the highest ACS gross rent category is “$3,500 and over,” some 118 ZIP codes have SAFMRs at or above $3,500. For tracts in these ZIP codes, we use 2017-2021 ACS Public Use Microdata Sample (PUMS) to calculate each ZIP code’s 90th, 95th, and 98th percentile rent for units of all sizes based on a weighted average of all Public Use Microdata Areas (PUMAs) intersecting with that ZIP code. We then set the upper bound for the interpolation computations at the rent percentile that first exceeds the SAFMR, starting with 90th percentile, then 95th percentile, and finally 98th percentile rent.
National figures for voucher-affordable units are based on SAFMRs in tracts where they are available. The remaining tracts without SAFMRs are based on fiscal year 2021 Fair Market Rents, using the same process we use for SAFMRs.
Limitations and Areas for Future Research
We believe our process for calculating voucher-affordable units is the best approach available, in light of the ACS data limitations outlined above. However, this interpolation method does not account for instances in a small number of high-cost metros where SAFMRs exceed the highest gross rent category in the ACS data. In these instances, we adjust our interpolation computations by approximating an upper bound using rent percentiles, as described above. This method will pose research challenges for a growing number of metros as SAFMRs continue to rise, unless the Census Bureau expands their ACS gross rent categories to include categories capturing more expensive rental units.
ACS gross rent data is also limited by not being disaggregated by bedroom size, as described above. As a result, there is no way to limit the number of voucher-affordable units to those with two or more bedrooms. This measure therefore includes some studio and one-bedroom units that would be too small for the typical voucher-assisted family of one parent and two children. It also mostly misses three-bedroom (and larger) units, likely partly offsetting the inclusion of smaller units. We would ideally be able to identify the number of units for each bedroom size based on the corresponding SAFMR.
As outlined above, we decided to crosswalk more recent ACS and decennial census data on neighborhood characteristics based on 2020 census tract geographies instead of relying on older data based on 2010 census tract geographies. However, the tradeoff is a lower level of accuracy as the crosswalked data are estimated based on the tract’s share of the population that overlaps between 2020 and 2010 census tract geographies.
Since we rely on 2020 data for the location of HUD-assisted households, our analysis does not capture changes in their location in the following years. This largely applies to voucher-assisted households who are not tied to units in specific locations. In addition, some public housing developments have been demolished, replaced in another location, or converted to other types of subsidies since 2020, and some PBRA owners have opted to withdraw their units from the program upon the expiration of their contracts — all changes that would affect findings on the location of households in those programs. Finally, this analysis does not include the perspectives of HUD-assisted individuals and families. Knowing what assisted families are looking for in a neighborhood, and whether those needs are being met by federal rental assistance programs, is a key area for further research.
End Notes
[1] CBPP, “Policy Basics: Federal Rental Assistance,” updated September 30, 2024, https://www.cbpp.org/research/policy-basics-federal-rental-assistance.
[2] While the topic is beyond the scope of this analysis, communities across the country, including small towns, rural areas, and tribal lands, struggle with a lack of affordable housing. Because data for less populous areas tend to be unavailable or less accurate, this analysis only covers the 100 largest metropolitan areas.
[3] Robert K. Nelson and Edward L. Ayers, “Renewing Inequality,” Digital Scholarship Lab, https://dsl.richmond.edu/panorama/renewal/#view=0/0/1&viz=cartogram.
[4] The Federal Reserve Bank of Richmond and the Brookings Institution, “The Enduring Challenge of Concentrated Poverty in America: Case Studies from Communities Across the U.S.,” 2008, https://www.brookings.edu/wp-content/uploads/2016/06/1024_concentrated_poverty.pdf.
[5] In addition to its appearance in this report, the interactive map is available separately at https://www.cbpp.org/research/housing/map-where-households-using-federal-rental-assistance-live.
[6] Department of Housing and Urban Development 2023 Picture of Subsidized Households.
[7] CBPP analysis of HUD’s 2016-2020 Comprehensive Housing Affordability Strategy (CHAS) data.
[8] The main rental assistance programs require that a majority share of new households admitted have “extremely low” incomes, meaning they may not exceed 30 percent of the local median or the federal poverty line. Three-fourths of assisted households have extremely low incomes. The American Community Survey does not include a question on receipt of rental assistance, so we use the presence of severe rent cost burdens as a proxy for unassisted households. Most assisted households pay 30 percent of their income (after certain deductions are taken out) for rent and utilities. That said, the major programs usually require a minimum rent of $25-$50 per month, even if this amount exceeds 30 percent of the family’s income. It is therefore possible that a small number of households could be double counted in this measure.
[9] We use extremely low-income renter households who pay 50 percent or more of their income for housing as a proxy for unassisted renters who are most like those already receiving rental assistance. Due to data limitations, we cannot definitively identify whether these households are unassisted. However, 77 percent of all households in HUD rental assistance are extremely low income, meaning their incomes are below the poverty line or 30 percent of the median income. This includes 77 percent of voucher holders, 72 percent of Public Housing residents, and 79 percent of PBRA households. Rental assistance is designed to ensure a household pays for rent up to 30 percent of their household income, though there are some exceptions. For example, some households may pay a minimum rent of $25 or $50, regardless of their income. Tenant-based voucher holders can also select a unit in the private market that costs more than what is covered by the voucher. It is not uncommon for voucher holders to pay more than 30 percent of their income on housing but a very small share pay over 50 percent — see HUD, “Rent Burden in the Housing Choice Voucher Program,” October 2017, https://www.huduser.gov/portal/sites/default/files/pdf/rent-burden-hcv.pdf.
[10] Low- and high-poverty neighborhoods have very similar distributions of units by number of bedrooms in the 100 most populous metro areas. For example, 32 percent of all occupied rental units in low-poverty neighborhoods are studios or one-bedrooms, while 33 percent of all occupied rental units in high-poverty neighborhoods are studios or one-bedrooms. The distribution of larger unit sizes is similar for low- and high-poverty neighborhoods, as well. That said, there are far more rental units overall in low-poverty neighborhoods, across unit sizes. About 39 percent of all occupied rental units are in low-poverty neighborhoods compared to 12 percent in high-poverty neighborhoods.
[11] Mary K. Cunningham et al., “A Pilot Study of Landlord Acceptance of Housing Choice Vouchers,” HUD Office of Policy Development and Research, September 20, 2018, https://www.huduser.gov/portal/pilot-study-landlord-acceptance-hcv.html.
[12] Katie Jones, Maggie McCarty, and Libby Perl, ”Overview of Federal Housing Assistance Programs and Policy,” Congressional Research Service, updated March 27, 2019, https://crsreports.congress.gov/product/pdf/RL/RL34591/24.
[13] CBPP, “Policy Basics: Public Housing,” updated September 30, 2024, https://www.cbpp.org/research/policy-basics-introduction-to-public-housing.
[14] Kevin Ehrman-Solberg and Sarah Shoenfeld, “The Legacy of Racial Covenants, 1940-2010,” Prologue DC, https://www.arcgis.com/apps/MapSeries/index.html?appid=54fecadcf61a45619534d7a88e1e3225.
[15] Aradhya Sood, Williams Speagle, and Kevin Ehrman-Solberg, “Long Shadow of Racial Discrimination: Evidence from Housing Covenants of Minneapolis,” SSRN, October 22, 2019, https://papers.ssrn.com/sol3/papers.cfm?abstract_id=3468520.
[16] Prologue DC, “Mapping Segregation in Washington D.C.,” https://umnlibraries.github.io/mappingprejudice/prologue_dc_carto/seg_housing/.
[17] Jacob W. Faber, “We Built This: Consequences of New Deal Era Intervention in America’s Racial Geography,” American Sociological Review, Vol. 85, Issue 5, October 2020, https://journals.sagepub.com/doi/epub/10.1177/0003122420948464.
[18] Kevin Ehrman-Solberg and Sarah Shoenfeld, “How the Federal Housing Administration Shaped DC,” Prologue DC, https://www.arcgis.com/apps/MapSeries/index.html?appid=34603bd48c9f496fa2750a770f655013.
[19] Kathryn Zickuhr, “Discriminatory housing practices in the District: A brief history,” D.C. Policy Center, October 24, 2018, https://www.dcpolicycenter.org/publications/discriminatory-housing-practices-in-the-district-a-brief-history/.
[20] Peter Tatian and Serena Lai, “Washington, DC: Our Changing City, Chapter 1,” Urban Institute, https://apps.urban.org/features/OurChangingCity/demographics/#history; Martin Austermuhle, “D.C.’s Black Commercial Districts Came Back From The 1968 Riots, But Many Black Residents Left,” WAMU, April 4, 2018, https://wamu.org/story/18/04/04/d-c-s-black-commercial-districts-came-back-1968-riots-many-black-residents-left/.
[21] 2023 American Housing Survey
[22] HUD 2023 Picture of Subsidized Households.
[23] Ibid.
[24] Susan Clampet-Lundquist, “‘Everyone Had Your Back’: Social Ties, Perceived Safety, and Public Housing Relocation,” City and Community, Vol. 9, Issue 1, March 2020, https://journals.sagepub.com/doi/abs/10.1111/j.1540-6040.2009.01304.x.
[25] Amie Thurber, “Disrupting the order of things: Public housing tenant organizing for material, political and epistemological justice,” Cities, Vol. 57, September 2016, https://www.sciencedirect.com/science/article/abs/pii/S0264275115001596.
[26] Some 93 percent of families of color with children assisted by public housing in the D.C. metro area are headed by a Black person.
[27] Meagan Flynn, “They waited decades for housing aid. Will changes finally bring relief?” Washington Post, April 26, 2023, https://www.washingtonpost.com/dc-md-va/2023/04/26/dcha-housing-waiting-list/.
[28] HUD 2023 Picture of Subsidized Households.
[29] Ibid.
[30] Brenda Donald, “FY2023 Moving to Work Plan,” District of Columbia Housing Authority, July 6, 2022, https://www.dchousing.org/wordpress/wp-content/uploads/2023/04/DCHA-FY2023-Plan_Approved-FINAL_Proposed-Significant-Amendment_Public-Comment-Changes_4.11.23.pdf.
[31] HUD 2023 Picture of Subsidized Households
[32] U.S. Department of Housing and Urban Development, Coordinated by the Northeast Public Housing Network, “District of Columbia Housing Authority Assessment,” https://oag.dc.gov/sites/default/files/2022-10/DCReview_Final%209302022%20%281%29.pdf.
[33] District of Columbia Housing Authority, “FY2020 Budget Oversight Hearing,” 2020, https://dccouncil.gov/wp-content/uploads/2019/04/dcha.pdf.
[34] Jones, McCarty, and Perl.
[35] CBPP, “Policy Basics: Section 8 Project-Based Rental Assistance,” updated September 30, 2024, https://www.cbpp.org/research/policy-basics-section-8-project-based-rental-assistance.
[36] Laura Redford, “The Intertwined History of Class and Race Segregation in Los Angeles,” Journal of Planning History, Vol. 16, Issue 4, November 2016, https://journals.sagepub.com/doi/abs/10.1177/1538513216676191.
[37] Joint Center for Housing Studies of Harvard University, “America’s Rental Housing,” 2024, https://www.jchs.harvard.edu/americas-rental-housing-2024.
[38] HUD defines extremely low income as below the federal poverty line or 30 percent of the local median income, whichever is higher.
[39] National Low Income Housing Coalition, “The Gap: A Shortage of Affordable Housing,” March 2024, https://nlihc.org/gap. Due to data limitations, this analysis includes both unassisted extremely low-income renter households and households that receive rental assistance. Available units include affordable vacant units and exclude affordable units occupied by renters who do not have extremely low incomes.
[40] National Low Income Housing Coalition, “Out of Reach: The High Cost of Housing,” 2024, https://nlihc.org/oor. Housing costs for a one-bedroom rental unit are based on HUD’s Fair Market Rents, which HUD calculates each year based on the typical rent and utility costs for moderately priced housing in the local market.
[41] HUD 2023 Picture of Subsidized Households.
[42] See Appendix Table W-26 in Joint Center for Housing Studies of Harvard University.
[43] Erik Gartland, “Chart Book: Funding Limitations Create Widespread Unmet Need for Rental Assistance,” CBPP, February 22, 2022, https://www.cbpp.org/research/housing/funding-limitations-create-widespread-unmet-need-for-rental-assistance.
[44] Daniel Soucy, Makenna Janes, and Andrew Hall, “State of Homelessness: 2024 Edition,” National Alliance to End Homelessness, https://endhomelessness.org/homelessness-in-america/homelessness-statistics/state-of-homelessness/. Black people experience the highest rate of homelessness of any racial or ethnic group in California.
[45] National CAPACD, “Crisis to Impact: Reflecting on a Decade of Housing Counseling Services in Asian American and Pacific Islander Communities,” March 2021, https://www.nationalcapacd.org/data-research/crisis-to-impact-reflecting-on-a-decade-of-housing-counseling-services-in-asian-american-and-pacific-islander-communities/.
[46] Mary Frances Kenion, “Long Overdue: Visibility for Native Hawaiian and Pacific Islanders Experiencing Homelessness,” National Alliance to End Homelessness, August 14, 2023, https://endhomelessness.org/blog/long-overdue-visibility-for-native-hawaiian-and-pacific-islanders-experiencing-homelessness/.
[47] Howard Shih et al., “The Post-Pandemic Agenda for Community Well-being among Asian Americans, Native Hawaiians, and Pacific Islanders in California,” UCLA Center for Health Policy Research, February 6, 2023, https://healthpolicy.ucla.edu/our-work/publications/post-pandemic-agenda-community-well-being-among-asian-americans-native-hawaiians-and-pacific.
[48] HUD 2023 Picture of Subsidized Households.
[49] Ibid.
[50] From 1974 to 1990, the PBRA program subsidized rents for older adults living in Section 202 properties. In 1990, Section 202 rental subsidies changed from PBRA to Project Rental Assistance Contracts (PRACs). For a full history of the Section 202 program, see Congressional Research Service, “Section 202 and Other HUD Rental Housing Programs for Low-Income Elderly Residents,” updated March 7, 2016, https://crsreports.congress.gov/product/pdf/RL/RL33508/46.
[51] CBPP, “More Housing Vouchers Needed to Help Older Adults Afford Stable Homes in the Community,” August 5, 2021, https://www.cbpp.org/research/housing/more-housing-vouchers-needed-to-help-older-adults-afford-stable-homes-in-the.
[52] Gartland.
[53] Benioff Homelessness and Housing Initiative, “California Statewide Study of People Experiencing Homelessness,” June 2023, https://homelessness.ucsf.edu/our-impact/studies/california-statewide-study-people-experiencing-homelessness.
[54] Kathryn A. Henderson et al., “Addressing Homelessness Among Older Adults,” Office of the Assistant Secretary for Planning and Evaluation, Department of Health and Human Services, October 30, 2023, https://aspe.hhs.gov/reports/older-adult-homelessness.
[55] 2023 HUD Point-in-Time count. A Continuum of Care (CoC) is a regional or local planning body that coordinates housing and services funding for families and individuals experiencing homelessness. For more information on CoCs, see National Alliance to End Homelessness, “What is a Continuum of Care?” January 14, 2010, https://endhomelessness.org/resource/what-is-a-continuum-of-care/.
[56] Jessica Richards and Randall Kuhn, “Unsheltered Homelessness and Health: A Literature Review,” AJPM Focus, Vol. 2, Issue 1, March 2023, https://www.sciencedirect.com/science/article/pii/S2773065422000414.
[57] Jennifer Ailshire and Catherine Garcia, “Unequal Places: The Impacts of Socioeconomic and Race/Ethnic Differences in Neighborhoods,” Generations: Journal of the American Society on Aging, Vol. 42, No. 2, 2018, https://www.jstor.org/stable/26556356.
[58] Technical Assistance Collaborative, “Priced Out: The Housing Crisis for People with Disabilities,” https://www.tacinc.org/resources/priced-out/.
[59] Anna Bailey, Raquel de la Huerga, and Erik Gartland, “More Housing Vouchers Needed to Help People With Disabilities Afford Stable Homes in the Community,” CBPP, July 6, 2021, https://www.cbpp.org/research/housing/more-housing-vouchers-needed-to-help-people-with-disabilities-afford-stable-homes.
[60] National Fair Housing Alliance, “2023 Fair Housing Trends Report,” August 7, 2023, https://nationalfairhousing.org/resource/2023-fair-housing-trends-report/.
[61] National Disability Institute, “Financial Inequality: Disability, Race and Poverty in America,” February 2019, https://www.nationaldisabilityinstitute.org/reports/financial-inequality-disability-race-and-poverty-in-america/.
[62] Tatjana Meschede, Kartik Trivedi, and Joe Caldwell, “Severe housing and neighborhood inequities of households with disabled members and households in need of long-term services and supports,” Housing and Society, Vol. 50, Issue 2, April 22, 2022, https://www.tandfonline.com/doi/abs/10.1080/08882746.2022.2065614.
[63] CBPP, “Policy Basics: The Housing Choice Voucher Program,” updated September 30, 2024, https://www.cbpp.org/research/policy-basics-the-housing-choice-voucher-program.
[64] Voucher-assisted families also face additional obstacles if they want to use their voucher outside of the public housing agency’s geographic jurisdiction. Multiple housing authorities often cover different parts of a metro area’s housing market, but cumbersome voucher portability policies make it difficult for families to move to areas served by different agencies.
[65] HUD’s HCV Two-Year Projection Tool, updated September 28, 2024, available at: https://www.hud.gov/program_offices/public_indian_housing/programs/hcv/Tools.
[66] Stephen Menendian, Samir Gambhir, and Arthur Gailes, “The Roots of Structural Racism Project,” Othering & Belonging Institute, updated June 30, 2021, https://belonging.berkeley.edu/roots-structural-racism.
[67] Lois M. Quinn, “Racially Restrictive Covenants: The Making of All-White Suburbs in Milwaukee County,” ETI Publications, 1979, https://core.ac.uk/download/pdf/217190095.pdf.
[68] Richard Rothstein, “The Color of Law,” Liveright Publishing Corporation, May 2017, https://www.epi.org/publication/the-color-of-law-a-forgotten-history-of-how-our-government-segregated-america/.
[69] Emily E. Lynch et al., “The legacy of structural racism: Associations between historic redlining, current mortgage lending, and health,” SSM Population Health, June 2021, https://www.ncbi.nlm.nih.gov/pmc/articles/PMC8099638/.
[70] Ibid.
[71] Joint Center for Housing Studies of Harvard University, Appendix Table W-26.
[72] Gartland.
[73] HUD 2023 Picture of Subsidized Households.
[74] Mary K. Cunningham et al., “A Pilot Study of Landlord Acceptance of Housing Choice Voucher,” HUD Office of Policy Development and Research, September 20, 2018, https://www.huduser.gov/portal/pilot-study-landlord-acceptance-hcv.html.
[75] Phillip M. E. Garboden et al., “Taking Stock: What Drives Landlord Participation in the Housing Choice Voucher Program,” Housing Policy Debate, Vol. 28, Issue 6, October 1, 2018, https://www.tandfonline.com/doi/abs/10.1080/10511482.2018.1502202.
[76] Jonmaesha Beltran, “Milwaukee County banned Section 8 housing voucher discrimination, but landlords still do it,” Wisconsin Watch, January 17, 2024, https://wisconsinwatch.org/2024/01/milwaukee-wisconsin-housing-voucher-discrimination-landlords/.
[77] Peter Rosenblatt and Jennifer E. Cossyleon, “Pushing the Boundaries: Searching for Housing in the Most Segregated Metropolis in America,” City & Community, Vol. 17, Issue 1, March 1, 2018, https://journals.sagepub.com/doi/abs/10.1111/cico.12288. Cunningham et al.
[78] Ingrid Gould Ellen, Katherine O’Regan, and Sarah Strochak, “Using HUD Administrative Data to Estimate Success Rates and Search Durations for New Voucher Recipients,” HUD Voucher Success Rates Supplementary Spreadsheet, HUD Office of Policy Development and Research, February 2023, https://www.huduser.gov/portal/publications/Using-HUD-Administrative-Data-to-Estimate-Success-Rates.html. Lower voucher lease-up rates may be partly due to families with children and Black renters, who are more likely to face landlord discrimination, making up a larger share of households receiving vouchers from the Milwaukee City housing agency. While their lease-up rates differ, both housing agencies have similar voucher utilization rates at roughly 85 percent as of July 2024. HUD’s HCV Data Dashboard, available at: https://www.hud.gov/program_offices/public_indian_housing/programs/hcv/dashboard.
[79] Genevieve Redsten, “Federal inspectors find Milwaukee’s Housing Authority in disarray, ‘at risk of serious fraud,’” Milwaukee Journal Sentinel, September 14, 2023, https://www.jsonline.com/story/news/investigations/2023/09/14/milwaukee-housing-authority-hacm-at-risk-of-serious-fraud-hud-report-willie-hines/70836784007/.
[80] For example Opportunity MKE, a housing mobility program launched in 2021 and administered by the Metropolitan Milwaukee Fair Housing Council, is designed to help new and existing voucher holders move to low-poverty neighborhoods. It currently assists households receiving vouchers from the Milwaukee City, Milwaukee County, and Waukesha housing authorities. For more information on Opportunity MKE, see: https://www.fairhousingwisconsin.com/opportunity-mke.
[81] Stefanie DeLuca, Lawrence F. Katz, and Sarah C. Oppenheimer, “‘When Someone Cares About You, It’s Priceless’: Reducing Administrative Burdens and Boosting Housing Search Confidence to Increase Opportunity Moves for Voucher Holders,” The Russell Sage Foundation Journal of the Social Sciences, September 2023, https://www.rsfjournal.org/content/9/5/179; Peter Bergman et al., “Creating Moves to Opportunity: Experimental Evidence on Barriers to Neighborhood Choice,” National Bureau of Economic Research, August 2019, https://www.nber.org/papers/w26164.
[82] Raj Chetty, Nathaniel Hendren, and Lawrence F. Katz, “The Effects of Exposure to Better Neighborhoods on Children: New Evidence from the Moving to Opportunity Experiment,” American Economic Review, Vol. 106, No. 4, April 2016, https://www.aeaweb.org/articles?id=10.1257/aer.20150572.
[83] Erin Carll et al., “Understanding Racial and Ethnic Disparities in Residential Mobility among Housing Choice Voucher Holders,” in Brian J. McCabe and Eva Rosen (eds.), “The Sociology of Housing: How Homes Shape our Social Lives,” University of Chicago Press, 2023.
[84] Peter Christensen, Ignacio Sarmiento-Barbieri, and Christopher Timmins, “Racial Discrimination and Housing Outcomes in the United States Rental Market,” National Bureau of Economic Research, November 2021, https://www.nber.org/papers/w29516.
[85] Peter Christensen and Christopher Timmins, “Sorting or Steering: The Effects of Housing Discrimination on Neighborhood Choice,” National Bureau of Economic Research, June 2021, https://www.nber.org/papers/w24826; Eva Rosen, “Rigging the Rules of the Game: How Landlords Geographically Sort Low-Income Renters,” City and Community, Vol. 13, Issue 4, December 1, 2014, https://journals.sagepub.com/doi/10.1111/cico.12087.
[86] Matthew Desmond et al., “Evicting Children,” Social Forces, Vol 92, Issue 1, September 2023, https://scholar.harvard.edu/files/mdesmond/files/social_forces-2013-desmond-303-27.pdf.
[87] Laudan Aron et al., “Discrimination Against Families With Children In Rental Housing Markets: Findings Of The Pilot Study,” HUD Office of Policy Development and Research, December 14, 2016, https://www.huduser.gov/portal/publications/HDSFamiliesFinalReport.html.
[88] Jacob William Faber and Marie-Dumesle Mercier, “Multidimensional Discrimination in the Online Rental Housing Market: Implications for Families With Young Children,” Housing Policy Debate, January 24, 2022, https://www.tandfonline.com/doi/abs/10.1080/10511482.2021.2010118.
[89] In addition to HUD federal rental assistance programs, this analysis includes McKinney-Vento Permanent Supportive Housing, Transitional Housing, Safe Havens, and Other Permanent Housing; Housing Opportunities for Persons with AIDS; and the Department of Agriculture’s Section 521 rental assistance program. CBPP, “77% of Low-Income Renters Needing Federal Rental Assistance Don’t Receive It,” https://www.cbpp.org/77-of-low-income-renters-needing-federal-rental-assistance-dont-receive-it.
[90] Will Fischer, Sonya Acosta, and Erik Gartland, “More Housing Vouchers: Most Important Step to Help More People Afford Stable Homes,” CBPP, updated May 13, 2021, https://www.cbpp.org/research/housing/more-housing-vouchers-most-important-step-to-help-more-people-afford-stable-homes.
[91] Will Fischer, “Making Rental Assistance Work Better for People Struggling to Afford Housing,” CBPP, April 11, 2024, https://www.cbpp.org/blog/making-rental-assistance-work-better-for-people-struggling-to-afford-housing.
[92] DeLuca, Katz, and Oppenheimer.
[93] When voucher subsidies are set using market rents at the wider metro rather than neighborhood level, higher-cost neighborhoods are out of reach for voucher users. Will Fischer, “HUD Expands Promising Policy to Support Housing Choice,” CBPP, November 1, 2023, https://www.cbpp.org/blog/hud-expands-promising-policy-to-support-housing-choice.
[94] Will Fischer, “Direct Rental Assistance Should Be Tested Through Local Pilots and a National Demonstration,” CBPP, January 22, 2024, https://www.cbpp.org/blog/direct-rental-assistance-should-be-tested-through-local-pilots-and-a-national-demonstration.
[95] Qualified Allocation Plans (QAPs) are documents used to determine the distribution of a state’s Low-Income Housing Tax Credits. These plans outline the eligibility and scoring criteria state officials will use to determine which projects receive credits. States can use their QAPs to encourage specific types of housing development using the criteria and preferences outlined in the plan.
[96] Will Fischer, “Low-Income Housing Tax Credit Could Do More to Expand Opportunity for Poor Families,” CBPP, August 28, 2018, https://www.cbpp.org/research/low-income-housing-tax-credit-could-do-more-to-expand-opportunity-for-poor-families.
[97] Robert Lindsay, Janelle Taylor, and Philip Tegeler, “Social Housing Goals in State Housing Allocation Plans — A 50-State Survey,” Poverty and Race Research Action Council, December 4, 2023, https://www.prrac.org/social-housing-goals-in-state-allocation-plans-a-50-state-survey-december-2023/.
[98] Will Fischer, Sonya Acosta, and Anna Bailey, “An Agenda for the Future of Public Housing,” CBPP, March 11, 2021, https://www.cbpp.org/research/housing/an-agenda-for-the-future-of-public-housing.
[99] Barbara Sard, “Project-Based Vouchers: Lessons from the Past to Guide Future Policy,” CBPP, October 19, 2023, https://www.cbpp.org/research/housing/project-based-vouchers-lessons-from-the-past-to-guide-future-policy.
[100] These spreadsheets appear as a “related resource” accompanying this paper, and can also be found at https://www.cbpp.org/sites/default/files/100_Metros_Supplemental_Spreadsheet.xlsx.
[101] For this and additional geographic definitions, see: https://www.census.gov/programs-surveys/metro-micro/about/glossary.html.
[102] See here for delineation files: https://www.census.gov/geographies/reference-files/time-series/demo/metro-micro/delineation-files.html.
[103] Available at: https://www.census.gov/programs-surveys/decennial-census/decade/2020/2020-census-main.html.
[104] Geographic definitions of census tracts are at: https://www.census.gov/programs-surveys/geography/about/glossary.html.
[105] Steven Manson et al., “IPUMS National Historical Geographic Information System: Version 18.0 [dataset],” IPUMS, 2023, http://doi.org/10.18128/D050.V18.0. We use a crosswalk based on block groups as the lowest level of geography available, as NHGIS recommends for optimal accuracy. For more information, see: https://www.nhgis.org/geographic-crosswalks#start-small.
[106] Available at: https://www.census.gov/programs-surveys/geography/technical-documentation/records-layout/2010-zcta-record-layout.html.
[107] For more, see CBPP, “A Guide to Small Area Fair Market Rents (SAFMRs),” May 4, 2018, https://www.cbpp.org/research/a-guide-to-small-area-fair-market-rents-safmrs.
[108] Available at: https://www.census.gov/programs-surveys/acs/.
[109] Available at: https://www.huduser.gov/portal/datasets/fmr/smallarea/index.html.
[110] Available at: https://www.huduser.gov/portal/datasets/fmr.html.
[111] Available at: https://www.huduser.gov/portal/datasets/usps_crosswalk.html.
[112] Available at: https://mcdc.missouri.edu/applications/geocorr2018.html.
[113] Kirk McClure, Alex F. Schwartz, and Lydia B. Taghavi, “Housing Choice Voucher Location Patterns a Decade Later,” Housing Policy Debate, Vol. 25, Issue 2, July 31, 2014, https://www.tandfonline.com/doi/full/10.1080/10511482.2014.921223.
Más de los autores

Areas of Expertise

Areas of Expertise