

Investing TANF Dollars in Basic Assistance Is Vital for Families to Meet Needs
Investments Especially Important as Food and Health Supports Are Rolled Back
Everyone, regardless of factors such as income, race, or ZIP code, deserves to be able to meet their basic needs. Cash assistance provided through Temporary Assistance for Needy Families (TANF) is essential in helping low-income families with children afford essential costs such as rent, utilities, diapers, food, medicine, personal hygiene products, and school supplies, and it gives families the dignity to choose for themselves how best to meet their individual needs.
However, our analysis of the latest data from fiscal year 2023 shows states spend less than one-fourth of their combined federal and state TANF dollars on basic cash assistance for families with children. (See Table 1.) While a slight improvement from recent years, this low proportion shows states continue to use their considerable flexibility under TANF to divert funds away from direct income support and toward other, sometimes unrelated, areas of their budgets. This troubling fact is even more concerning given the harmful Republican megabill’s drastic cuts to the Supplemental Nutrition Assistance Program (SNAP) and Medicaid, which will deepen the strain on families with low incomes and are predicted to intensify budget pressures in states over the next two to three years.[2]
With federal support for health and food assistance being rolled back, TANF cash assistance is more important than ever in supporting families in meeting their basic needs — yet most families in need still don’t receive it. If states maintain their current TANF spending practices, millions of children experiencing poverty — disproportionately Black children — will continue to be left without critical support. Redirecting TANF funds back toward core income assistance would not only help families make ends meet when their health care and food benefits are being taken away but also strengthen economic security and promote racial equity and child well-being.
Cash assistance is crucial for stabilizing families who are facing crises, such as those fleeing domestic violence. Material hardship is a known risk factor for child maltreatment and involvement with the child welfare system. By providing income support to families with low incomes, programs like TANF can play a critical role in reducing the likelihood of these adverse outcomes.[3] Caregivers are doing their best to meet their children’s basic needs — and direct cash support is a proven way to reduce economic hardship and promote family stability.
Despite the clear benefits of providing direct cash assistance, state policymakers have repeatedly and over time chosen to spend TANF dollars elsewhere, significantly weakening TANF in performing this core task. Additionally, states are not required to spend all their annual federal TANF block grant allocation each year, and many choose not to, instead accumulating large reserves.
This has several harmful impacts, including fewer families in need having access to the program (in 2023, for every 100 families living in poverty, only 21 received TANF cash assistance, down from 68 families when TANF was created)[4]., and benefits levels, set by state policymakers, often being extremely low, leaving those who do have access to the program far below the poverty line.
| TABLE 1 | ||
|---|---|---|
Total TANF Spending by Category, Fiscal Year 2023 | ||
| Category | Amount Spent (rounded in billions) | Share of Total Spending |
| Basic Assistance | $8.3 | 24.6% |
| Work, Education, and Training Activities | $2.7 | 7.9% |
| Work Supports and Supportive Services | $0.9 | 2.8% |
| Child Care | $5.2 | 15.3% |
| Refundable Tax Credits | $3.0 | 9.0% |
| Pre-kindergarten/Head Start | $3.2 | 9.4% |
| Child Welfare | $2.7 | 7.9% |
| Program Management | $3.4 | 10.0% |
| Other | $4.5 | 13.1% |
| Total | $33.9 | 100% |
Note: TANF = Temporary Assistance for Needy Families. Funds in “Other” go toward a range of areas such as non-recurrent, short-term benefits, which are used to help low-income families in crisis situations; transfers to the Social Services Block Grant; services for youth and children, including after-school programs; pregnancy prevention and two-parent family programs; and juvenile justice and emergency payments and services “authorized under prior law,” meaning they are not within the four TANF purposes but were in the state’s Aid to Families with Dependent Children (AFDC) Emergency Assistance plan when TANF replaced AFDC. Source: CBPP analysis of Department of Health and Human Services 2023 TANF financial data | ||
State Spending on Basic Assistance Has Plummeted Since TANF’s Creation

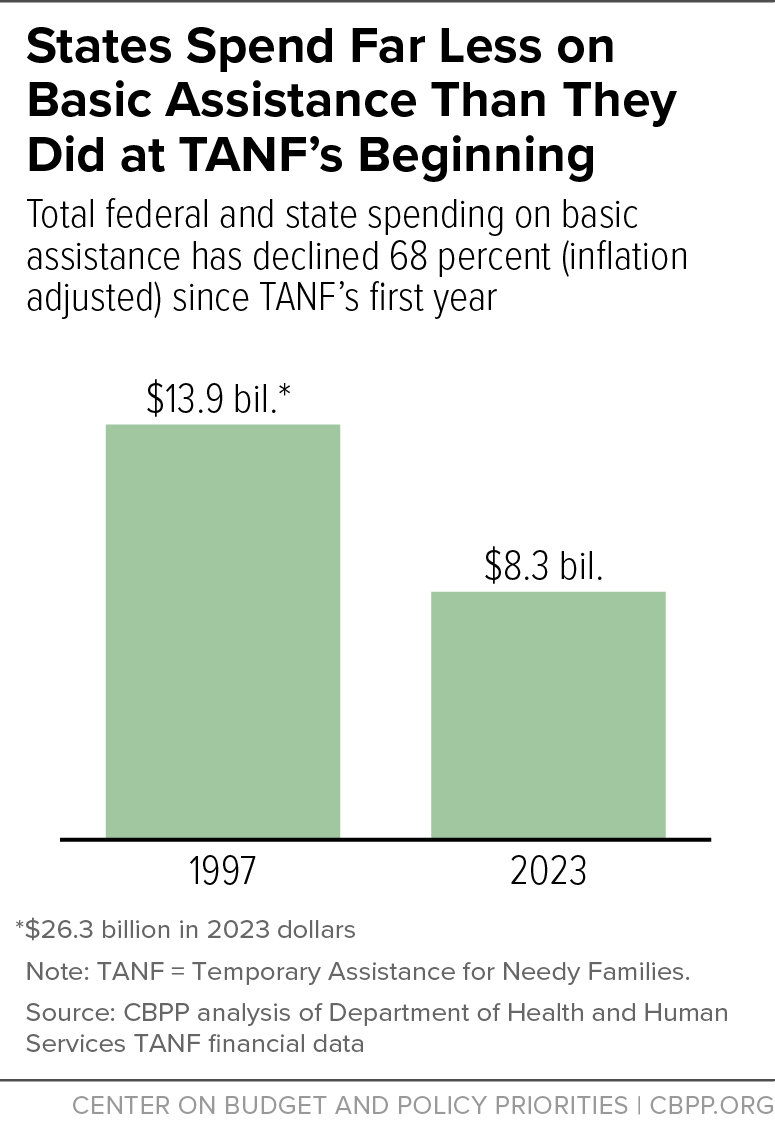
Cash assistance has weakened significantly under TANF because of disincentives structured into the founding law that, over time, have motivated state policymakers away from maintaining robust cash assistance programs for families.[5] Less direct cash assistance has potentially devastating long-term consequences for children growing up in families with little or no cash income to meet basic needs.
States spend less than one-fourth of their federal and state TANF funds on basic cash assistance. When TANF began, basic assistance was the single biggest use of TANF funds in all states. In 2023, states spent just $8.3 billion, or about 25 percent, of their total funds on basic assistance. This is down from $14 billion in 1997, which would be $26.3 billion in 2023 dollars. (See Figure 1.) This amounts to a 68 percent drop in basic assistance spending when adjusting for inflation.
The share of federal and state TANF funds spent on basic assistance varies across states, ranging from 2 percent to 55 percent in 2023. Nineteen states spent 10 percent or less on basic assistance, while 9 spent more than 30 percent.
Many States Have Unspent Funds, Some Exceeding Their Annual Block Grant
As TANF caseloads have continued to shrink, many states have accumulated carry-over or “reserve” funds by not spending their full block grant allocation over multiple years. There is no limit under federal law on how much states can carry over or when states must spend these carry-over funds, and states can continue to use them in the same way as any TANF funds in future years.
In 2023, states had $10 billion in unspent TANF funds, equaling 62 percent of the total annual block grant allocation. Six states had no unspent TANF funds, while 17 states had unspent funds equal to or exceeding 100 percent of their annual block grant. (See Table 2.) The majority of these funds ($7.7 billion or 77 percent of the funds) are unobligated, meaning that the state has not committed to use them for any specific purpose.
| TABLE 2 | ||
|---|---|---|
17 States Have TANF Reserves That Exceed Their Annual Block Grant | ||
| State | Total Unspent Funds, 2023 (rounded in millions) | Total Unspent Funds as a Share of Block Grant, 2023 |
| Hawai’i | $473 | 480% |
| Tennessee | $752 | 394% |
| Oklahoma | $353 | 256% |
| Nebraska | $125 | 221% |
| Pennsylvania | $1,482 | 207% |
| Montana | $75 | 198% |
| Mississippi | $157 | 181% |
| New Hampshire | $67 | 174% |
| Nevada | $58 | 133% |
| Arkansas | $73 | 130% |
| West Virginia | $142 | 129% |
| Utah | $97 | 128% |
| Wisconsin | $397 | 127% |
| Wyoming | $23 | 126% |
| Oregon | $177 | 112% |
| Rhode Island | $106 | 112% |
| South Dakota | $23 | 109% |
Note: TANF = Temporary Assistance for Needy Families. Source: CBPP analysis of Department of Health and Human Services 2023 TANF financial data | ||
By redirecting the funds back toward cash assistance, however, states could do more to strengthen economic security and promote racial equity and child well-being. It’s worth noting that of these 17 states with large unspent surpluses, 12 of them have TANF-to-Poverty ratios below the national average, and ten spend less TANF funds on basic assistance than the national average.
Consistent with the Black Women Best framework,[6] redesigning TANF to center the needs of Black women and families and to adequately help families struggling to afford necessities would better serve families of all races and ethnicities. Such a redesign would require significant changes to TANF spending. To ensure that no family falls below a certain income level, federal policymakers must:
- direct states to spend a majority of existing federal TANF and state MOE dollars on basic assistance; and
- require states to target their TANF funds toward families with the lowest incomes.
Appendix 1:
Background on Methodology and Funds Available to States
Federal TANF Funding
Each state receives a fixed annual amount of federal TANF funding, technically known as the State Family Assistance Grant but generally referred to as the TANF block grant. The total amount of federal block grant funds available to all states each year is $16.5 billion. The TANF block grant allocations for each state are set in accordance with the 1996 law that created TANF, based on the amount of federal funding that the state had received in AFDC and related programs before 1996. Each state’s annual block grant allocation has generally remained unchanged since TANF’s creation (see Appendix 3) and thus has declined in value by 49 percent due to inflation. (In 2023, each state’s allocation was reduced by 0.33 percent as a set-aside for research funding.) Because states can carry over unspent TANF funds to use in future years, the amount of federal TANF funds that a state spends in a given year may vary.
In 19 states, the annual block grant is further reduced by a certain amount as a set-aside for Tribal TANF programs. The set-aside for Tribal TANF programs varies by state. In 2023, set-asides for Tribal TANF programs ranged from just under $70,000 in Nevada to $87 million in California. (See Appendix 3.) In total, $216 million in federal TANF funding was set aside for Tribal TANF programs in 2023 — about 1 percent of total federal funding. In Appendix 3, “Block Grant Received” refers to how much federal funding states received after the research funding and Tribal TANF (in states with such programs) set-asides, as well as any fiscal penalties, were subtracted out.
A state can transfer up to 30 percent of its block grant funds per year to the Child Care and Development Fund and up to 10 percent to the Social Services Block Grant (SSBG), as long as the total amount transferred doesn’t exceed 30 percent. Transferred funds are subject to the rules of the program to which they are transferred, not to TANF rules. Funds transferred to SSBG must be spent on programs and services for children or families with incomes below 200 percent of the poverty line.
In addition to the basic block grant, some states can receive additional TANF federal funds from the TANF Contingency Fund. A state can access the TANF Contingency Fund if it meets a monthly economic hardship (or “needy state”) trigger and spends more MOE funds than are otherwise required. (See below for more on MOE.) Congress created this $2 billion fund when it created TANF to provide additional help to states in hard economic times. States made little use of it until the Great Recession, but they began to draw on it in 2008, and nearly half of the states have done so since then. Since the original $2 billion provided was depleted early in fiscal year 2010, Congress has added limited funds ($608 million) for each year; qualifying states have received less than half of the amount for which they qualified each year since 2010.
State Maintenance of Effort Funding
Each year, states are required to meet a MOE obligation under the TANF block grant or face a fiscal penalty. (The statute refers to this spending as “qualified state expenditures,” but the common usage is “state MOE.”) Each state’s MOE amount is based on its historical spending, defined as its 1994 financial contribution to AFDC and related work programs. To meet its MOE obligation, a state must report spending at least 80 percent of this historical spending level; this minimum share falls to 75 percent for any year in which a state meets its TANF work participation rate requirement.
The fact that the MOE requirement is only 75 percent or 80 percent of a state’s historical spending, rather than 100 percent, allowed states to withdraw part of the funds they had spent on AFDC and related programs. Moreover, a state’s MOE requirement is based on its 1994 expenditure level, with no adjustment for inflation over the years since then.
Since the Deficit Reduction Act of 2005 made it harder for states to meet their TANF work participation rate requirements — threatening states with the loss of some federal TANF funds due to penalties — a number of states have found it advantageous to claim as MOE certain existing expenditures they hadn’t previously claimed. States with MOE spending exceeding their minimum MOE requirement can obtain a “caseload reduction credit” that lowers their work participation rate requirement. Claiming excess MOE also helps a state qualify for additional federal money from the TANF Contingency Fund.
Thus, since 2006, total MOE spending across states has risen above the minimum required levels. This increase does not necessarily represent an increase either in underlying state spending or in benefits or services for families with low incomes. Some of the reported MOE may represent existing state spending or existing third-party spending that the state hadn’t previously counted as MOE. In analyzing a state’s TANF and MOE expenditures, it is important to understand the extent to which they may be part of an “excess MOE” strategy in effect. Also, when a state has a particularly high MOE, percentages of total spending in various categories can be skewed.
Expenditures that qualify as MOE include state and local government spending or third-party spending that benefits members of “needy families” and meets one of TANF’s four purposes. Examples of qualifying third-party expenditures include spending by food banks or domestic violence shelters on TANF-eligible families. Third-party MOE also can include in-kind contributions, such as volunteer hours or employer-provided supervision and training for people in subsidized jobs. While a number of states have reported third-party MOE in order to boost MOE to obtain caseload reduction credits or a portion of the TANF Contingency Fund, not all third-party spending is excess MOE spending; some states claim third-party expenditures toward their minimum MOE obligations. The financial data that states report to HHS do not identify what reported spending arises from third-party MOE.
MOE expenditures must occur during the year for which the state claims them; states cannot carry them over to a future year. MOE expenditures can come from any area of the state budget and are not limited to spending by the TANF agency. MOE spending, however, must be an actual expenditure, not simply forgone revenue; thus, a state can count the refundable portion of a state EITC as MOE but not the portion that simply reduces the amount of income tax owed to the state.
Methodology
Throughout the analysis, percentages are used to describe portions of total TANF funding spent in a particular year. Because federal funding can be carried over into future years and due to variation in state MOE from year to year, percentages across years use different denominators and may not always be comparable.
Appendix 2: CBPP Groupings of Federal TANF Reporting Categories | |
|---|---|
| CBPP Category | Federal Reporting Categories |
| Basic Assistance | Basic Assistance (excluding Relative Foster Care Maintenance Payments and Adoption/Guardianship Subsidies) Relative Foster Care Maintenance Payments and Adoption/Guardianship Subsidies |
| Work, Education, and Training Activities | Subsidized Employment Education and Training Additional Work Activities |
| Work Supports and Supportive Services | Work Supports Supportive Services |
| Child Care | Child Care – Assistance and Non-Assistance Transferred to Child Care and Development Fund |
| Program Management | Administrative Costs Assessment/Service Provision Systems |
| Refundable Tax Credits | Refundable Earned Income Tax Credit (EITC) Non-EITC Refundable State Tax Credits |
| Child Welfare | Family Support/Family Preservation/Reunification Adoption Services Additional Child Welfare Services Authorized Under Prior Law (AUPL): Child Welfare or Foster Care (Assistance and Non-Assistance) |
| Pre-K/Head Start | Pre-kindergarten/Head Start |
| Other Areas | Non-Recurrent Short-Term Benefits Transferred to Social Services Block Grant Services for Children and Youth Home Visiting Programs Financial Education and Asset Development Prevention of “Out-of-Wedlock” Pregnancies Fatherhood and 2-Parent Family Formation & Maintenance Programs AUPL: Juvenile Justice Payments (Assistance and Non-Assistance) AUPL: Emergency Assistance (Assistance and Non-Assistance) Other |
| Basic Assistance | Basic Assistance (excluding Relative Foster Care Maintenance Payments and Adoption/Guardianship Subsidies) Relative Foster Care Maintenance Payments and Adoption/Guardianship Subsidies |
Appendix 3: Federal TANF Funds Allocated to Each State in 2023 (Millions) | ||||
|---|---|---|---|---|
| State | Block Grant Allocation | Block Grant Received* | Contingency Fund | Tribal TANF |
| Alabama | $93.3 | $93.0 | $10.9 | |
| Alaska | $63.6 | $44.4 | $19.0 | |
| Arizona | $222.4 | $199.4 | $26.1 | $22.3 |
| Arkansas | $56.7 | $56.5 | $6.7 | |
| California | $3,733.8 | $3,634.1 | $87.4 | |
| Colorado | $136.1 | $135.6 | $16.0 | |
| Connecticut | $266.8 | $265.9 | ||
| Delaware | $32.3 | $32.2 | $3.8 | |
| District of Columbia | $92.6 | $92.3 | $10.9 | |
| Florida | $562.3 | $560.5 | ||
| Georgia | $330.7 | $329.7 | ||
| Hawai’i | $98.9 | $98.6 | ||
| Idaho | $31.9 | $30.3 | $1.5 | |
| Illinois | $585.1 | $583.1 | ||
| Indiana | $206.8 | $206.1 | ||
| Iowa | $131.5 | $130.6 | $0.5 | |
| Kansas | $101.9 | $101.5 | $0.1 | |
| Kentucky | $181.3 | $180.7 | ||
| Louisiana | $164.0 | $163.4 | ||
| Maine | $78.1 | $77.9 | ||
| Maryland | $229.1 | $228.3 | $26.9 | |
| Massachusetts | $459.4 | $457.9 | $53.9 | |
| Michigan | $775.4 | $772.8 | ||
| Minnesota | $268 | $259.6 | $7.5 | |
| Mississippi | $86.8 | $86.5 | ||
| Missouri | $217.1 | $216.3 | ||
| Montana | $45.5 | $37.9 | $7.5 | |
| Nebraska | $58.0 | $56.6 | $1.2 | |
| Nevada | $44.0 | $43.8 | $0.07 | |
| New Hampshire | $38.5 | $38.4 | ||
| New Jersey | $404.0 | $402.7 | ||
| New Mexico | $126.1 | $109.9 | $14.8 | $15.8 |
| New York | $2,442.9 | $2,434.9 | $286.5 | |
| North Carolina | $302.2 | $300.4 | $35.4 | $0.8 |
| North Dakota | $26.4 | $26.3 | ||
| Ohio | $728.0 | $725.6 | ||
| Oklahoma | $148.0 | $138.0 | $9.5 | |
| Oregon | $167.9 | $158.2 | $9.2 | |
| Pennsylvania | $719.5 | $717.1 | ||
| Rhode Island | $95.0 | $94.7 | ||
| South Carolina | $100.0 | $99.6 | $11.7 | |
| South Dakota | $21.9 | $21.2 | $0.6 | |
| Tennessee | $191.5 | $190.9 | ||
| Texas | $486.3 | $484.7 | $48.4 | |
| Utah | $76.8 | $75.4 | $1.2 | |
| Vermont | $47.4 | $47.2 | ||
| Virginia | $158.3 | $157.8 | ||
| Washington | $404.3 | $379.0 | $47.4 | $24.0 |
| West Virginia | $110.2 | $109.8 | ||
| Wisconsin | $318.2 | $312.8 | $4.3 | |
| Wyoming | $21.8 | $18.4 | $3.3 | |
*Block grant allocation minus the 0.33 percent research set-aside, as well as any Tribal TANF set-asides or penalties. Source: CBPP analysis of Department of Health and Human Services 2023 TANF financial data | ||||
Appendix 4: Basic Assistance Spending by State in 2023 | |||
|---|---|---|---|
| State | Total Spending (Millions) | Basic Assistance Spending (Millions) | Basic Assistance Spending as a Share of Total Spending |
| Alabama | $288.1 | $25.9 | 8.98% |
| Alaska | $57.3 | $20.2 | 35.31% |
| Arizona | $413.5 | $41.8 | 10.11% |
| Arkansas | $110.7 | $2.3 | 2.07% |
| California | $8,109.9 | $3,954.2 | 48.76% |
| Colorado | $471.9 | $64.0 | 13.57% |
| Connecticut | $512.6 | $38.3 | 7.48% |
| Delaware | $78.6 | $4.7 | 5.97% |
| District of Columbia | $386.1 | $197.1 | 51.04% |
| Florida | $921.2 | $145.7 | 15.82% |
| Georgia | $462.5 | $74.0 | 16.01% |
| Hawai’i | $186.4 | $23.7 | 12.71% |
| Idaho | $49.8 | $6.2 | 12.44% |
| Illinois | $1,450.4 | $44.9 | 3.10% |
| Indiana | $259.5 | $10.6 | 4.09% |
| Iowa | $169.3 | $17.4 | 10.30% |
| Kansas | $171.7 | $9.3 | 5.40% |
| Kentucky | $257.0 | $140.6 | 54.70% |
| Louisiana | $281.2 | $31.1 | 11.07% |
| Maine | $186.6 | $46.3 | 24.80% |
| Maryland | $833.4 | $196.2 | 23.54% |
| Massachusetts | $1,277.6 | $342.2 | 26.79% |
| Michigan | $1,430.3 | $110.0 | 7.69% |
| Minnesota | $444.2 | $83.0 | 18.69% |
| Mississippi | $97.6 | $4.3 | 4.38% |
| Missouri | $392.5 | $14.6 | 3.72% |
| Montana | $38.2 | $10.7 | 28.02% |
| Nebraska | $95.3 | $17.6 | 18.42% |
| Nevada | $121.7 | $24.6 | 20.24% |
| New Hampshire | $65.9 | $27.6 | 41.93% |
| New Jersey | $1,700.9 | $87.8 | 5.16% |
| New Mexico | $251.6 | $42.3 | 16.81% |
| New York | $5,055.9 | $1,400.5 | 27.70% |
| North Carolina | $599.4 | $24.9 | 4.16% |
| North Dakota | $26.3 | $2.1 | 8.18% |
| Ohio | $1,172.5 | $215.0 | 18.34% |
| Oklahoma | $210.6 | $10.6 | 5.04% |
| Oregon | $259.8 | $81.6 | 31.39% |
| Pennsylvania | $1,022.6 | $102.3 | 10.01% |
| Rhode Island | $153.8 | $14.5 | 9.40% |
| South Carolina | $143.3 | $31.6 | 22.07% |
| South Dakota | $31.3 | $12.9 | 41.18% |
| Tennessee | $335.2 | $82.5 | 24.61% |
| Texas | $884.2 | $17.1 | 1.94% |
| Utah | $94.7 | $18.8 | 19.83% |
| Vermont | $102.8 | $13.3 | 12.89% |
| Virginia | $302.9 | $86.7 | 28.62% |
| Washington | $1,322.7 | $231.4 | 17.49% |
| West Virginia | $119.7 | $43.1 | 36.04% |
| Wisconsin | $447.7 | $56.6 | 12.64% |
| Wyoming | $31.0 | $15.8 | 51.07% |
Source: CBPP analysis of Department of Health and Human Services 2023 TANF financial data | |||
End Notes
[1] Maria Manansala was an intern with the Housing and Income Security team from June 2024 through May 2025.
[2] Wesley Tharpe, “Roundup: State Budgets Increasingly Strained as House, Senate Republican Plans Would Impose Major Costs,” CBPP, June 24, 2025, https://www.cbpp.org/research/state-budget-and-tax/roundup-state-budgets-increasingly-strained-as-house-senate.
[3] Aditi Shrivastava and Urvi Patel, “Research Reinforces: Providing Cash to Families in Poverty Reduces Risk of Family Involvement in Child Welfare,” CBPP, May 1, 2023, https://www.cbpp.org/research/income-security/research-reinforces-providing-cash-to-families-in-poverty-reduces-risk-of.
[4] Victoria Bowden, Diana Azevedo-McCaffrey, and Maria Manansala, “AFDC and TANF Caseload and Poverty Data,” CBPP, updated April 11, 2025, https://www.cbpp.org/research/income-security/afdc-and-tanf-caseload-and-poverty-data.
[5] For more, see CBPP, “Policy Basics: Temporary Assistance for Needy Families,” updated March 1, 2022, https://www.cbpp.org/research/family-income-support/policy-basics-an-introduction-to-tanf.
[6] Kendra Bozarth, Grace Western, and Janelle Jones, “Black Women Best: The Framework We Need for An Equitable Economy,” Roosevelt Institute and Groundwork Collaborative, September 2020, https://rooseveltinstitute.org/wp-content/uploads/2020/09/RI_Black-Women-Best_IssueBrief-202009.pdf. For a discussion of applying the Black Women Best framework to TANF policy, see Ife Floyd et al., “TANF Policies Reflect Racist Legacy of Cash Assistance,” CBPP, August 4, 2021, https://www.cbpp.org/research/income-security/tanf-policies-reflect-racist-legacy-of-cash-assistance.