

WIC’s Critical Benefits Reach More of Those Eligible Than in Recent Years
But More than 4 in 10 Eligible People Still Miss Out, Creating an Opportunity for States to Improve Pregnancy-Related, Child Health
The federally funded WIC program — the Special Supplemental Nutrition Program for Women, Infants, and Children — improves lifetime health for low-income pregnant and postpartum people, infants, and young children. The share of eligible people who participated in WIC increased from 2021 to 2023, a positive trend following a multi-year decline that bottomed out in 2021 during the COVID-19 pandemic. But even with the recent uptick, the program is underutilized — more than 4 in 10 eligible people miss out. This has no single cause and has occurred despite adequate funding to serve all eligible applicants for more than 25 years. So long as this bipartisan commitment to providing enough funding to serve all eligible families is maintained, governors and state policy officials, program administrators, health care providers, and the maternal and child health community can all take steps to help more eligible families enroll in this vital program.
WIC is a cost-effective program that provides nutritious foods, nutrition education, breastfeeding support, and referrals to health care and social services to nearly 7 million people in families with low incomes.[2] It has been part of the nation’s nutrition safety net for 50 years. Extensive research shows that participating in WIC leads to healthier infants, more nutritious diets and better health care for children, and later to stronger school performance for students.[3]
The share of eligible individuals who participated in WIC, referred to as the coverage rate, increased during 2023 according to the most recent estimates published by the U.S. Department of Agriculture (USDA).[4] The USDA report attributes the higher coverage rate to a 5 percent increase in the number of WIC participants between 2022 and 2023 while the estimated number of WIC eligible individuals remained about the same (increasing by a mere 0.3 percent). While this is a positive change following multiple years of decline, still only 56.1 percent of eligible individuals participated in WIC in 2023. Moreover, coverage rates vary widely by geography and participant group, and fewer than half of eligible individuals in some groups participated.
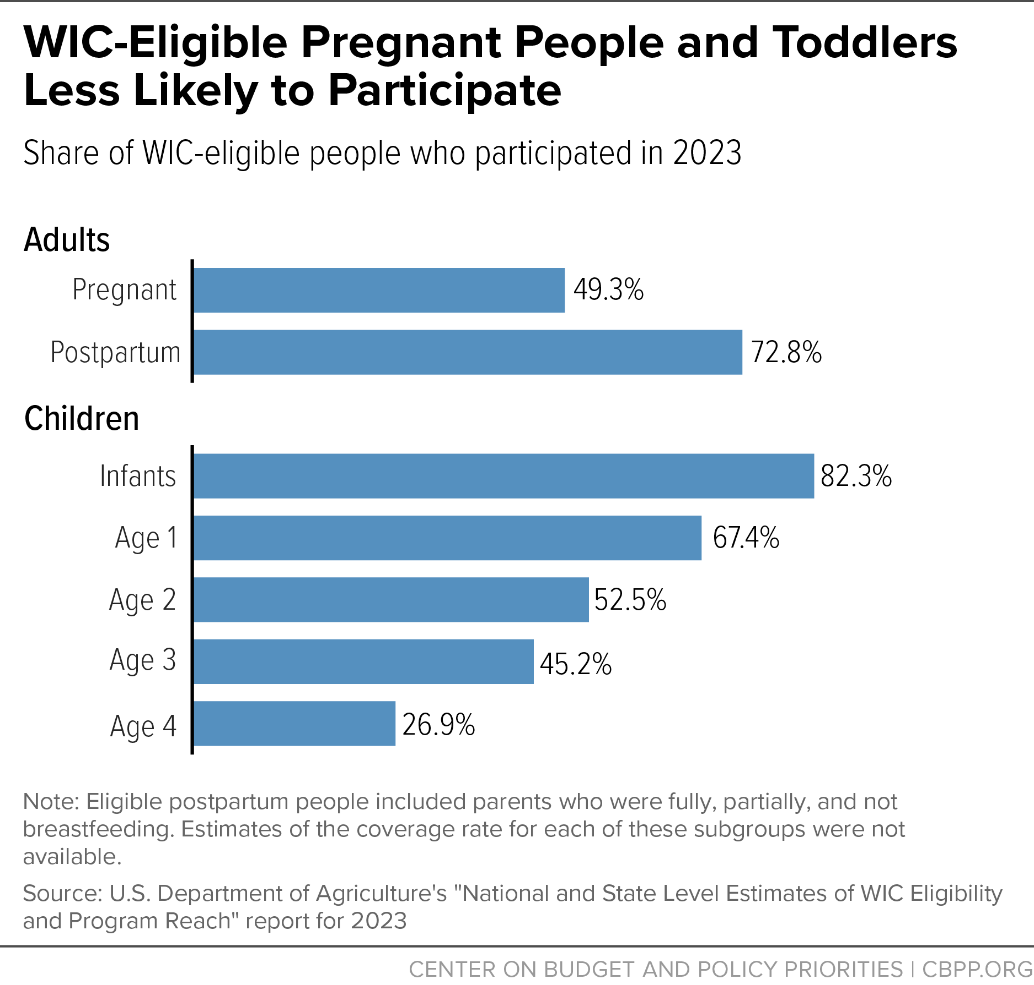
- There were 82.4 percent of eligible infants who participated, but take-up declines as they grow up; just over two-thirds of eligible 1-year-olds participated (67.4 percent) and just over half of eligible 2-year-olds participated (52.5 percent), while fewer than half of eligible 3-year-olds participated (45.2 percent) and only about a quarter (26.9 percent) of eligible 4-year-olds participated.
- Eligible postpartum people participated at higher rates (72.8 percent) than eligible pregnant people (49.3 percent).[5]
- People living in metropolitan areas participated at more than twice the rate (61.1 percent) of those living in non-metropolitan areas (24.0 percent).
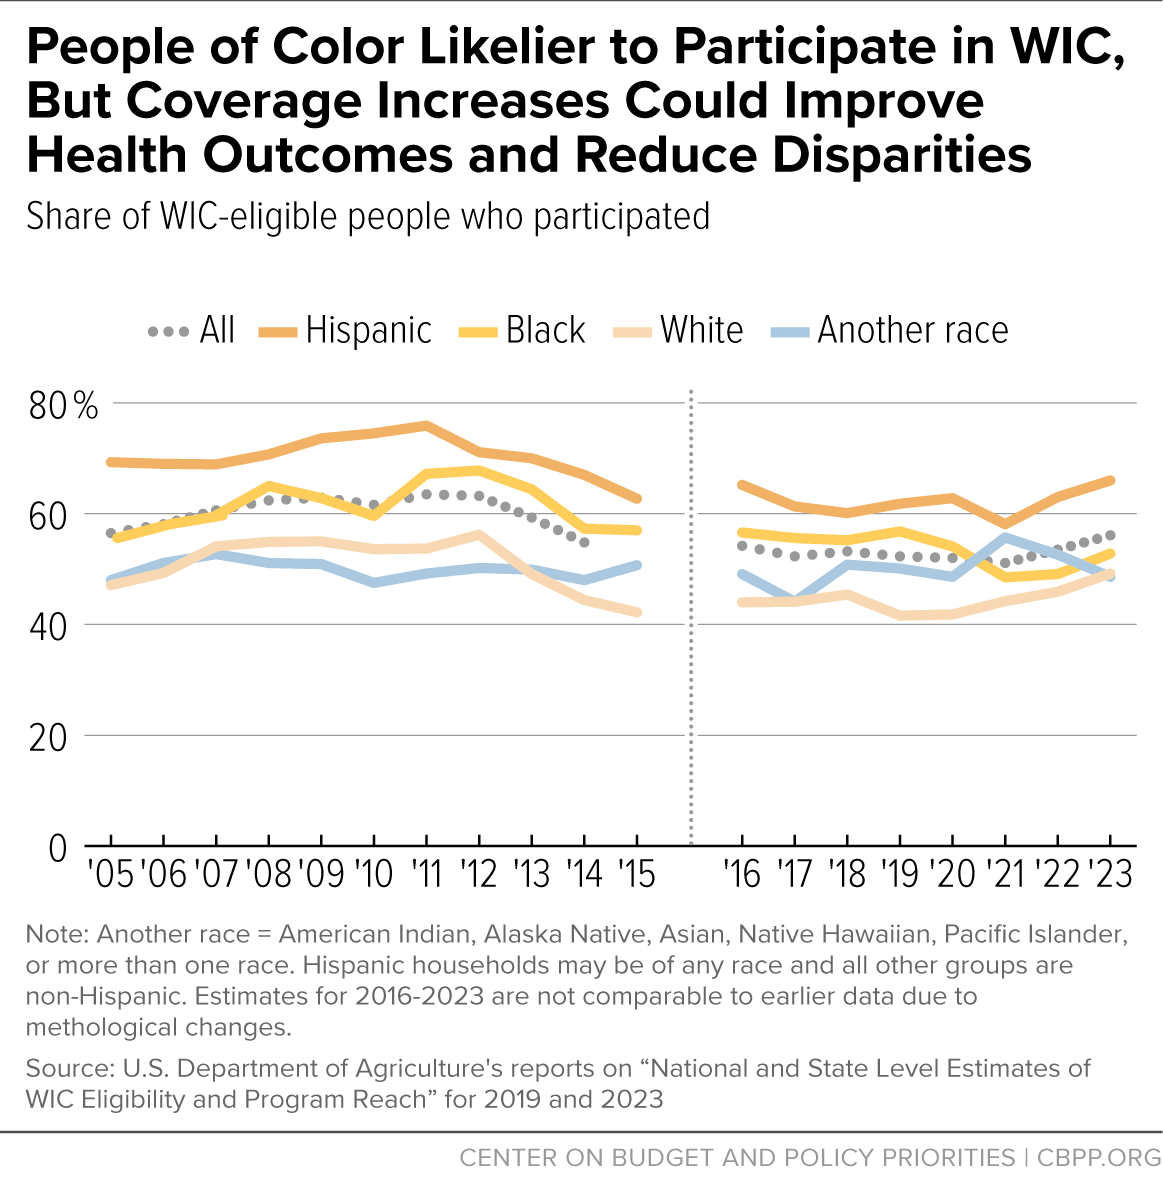
- Hispanic people (66.0 percent) and Black people (52.8 percent) had higher coverage rates than white people (49.2 percent).[6]
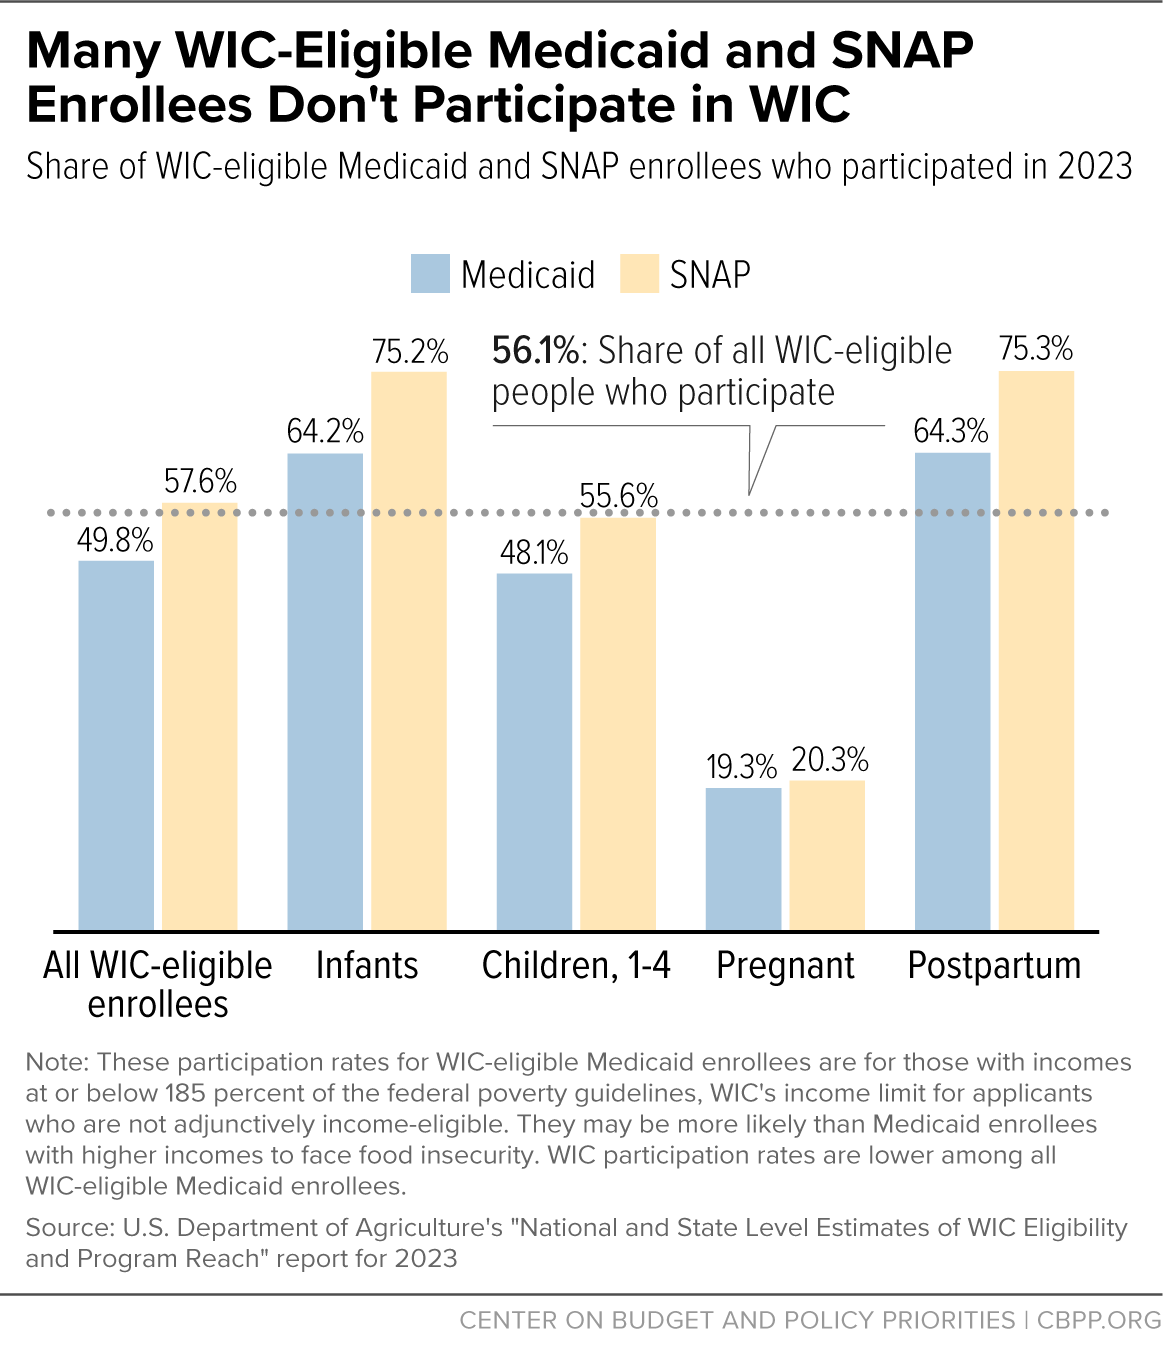
- Nearly half of WIC-eligible people enrolled in Medicaid or the Supplemental Nutrition Assistance Program (SNAP) did not access WIC, with 4 in 5 WIC-eligible pregnant Medicaid and/or SNAP enrollees missing out.
- Across the 50 states and the District of Columbia, coverage rates in 2023 ranged from 41.3 to 79.6 percent.
- Changes in state coverage rates since 2016 (the earliest year for which comparable estimates are available) also varied substantially, with some increasing by as much as 22.1 percentage points and others declining by as much as 9.2 percentage points.
WIC participation is associated with reduced risk of premature birth, low birthweight, and infant mortality. This is especially important because pregnancy-related complications and mortality, as well as infant mortality, are higher for families of color than for white families due to unequal access to health care and broader inequities in health, economic, and other systems for people of color.
Thus, increasing WIC coverage across the board — and for pregnant people of color and their children in particular — can be an important part of a strategy to improve pregnancy-related and child health, mitigate the large pregnancy-related health disparities affecting these communities, and advance racial equity in other aspects of pregnancy-related and child health and food security.[7]
WIC utilization can be measured in two ways. WIC coverage rates show the share of eligible people who participated in the program during one calendar year. USDA estimates coverage rates for each year retrospectively by comparing the number of WIC participants to the estimated number of people who were eligible. The most recent USDA coverage rate estimates are for 2023. WIC participation data show the number of people participating in the program. USDA publishes participation data each month for each state agency, and data for past years remain available.[8]While WIC coverage rates for 2024 and 2025 are not yet available, nationwide average monthly participation increased by 4.4 percent between fiscal years 2023 and 2025. This trend is a promising sign that participation among eligible families may be regaining some lost ground.
Most states experienced participation growth over this period, but state changes in WIC participation ranged from a 14.9 percent decrease to a 22.7 percent increase. In 28 states and the District of Columbia, participation grew at more than the nationwide rate; in ten states and Puerto Rico, participation grew but at less than the nationwide rate; and in 12 states, participation fell.[9]
State variation in coverage and participation trends suggests that state policies and practices can affect WIC utilization. By adopting promising practices and exploring new approaches, policymakers and program administrators can get WIC’s valuable benefits to an even larger share of eligible people over time.[10]
This report summarizes WIC coverage rates over time, among specific groups, and across states. We’ve also published state-by-state fact sheets showing WIC coverage rates and participation over time across various categories, along with maternal and child health measures and an estimate of the additional funding each state would have received with a higher coverage rate.[11]
Share of Eligible People Who Receive WIC Is Rising Along With Participation
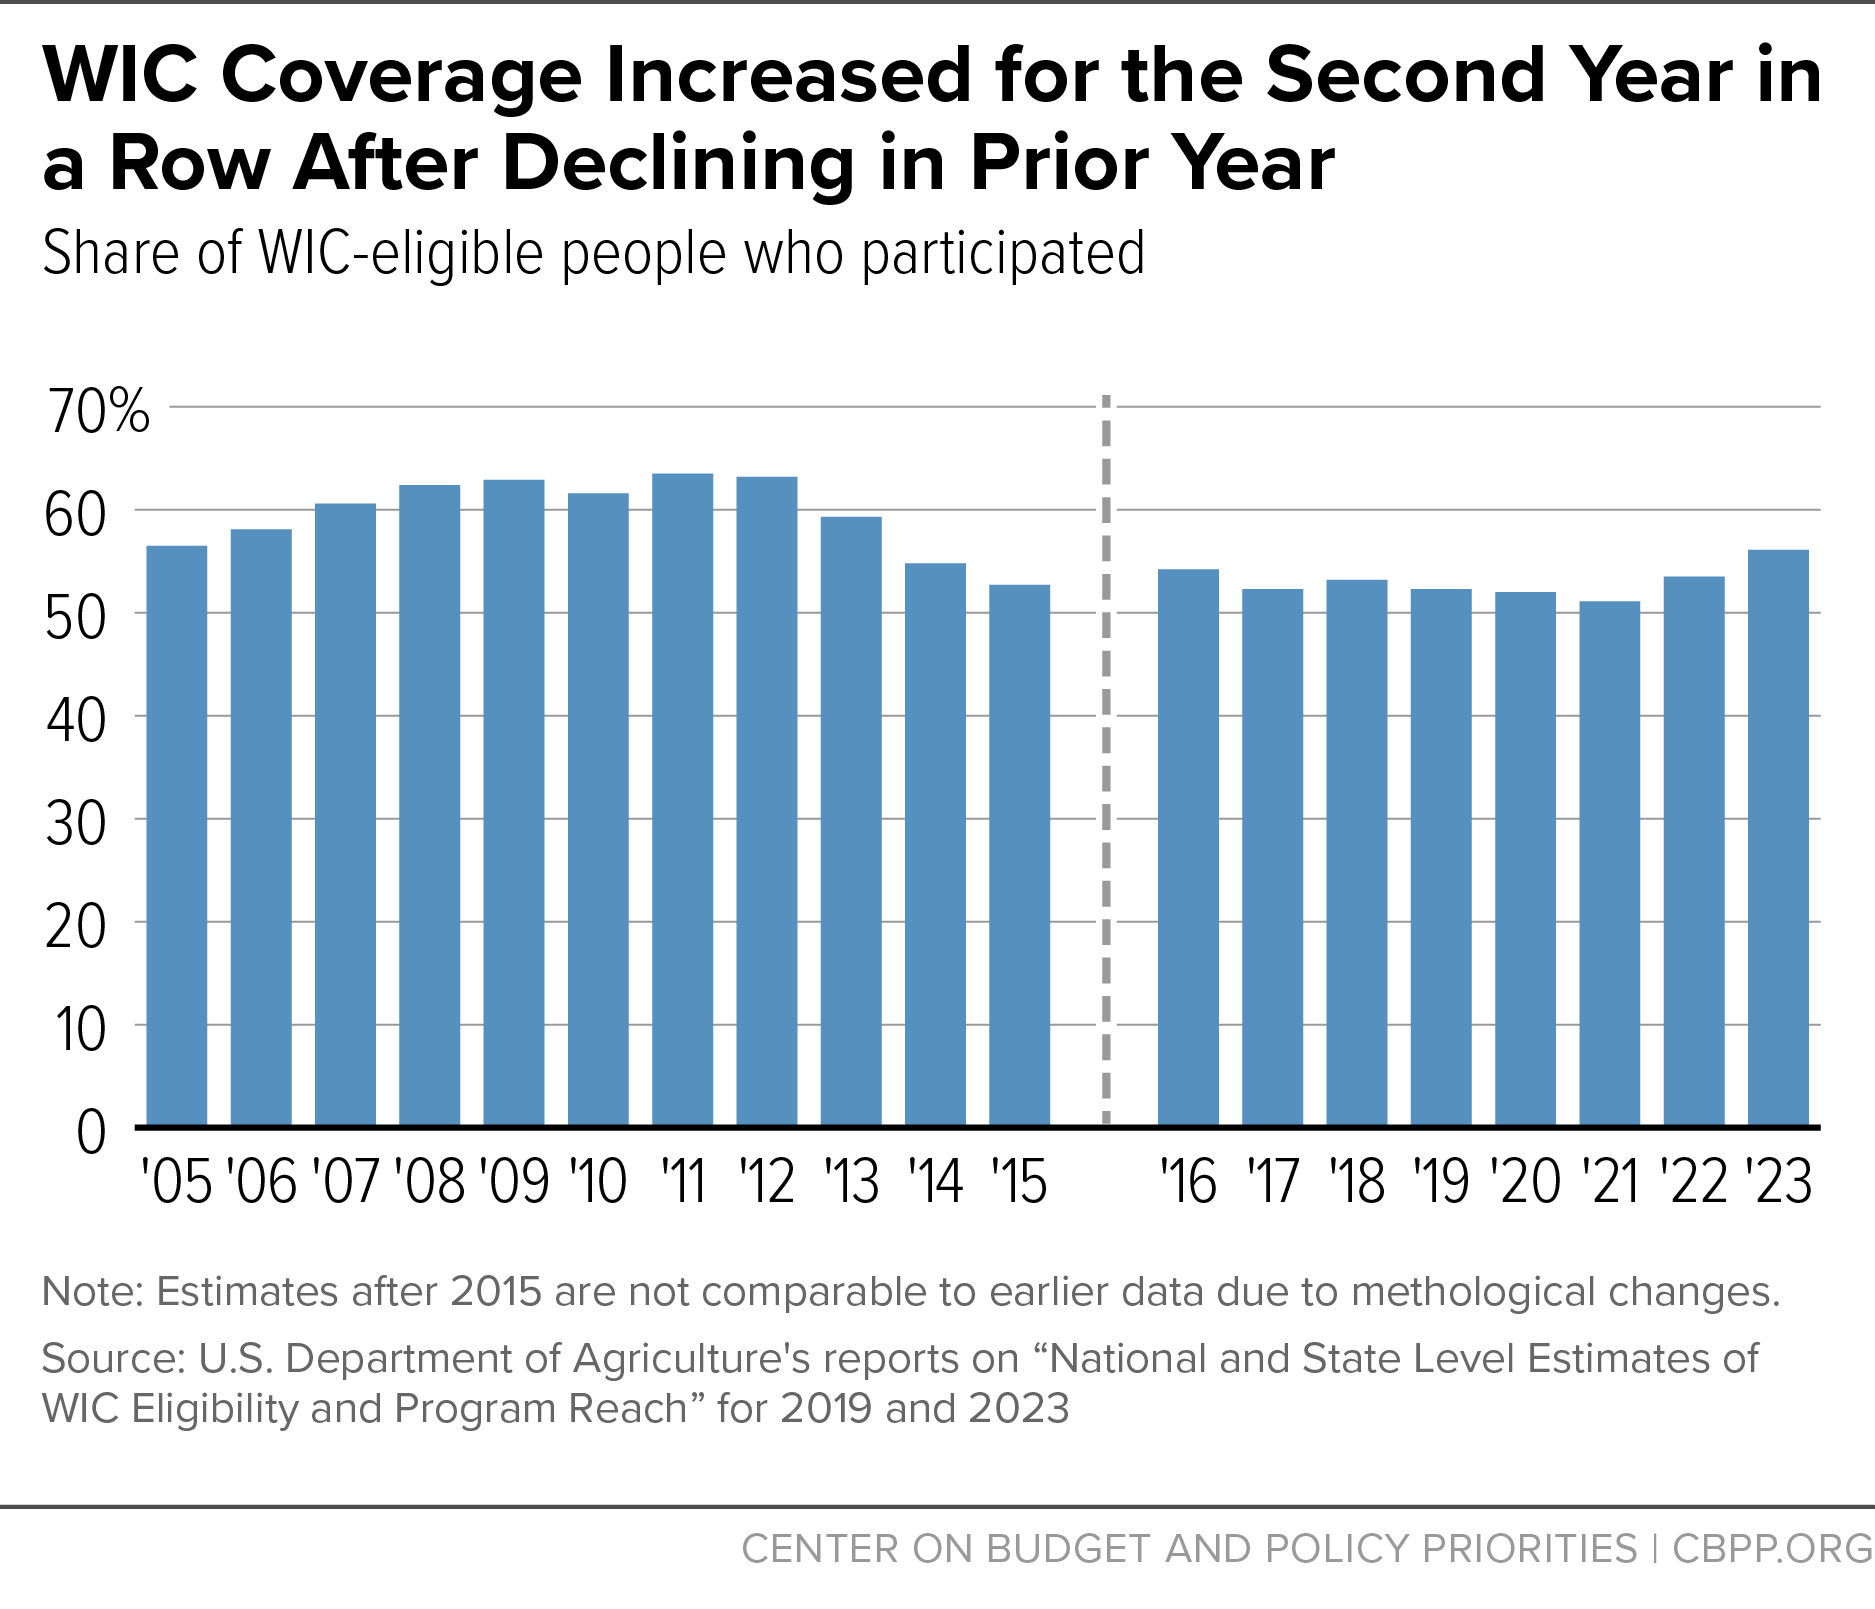
A little over half (56.1 percent) of those eligible for WIC participated in the program in 2023 according to USDA, which administers WIC.[12] The WIC coverage rate — the share of eligible individuals who participate — declined between 2016 (54.2 percent) and 2019 (52.3 percent). The coverage rate then remained steady into 2020 (52.0 percent), a testament to the program’s resilience as the pandemic set in, parents lost work, and its operations had to transform overnight. WIC take-up declined to a low in 2021, when only 51.2 percent of eligible individuals participated, but coverage rose over the following two years to 53.5 percent in 2022 and 56.1 percent in 2023, exceeding the 2016 level.
The WIC coverage rates after 2015 are not comparable to earlier rates due to a change in USDA’s methodology for estimating the eligible population. Nonetheless, we can compare earlier trends to more recent ones. USDA data through 2015 show WIC coverage declined from a peak of 63.5 percent in 2011 to 52.7 percent in 2015. Similarly, USDA data show a decline from 54.2 percent in 2016 to 51.2 percent in 2021 before the 2022 and 2023 upticks.[13] (See Figure 1.)

It is unclear whether the trend of increasing coverage will continue because estimates of coverage rates more recent than 2023 are not yet available, but participation has increased since then. Between fiscal years 2023 and 2025, average monthly participation grew by 4.4 percent nationwide, increasing the average number of people served each month by 290,000.
The participation increase does not necessarily mean that coverage has increased because estimates of the number of eligible people over this period are not yet available. But the increase is a promising sign that the share of eligible people who participate may be increasing and a sure sign that WIC is providing assistance to and improving the health outlook for more families.
Coverage Rates in 2023 Remained Lower or Stagnant for Non-White Families Compared to in 2016
WIC coverage increased for Black, Hispanic, and white families and decreased for individuals identified as “another race” (non-Hispanic and American Indian, Alaska Native, Asian, Native Hawaiian, Pacific Islander or more than one race). While coverage rates for white families were higher than in 2016, rates for people of another race or multiple races were lower and Hispanic and Black families only made up for previous declines.
As in past years, Hispanic families (66.0 percent) and Black families (52.8 percent) had higher coverage rates than white families (49.2 percent) in 2023. While the share of eligible Black people receiving WIC in 2023 has increased since 2021, it remains lower than in 2016 by 3.8 percentage points. Coverage for Hispanic people has just returned to its 2016 rate, passing it by 0.8 percentage points after eight years. The coverage rate of 49.2 percent for white people in 2023 increased the most (5.2 percentage points) compared to 2016, when it was 44.0 percent. For the second year in a row, coverage among people of another race or multiple races declined (to 48.6 percent), moving them 0.5 percentage points below their 2016 rate. This decrease appears to be driven by an increase in the estimated number of eligible people in this group since the number of WIC participants in this group was roughly the same for the past two years. (See Figure 2.) We are unable to assess more recent trends because administrative participation data do not include race or ethnicity.

People of color are much likelier than white people to experience adverse pregnancy-related and infant health outcomes, such as pregnancy complications and maternal and infant mortality. They are also likelier to experience food insecurity. So, it is noteworthy that coverage rates increased for Black and Hispanic people between 2022 and 2023, by 3.7 and 3.0 percentage points, respectively. Given the strong evidence that WIC supports healthier pregnancies and births, the program may already be reducing some racial disparities in health and food insecurity.
Yet even with their higher coverage rates and the increase compared to 2022, one-third of eligible Hispanic people missed out on WIC in 2023, as did nearly half of eligible Black individuals. Increasing WIC coverage rates across racial and ethnic groups could help alleviate the nationwide crisis in pregnancy-related health issues while also contributing to gains in racial equity in pregnancy-related outcomes, child health, and food security. Our state fact sheets include estimated state coverage rates by race to help state leaders and stakeholders target outreach and retention efforts.
WIC Utilization Lowest for Pregnant People, 1- to 4-Year-Olds
Coverage rates in 2023 were lowest among pregnant people and non-infant children, as they have been each year since 2005. While take-up by new and expecting parents are both alarmingly low, only 49.3 percent of eligible pregnant people participated, compared to 72.8 percent of eligible postpartum people. As a result, over 550,000 WIC-eligible people went unserved in 2023 during some or all of their pregnancy, missing out on the nutrition services and food assistance that have been shown to improve pregnancy outcomes.
Nearly 4 million eligible 1- to 4-year-olds — more than a quarter of all children of that age — also missed out on WIC’s health and developmental benefits. Coverage drops off as children age; while 82.3 percent of eligible infants participated, just over two-thirds of eligible 1-year-olds participated in WIC (67.4 percent) and by age 4 only about one-quarter of eligible children (26.9 percent) received benefits. Between 2022 and 2023, there was a small uptick in coverage for 1- and 2-year-old children, with just over half of 2-year-old children participating in 2023 (52.5 percent), but coverage for 3- and 4-year-old children continued to lag behind (45.2 percent and 26.9 percent, respectively). (See Figure 3.) And while coverage rates vary by state, the rates are lower for adults and children than for infants in nearly every state and the District of Columbia.
While WIC coverage rates for 2024 and 2025 are not yet available, participation data show that the monthly average number of children ages 1 to 4 served during fiscal year 2025 was 6.0 percent higher than in fiscal year 2023. This could represent a promising start to reversing the downward trend in child participation, but filling the sizable coverage gap will require an ongoing commitment to addressing the barriers to participating in WIC. Another promising development: the average number of pregnant people served each month has been increasing, with 4.0 percent more participating in fiscal year 2025 than in fiscal year 2023.[14]

Many SNAP, Medicaid Participants Not Participating in WIC
Pregnant and postpartum people, infants, and children under age 5 who receive Medicaid or SNAP benefits are automatically considered income-eligible for WIC, but many do not participate. Eligible families’ take-up of Medicaid and SNAP is much more robust than it is for WIC.[15]
USDA estimates that nationwide, nearly half of WIC-eligible people receiving Medicaid or SNAP (or both) did not access WIC in 2023, and much higher shares of certain groups missed out on WIC.[16] Among WIC-eligible Medicaid enrollees with incomes at or below 185 percent of the federal poverty guidelines (WIC’s limit for families not enrolled in these programs), only 19.3 percent of eligible pregnant people and 48.1 percent of children aged 1 through 4 participated in WIC. Similar percentages of pregnant people (20.3 percent) and children ages 1 through 4 (55.6 percent) enrolled in SNAP participated in WIC. (See Figure 4.)

By not only measuring the overall gap but analyzing the gap based on specific criteria — such as geography, WIC participant category (pregnant, postpartum, infant, or child aged 1 through 4), or race — states can design targeted enrollment and retention strategies. State WIC agencies can work with state Medicaid agencies to automatically refer Medicaid applicants and enrollees to WIC and to promote referrals by managed care organizations, health care providers, and community-based health workers.[17]
For example, in some states the WIC agency is partnering with the Medicaid and/or SNAP agency to identify enrollees in those programs who are eligible for WIC but not participating.[18] This strategy is working; states have demonstrated that targeted outreach and streamlined enrollment for families who are income-eligible for WIC but not enrolled can improve WIC certification rates.[19] USDA is supporting partnerships between WIC and Medicaid or SNAP and making funding and technical assistance for data matching and targeted outreach available to WIC state agencies through the MORE WIC! project.[20]
WIC Utilization Varies Widely by State
WIC coverage rates vary considerably from state to state, from 41.3 percent to 79.6 percent in 2023, suggesting that state administration of the program can significantly affect access to WIC.[21] In 2023, 19 states had fewer than 50 percent of eligible people participate; only in two states and Puerto Rico did more than 70 percent of eligible people participate.[22] (See Figure 5.)

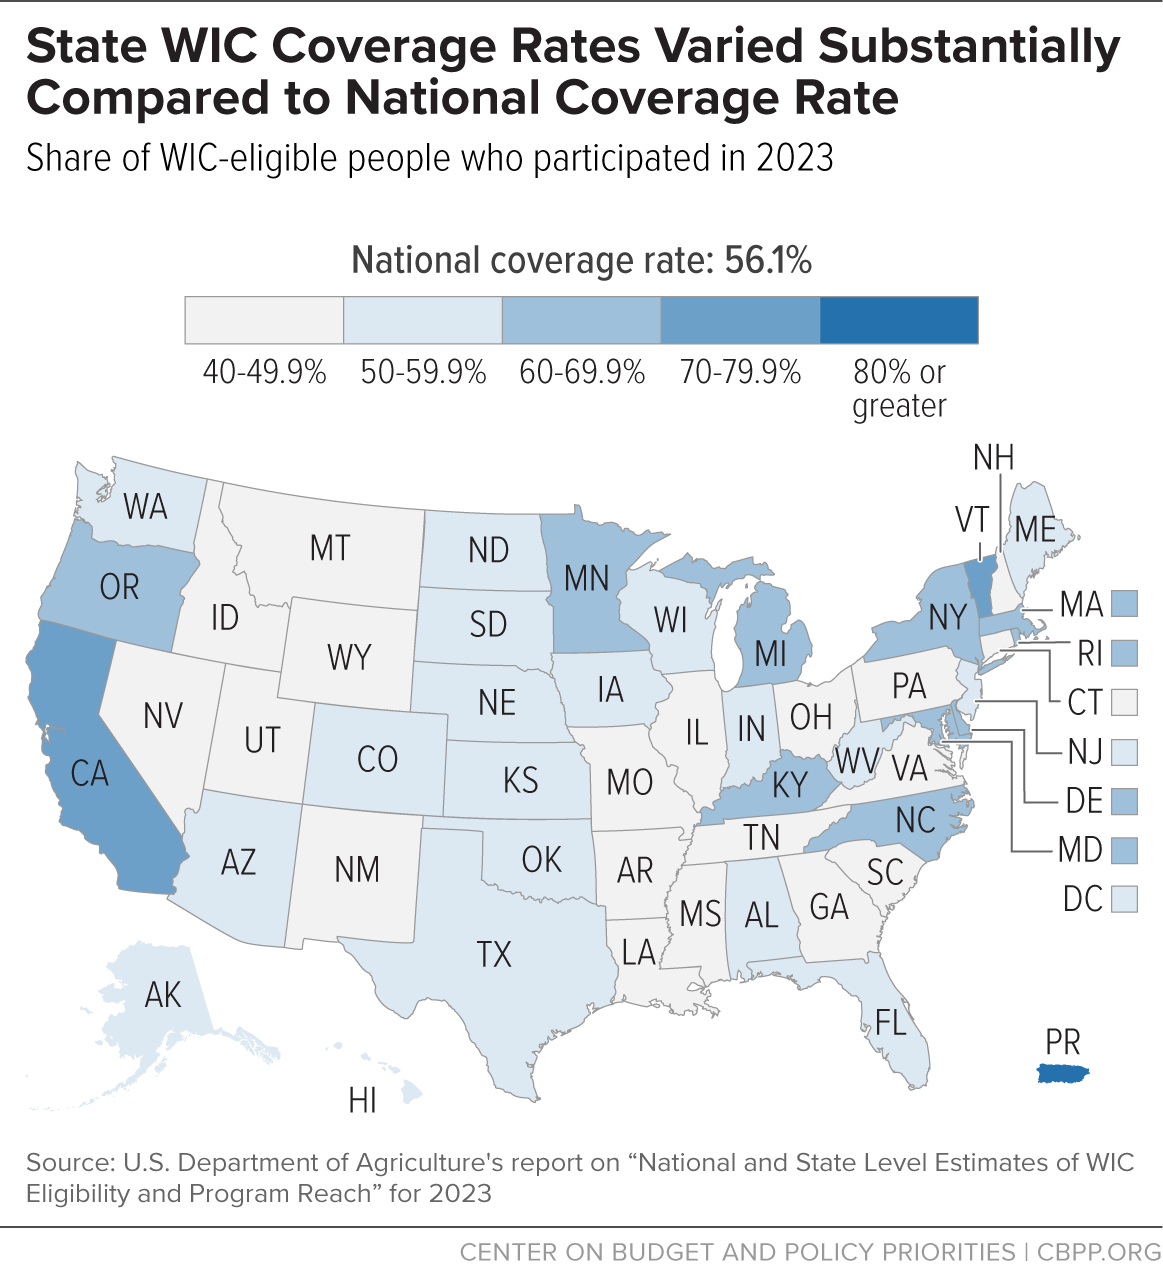
WIC coverage across states has always varied due, in part, to population and environmental factors that impact WIC take-up. For example, the racial and ethnic composition of the WIC-eligible population differs among states and, as shown in Figure 2, coverage rates vary for racial and ethnic groups. State economies also differ in ways that may influence WIC participation, such as the cost of housing, food, and transportation, and the availability of employment. The share of a state’s population living in rural and urban areas can impact WIC take-up since eligible families living in non-metropolitan areas are much less likely to participate in WIC than eligible families living in metropolitan areas (see box below). While state WIC agencies cannot change these factors, they can assess how they impact families’ decisions about participating in WIC and take steps to address barriers to accessing and using WIC services.
Variation in WIC coverage across states may also reflect that states have discretion over some policies and procedures and can take steps to increase coverage. For example, some state and local WIC program administrators are streamlining WIC enrollment practices, partnering with other programs to reach WIC-eligible individuals, and employing other strategies to recruit and retain participants.[23] By exploring and adopting such practices, policymakers and program administrators can reach an even larger share of people eligible for WIC with its valuable benefits.
WIC Coverage Has Grown or Held Steady in Most States Since 2016
Over the period between 2016 and 2023, when USDA used a consistent methodology, most states’ coverage rates declined in the first several years. The lowest coverage rates were in 2021 during the COVID-19 pandemic. Coverage rates for most states then started to rebound in 2022, resulting in a higher national coverage rate in 2023 than in 2016. But during that period the gap between the geographic states with the highest and lowest coverage rates has widened from 24 percentage points in 2016 to 38 percentage points in 2023.
Figure 6 illustrates how coverage rates for the 50 states, District of Columbia, and Puerto Rico changed between 2016 and 2023. During this period, the coverage rate nationwide increased by 1.85 percentage points. In about half of the states (25, including the District of Columbia and Puerto Rico), coverage grew by more than 1.85 percentage points; nine of these states had higher increases, ranging from 8 to 22 percentage points. Fourteen states had relatively stable coverage rates during this period, with increases or decreases of less than 1.85 percentage points. For 13 states, coverage declined by more than 1.85 percentage points during this period, with four states experiencing steep decreases of 8 to 9 percentage points.
All different kinds of states throughout the country have increased coverage rates between 2016 and 2023, including states with very large and very small populations. They are racially and ethnically diverse, and several of them have large rural populations. Unemployment rates and cost of living in these states range vastly, from among the highest to among the lowest in the nation. The diversity of states in this group suggests that WIC policies and practices can be tailored to boost WIC participation in a wide range of circumstances.
Although coverage estimates more recent than 2023 are not yet available, participation data show sizable variation in changes since 2023 across states.[24] Between fiscal years 2023 and 2025, participation grew by 4.4 percent nationwide. While most states experienced participation growth over this period, state changes in WIC participation ranged widely, from a 22.7 percent increase to a 14.9 percent decrease. In 28 states and the District of Columbia, participation grew at more than the nationwide rate; in ten states and Puerto Rico, participation grew but at less than the nationwide rate; and in 12 states participation fell.[25] The state fact sheets accompanying this report contain WIC coverage and monthly participation data, as well as selected maternal and child health measures.[26] They are a resource for understanding WIC trends for each state. To assist state WIC agencies with efforts to address participation barriers and increase WIC coverage, we compiled examples of innovative practices implemented in states across the nation, including strategies to: enhance outreach and referrals; improve access, convenience, and quality of WIC services; increase state coordination across programs; improve the shopping experience; and assess state policies and priorities.[27] Additional ideas for increasing WIC uptake and improving program services are included in the National WIC Association WIC Hub.[28]
WIC is a vital food assistance and nutrition education resource that is underutilized in all states. By implementing strategies to increase WIC participation, states can improve pregnancy-related and child health, reduce food hardship among families with children, and bring in additional federal funding that strengthens local food environments. WIC does not require states to contribute to program costs, so states can make improvements to increase participation without increasing their own costs. By leveraging promising practices that make it easier for families to access and use WIC services, states have a unique opportunity to build on recent increases in participation to reach an even greater share of eligible families and improve their health and well-being.
End Notes
[1] This report was prepared with support from Linnea Sallack, an independent consultant formerly with the Altarum Institute and the California Special Supplemental Nutrition Program for Women, Infants, and Children (WIC) program.
[2] Food and Nutrition Service (FNS), U.S. Department of Agriculture (USDA), WIC administrative data, updated January 23, 2026, https://www.fns.usda.gov/pd/wic-program; for more information on how WIC operates, see Center on Budget and Policy Priorities (CBPP), “Policy Basics: Special Supplemental Nutrition Program for Women, Infants, and Children,” updated April 11, 2025, https://www.cbpp.org/research/food-assistance/special-supplemental-nutrition-program-for-women-infants-and-children.
[3] Steven Carlson, Joseph Llobrera, and Zoë Neuberger, “WIC Works: A Cost-Effective Investment in Improving Low-Income Families’ Nutrition and Health,” CBPP, updated January 20, 2026, www.cbpp.org/wicworks.
[4] USDA FNS, “National and State-Level Estimates of WIC Eligibility and Program Reach in 2023,” December 2025, https://www.fns.usda.gov/research/wic/eer-2023.
[5] Writing about pregnancy has often assumed cisgender identities, with the use of terms like “pregnant women.” Such language excludes people who are transgender or non-binary who give birth. In this report we attempt to be more inclusive by referring to pregnant people or using other non-gendered language wherever possible, while in places using gendered labels to avoid misrepresenting the data we are citing.
[6] Estimates for U.S. territories other than Puerto Rico are not included in the calculation of these coverage rates because information on race and ethnicity for the other U.S. territories was not available in the data. Non-Hispanic people who are American Indian, Alaska Native, Asian, Native Hawaiian, Pacific Islander, or of multiple races had a coverage rate of 48.6 percent. Hispanic people, whom USDA refers to as “Hispanic/Latino,” may be of any race while the other racial and ethnic groups are not Hispanic.
[7] A more detailed description of how WIC contributes to improvements in maternal and child health and food security while helping state and local economies is available in the “Increasing WIC Utilization Can Have Widespread Benefits” section of Zoë Neuberger, Luis Nuñez, and Linnea Sallack, “WIC’s Critical Benefits Reach Only Half of Those Eligible,” CBPP, updated May 8, 2025, https://www.cbpp.org/research/food-assistance/wics-critical-benefits-reach-only-half-of-those-eligible-0#increasing-wic-utilization-can-have-cbpp-anchor.
[8] WIC participation data going back several years are available at: USDA FNS, WIC administrative data, updated January 23, 2026, https://www.fns.usda.gov/pd/wic-program. Participation data do not include enrollees who have not obtained their food benefits.
[9] USDA FNS, WIC administrative data, updated January 23, 2026, https://www.fns.usda.gov/pd/wic-program.
[10] See Zoë Neuberger, Luis Nuñez, and Linnea Sallack, “WIC’s Critical Benefits Reach Only Half of Those Eligible,” CBPP, updated May 8, 2025, www.cbpp.org/wiccoveragereport. The section on “How to Increase WIC Utilization” identifies likely participation barriers, and highlights specific strategies that state and local WIC leaders can employ to reduce barriers so more eligible families will enroll and participate for longer (see: https://www.cbpp.org/research/food-assistance/wics-critical-benefits-reach-only-half-of-those-eligible-0#how-to-increase-wic-utilization-cbpp-anchor).
[11] See CBPP, “State Fact Sheets: Trends in WIC Coverage and Participation,” updated March 25, 2026, www.cbpp.org/wiccoveragefactsheets.
[12] USDA FNS, 2025, op. cit.
[13] USDA FNS, 2025, op. cit.
[14] The average number of pregnant people served each month increased by 2.1 percent in fiscal year 2022, by 5.8 percent in fiscal year 2023, by 2.8 percent in fiscal year 2024, and by 1.2 percent in fiscal year 2025. USDA FNS, WIC administrative data, updated January 23, 2026, https://www.fns.usda.gov/pd/wic-program.
[15] In 2019, 92 percent of children eligible for Medicaid/CHIP participated. See KFF, “Medicaid/CHIP Child Participation Rates,” https://www.kff.org/medicaid/state-indicator/medicaidchip-child-participation-rates/. While data on SNAP take-up for children are not available, 88 percent of all eligible individuals participated in SNAP in 2022. See USDA, “Trends in USDA SNAP Participation Rates: Fiscal Year 2020 and Fiscal Year 2022,” October 2024, https://www.fns.usda.gov/research/snap/trends-fy20and22. State SNAP participation rates for 2022 are available at USDA, “Reaching Those in Need: Estimates of State SNAP Participation Rates 2022,” February 2025, https://www.fns.usda.gov/research/snap/state-participation-rates/2022.
[16] USDA FNS, 2025, op. cit.
[17] For more information about how state Medicaid and WIC agencies can collaborate to increase WIC take-up, see Sonya Schwartz et al., “State Medicaid Agencies Can Partner With WIC Agencies to Improve the Health of Pregnant and Postpartum People, Infants, and Young Children,” CBPP and Georgetown Center for Children and Families, December 20, 2023, Figure 2, https://www.cbpp.org/research/food-assistance/state-medicaid-agencies-can-partner-with-wic-agencies-to-improve-the and CBPP, “WIC and Medicaid Collaboration Landscape Toolkit,” December 20, 2024, www.cbpp.org/wicmedicaidlandscape.
[18] Zoë Neuberger, “WIC Coordination with Medicaid and SNAP,” CBPP, October 8, 2024, https://www.cbpp.org/wiccollaborationsurvey.
[19] Jess Maneely and Zoë Neuberger, “Using Data Matching and Targeted Outreach to Enroll Families with Young Children in WIC,” CBPP, January 5, 2021, https://www.cbpp.org/research/food-assistance/using-data-matching-and-targeted-outreach-to-enroll-families-with-young.
[20] For more information see: Johns Hopkins Bloomberg School of Public Health, “MORE WIC!” https://publichealth.jhu.edu/departments/international-health/research-and-practice/centers-and-research-groups/more-wic.
[21] Puerto Rico’s coverage rate was 83.8 percent.
[22] Statistical reliability of individual state coverage rate estimates varies by state, mainly due to sample size. For a range of likely true values, see Figure 3.5 in USDA, FNS, op. cit.
[23] See Zoë Neuberger, “WIC Coordination with Medicaid and SNAP,” CBPP, October 8, 2024, https://www.cbpp.org/wiccollaborationsurvey and Zoë Neuberger, “WIC State Agencies Continue to Use Federal Flexibility to Streamline Enrollment,” CBPP, updated December 19, 2024, www.cbpp.org/wiccertificationpolicies.
[24] For a more detailed discussion of state variation in WIC participation during the first year of the pandemic, see Lauren Hall and Zoë Neuberger, “Eligible Low-Income Children Missing Out on Crucial WIC Benefits During Pandemic,” CBPP, updated October 5, 2021, https://www.cbpp.org/research/food-assistance/eligible-low-income-children-missing-out-on-crucial-wic-benefits-during.
[25] USDA FNS, WIC administrative data, updated January 23, 2026, https://www.fns.usda.gov/pd/wic-program.
[26] These state fact sheets are available at: www.cbpp.org/wiccoveragefactsheets.
[27] See Zoë Neuberger, Luis Nuñez, and Linnea Sallack, “WIC’s Critical Benefits Reach Only Half of Those Eligible,” CBPP, updated May 8, 2025, Appendix, https://www.cbpp.org/research/food-assistance/wics-critical-benefits-reach-only-half-of-those-eligible-0#appendix-cbpp-anchor.
[28] See: WIC Hub, https://thewichub.org/.